
 ?Mathematical formulae have been encoded as MathML and are displayed in this HTML version using MathJax in order to improve their display. Uncheck the box to turn MathJax off. This feature requires Javascript. Click on a formula to zoom.
ABSTRACT
The depopulation of rural areas in both developed and developing countries has become a complex problem with important implications for issues of equality and sustainability. We present a spatial exploratory analysis of the multidimensional factors related to the depopulation of Spain's rural areas. Using highly granular population data to estimate experienced population density allows us to highlight significant differences compared to the conventional administrative boundary in terms of the usual definition of densities. Based on this, we develop a new typology of declining rural areas that takes into account access to urban areas. While most rural areas have been suffering depopulation over the last decades, our results also show that rural areas themselves are not a homogeneous group and that rural areas show strong heterogeneity along different dimensions associated with growth and decline.
1. Introduction
The depopulation of rural areas in both developed and developing countries has become a complex problem, which can be understood as the chronic loss of population that prevents rural communities from returning to the maximum population levels prior to the loss of inhabitants (Slack and Jensen Citation2020; Johnson and Lichter Citation2019). Depopulation shares common elements such as outmigration and natural decrease due to population aging and mortality associated with low birth rates (Slack and Jensen Citation2020; Alamá-Sabater et al. Citation2019). It is also related to a wide range of factors which makes depopulation a complex and multifactor phenomenon.
The consequences of depopulation are also complex. Depopulation contributes to the widening of territorial polarization. It poses critical challenges for economic and social inclusion, and from a political perspective, it contributes to social and electoral discontent (Rodríguez-Pose Citation2018; Gutiérrez et al. Citation2020). Rural areas are increasingly failing to keep pace with urban areas and turning into ‘left behind’ places (Johnson and Lichter Citation2019; Martin Citation2021). Rural depopulation furthermore closely relates to environmental sustainability and threatens the maintenance of natural as well as cultural heritage (Ruiz Pulpon and Canizares Ruiz Citation2020).
Spain is an interesting country to study rural growth and decline. Spain represents a country with a strong spatial concentration of population and large areas that are sparsely populated. At the same time, Spain is suffering intense rural depopulation, especially since the second half of the twentieth century (Pinilla and Sáez Citation2017). Rural Spain hosted about 60% of the population in 1900, but less than a quarter of today's population lives in rural areas, with more than 80% of rural municipalities having experienced population loss.
The literature on rural growth and decline in Spain has addressed different aspects and factors related to population loss (see, for example, Collantes and Pinilla Citation2011; Collantes et al. Citation2014; Goerlich, Reig, and Cantarino Citation2016; Pinilla and Sáez Citation2017; Pinilla and Sáez Citation2021; Gutiérrez et al. Citation2020; Molinero and Alario Citation2022). Some related recent studies include also the work in specific underpopulated areas in Spain: Cañal-Fernández and Álvarez (Citation2022) in a case study for the Asturias region and Merino and Prats (Citation2020) and Alamá-Sabater et al. (Citation2021) for the region of Valencia, or in other countries like the Swedish case in Grundel and Magnusson (Citation2022).Footnote1 Despite the interest that the topic has attracted, comprehensive and nationwide empirical quantitative studies on the drivers of rural growth and decline at a spatially detailed level are still rare.
Furthermore, there are still several critical questions concerning the delimitation of the rural space from the urban one and the measurement of population densities and population loss. Moreover, there are issues of rural heterogeneity and diversity that have not yet been sufficiently explored in empirical quantitative studies with a spatial scope of covering all rural municipalities, since not all rural areas are losing population to the same extent. Drivers of depopulation can vary among different types of rural areas and some rural areas are even dynamic and growing (Rizzo Citation2016).
In this study, we use quantitative data and present an exploratory spatial analysis of rural growth and decline in Spain. The paper contributes to the existing literature in the following ways. First, we base our definition of rural spaces on the recent OECD-Eurostat classification of functional urban areas (Dijkstra et al. Citation2019), which offers a harmonized definition of urban areas for 29 OECD countries. This framework facilitates more harmonized cross-country comparisons in the broader OECD context. Important in this respect is that this classification also identifies urban hinterlands and commuting areas and thus distinguishes those areas from the ‘truly’ rural areas (Brezzi, Dijkstra, and Ruiz Citation2011; Dijkstra et al. Citation2019; Duranton Citation2021). Second, we use highly granular data to calculate experienced density in line with Duranton and Puga (Citation2020); a density measure that is not restricted to administrative boundaries. This is a critical methodological issue in the present study. Experienced density is understood as the sum of population within a given radius around each observation (De la Roca and Puga Citation2017; Duranton and Puga Citation2020). Third, and based on the measurement of the experienced density, we propose a new typology of rural areas where we distinguish municipalities furthermore according to their population evolution and accessibility to urban areas. On the one hand, this allows for better identification of municipalities at risk of depopulation. On the other hand, we also identify stable and dynamic rural areas. Fourth, building on this new typology we explore a range of variables potentially related to rural population growth and decline in a spatially detailed study of national scope.
Our results show that rural areas present strong heterogeneity along different dimensions associated with growth and decline. Using highly granular population data reveals essential differences compared to administrative boundary data in terms of densities that people are experiencing in rural areas. While most rural areas have been suffering depopulation over the last decades, a small group of rural areas has been able to show a stable and dynamic performance. Access to urban areas is a crucial factor. Apart from demographic factors and natural geography, rural growth and decline are also related to economic characteristics, infrastructure endowment and historical factors.
The depopulation of rural spaces is not only a direct result of persistent population loss but also reflects a complex phenomenon articulated with the problem of sustainability of the rural environment. Rural depopulation connects with the underuse of the multifunctional mosaic of the rural landscape that provides critical services for the well-being and sustainability of the urban and peri-urban areas. Therefore, understanding the specific forces and drivers related to rural growth and decline is key to a more informed process of placed-based public policies aimed to promote the development of the rural environment and the slowdown of depopulation.
The present work approaches rural growth and decline in Spain from the exploration of experienced density combined with access to urban areas, which in turn opens new analytical and methodological possibilities to a complex phenomenon that must be approached from different interdisciplinary perspectives for a better understanding and eventually improved public policies.
2. Defining rural areas
For Spain, the National Statistical Institute (INE) considers municipalities with at least 10,000 inhabitants as urban and municipalities with less than 10,000 inhabitants as rural. This definition of urban and rural municipalities is exclusively based on population thresholds. Nevertheless, population densities are another key characteristic that distinguishes urban and rural areas. The Spanish national government law for the sustainable development of rural areas (LDSMR) combines a population threshold criterion with a density criterion. It defines rural municipalities with a population density of fewer than 100 inhabitants per square kilometre and a total population below 30,000.Footnote2
Population size and density are usually based on data for local administrative units based on the political boundaries of areas. However, from a socioeconomic point of view, a delimitation of the rural from the urban needs to consider functional relationships. Hence, two further criteria have been frequently used to distinguish rural space from urban areas: continuity in built-up areas and commuting flows. For example, municipalities adjacent to cities, even with a small population and a low density, can still belong to the urban agglomeration if there is continuity in built-up areas and/or strong socioeconomic ties, usually defined based on commuting patterns.
The OECD developed a delimitation of functional urban areas (FUA) in collaboration with the European Commission (Dijkstra et al. Citation2019).Footnote3 This classification provides a harmonized definition of FUAs for 29 OECD countries and is based on population grid data from the Corine Land Cover database and the global LandScan dataset. Based on this information, FUA core areas are identified as contiguous or highly interconnected densely inhabited urban cores. FUA cores can have one or more urban centres of different sizes, defined as a cluster of contiguous grid cells of one square kilometre with a density of at least 1500 inhabitants per square kilometre and a population of at least 50,000 inhabitants. FUA hinterlands (commuting zone) are identified based on commuting data, including all settlements from where at least 15% of the workers commute to any of the core settlements. The combination of the city with its commuting zone forms the so-called Functional Urban Area (FUA). Based on the 2020 revision of the FUA definition, for Spain, the OECD classification defines 81 functional urban areas composed of 132 municipalities, with their hinterlands made up of 1128 municipalities, the rest of the municipalities being rural. This approach has the advantage of not mixing small municipalities that form part of urban and metropolitan areas with genuinely rural areas.
Appendix Figure A1 shows a map of the OECD functional urban areas in Spain. It clearly shows the sizeable rural space in Spain, with 85% of municipalities being rural.
The analysis here is restricted to mainland Spain. We exclude the islands and Ceuta and Melilla due to their specific geographical circumstances and peculiarities that make the process and the causes of population change distinct. Some larger municipalities that do not form part of the OECD functional urban areas still fulfil urban functions. To address this issue, we first focus on rural municipalities with a population of fewer than 30,000 inhabitants; the threshold of the Spanish government delineation criteria between urban and rural and a threshold that has also been applied in several Spanish studies, for example, in Viñas (Citation2019) or Molinero and Alario (Citation2022).Footnote4 In addition, we treat municipalities between 10,000 (the INE threshold to define rural municipalities) and 30,000 inhabitants separately as small towns in rural environments.Footnote5
3. Characterising rural areas
Rural areas are not homogeneous and show strong heterogeneity along different dimensions (Rizzo Citation2016; Gutiérrez-Posada et al. Citation2017). In characterizing different patterns of rural depopulation, and considering the point of view of the objectives of this paper and its methodological scope, and based on the analysis of the experienced density approach (Duranton and Puga Citation2020; De la Roca and Puga Citation2017), two critical aspects are the differences in densities and access to urban areas.
3.1. Rural densities
A key to the urban-rural distinction is population density. However, rural areas are very heterogeneous in densities, and the population density spectrum can be used to characterize rural areas. For example, the European Union defines sparsely populated areas as NUTS 3 regions with fewer than 12.5 inhabitants per square kilometre.
Population density is usually measured as the number of inhabitants per square kilometre within the unit of analysis, where the units are usually based on the political boundaries of administrative units. The smallest administrative level in Spain is the level of municipalities which constitute, in general, a relatively small and detailed geographical scale. However, municipalities vary considerably in their spatial extension, influencing therefore the resulting population densities. Some municipalities include a small area around the population entities and hence show a relatively high population density. In contrast, other municipalities are geographically much more extensive and include, for example, national parks or mountain ranges that reach far beyond their population entities and surroundings, resulting in a low population density. Duranton and Puga (Citation2020) argue that such a ‘naïve density’ does not reflect well the actual density experienced by the local inhabitants. They propose an ‘experienced’ density measure based on the grid-cell population.Footnote6 Experienced density, in addition to dealing with the uneven narrowness of conventional administrative unit boundaries related to population density, better captures how close the typical individual is to other people when the population is unevenly distributed (De la Roca and Puga Citation2017; Duranton and Puga Citation2020). The effect of the unequal distribution of the population in the Spanish rural municipalities is a phenomenon that cannot be appropriately captured by the conventional measurement of demographic density (population divided by the land area of the administrative unit). We follow this approach and use geo-coded high-resolution population data for 2020 from, LandScan (Oak Ridge National Laboratory). LandScan provides population data for approximately 1 km grid cells (30 × 30 arc second cells). For each municipality centroid, we create a 10 km buffer and count the population of all grid cells within this buffer area (=314.2 km2). Based on this granular data, we create a new density measure similar to the experienced density approach in Duanton and Puga (Citation2020). We base our typology on this experienced density defined in the above terms. This better captures relevant territorial differences and helps to view the phenomenon of depopulation from a concept closer to territorial realities.
shows a) the ‘naïve’ density and b) the experienced density of mainland municipalities for 2020. Functional Urban Areas are shaded in grey, municipalities with a population of 30,000 or more are shaded in blue, and small towns in rural environments are shaded in purple. Values above the median density are in green colour.
Figure 1. Population density based on ‘naïve’ density and ‘experienced’ 10 km radius density: 2020. Source: Own elaboration based on population data from Fundación BBVA and Ivie and INE.
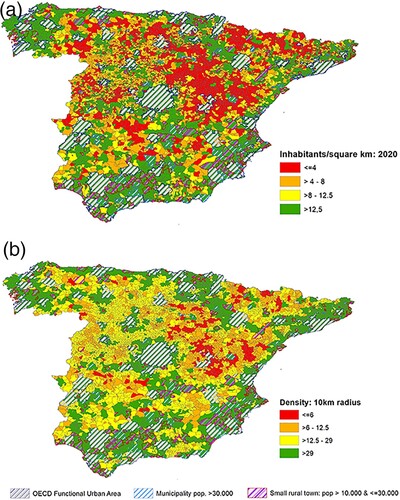
The maps reflect the intense concentration of population in Spain. Grid cell density within a radius of 10 km shows a minor variance and a higher median value than the density based on the administrative boundaries of municipalities and their population and land area. Considering the sparsely populated density threshold of 12.5 inhabitants per square kilometre it is noticed that 60% of rural municipalities fall below this threshold when the ‘naïve’ density is used, but only 43% when based on the experienced density measure. Apart from the Pyrenes, the lowest experienced density areas are in the provinces of Cuenca, Guadalajara, Teruel and Soria and in a corridor stretching from Ciudad Real to Caceres. The areas above the respective median densities are very similar in both cases and run along the coastal regions, the Valle del Ebro corridor, Madrid and its surroundings and some highway corridors such as the A4 highway corridor from Madrid to Andalucía or the A5 corridor from Madrid to Extremadura.
3. 2. Rural accessibility
Rural municipalities are also very diverse regarding their access to urban areas. Access to urban areas is vital for accessing services and jobs. Partridge et al. (Citation2007, Citation2008) have argued that distance to cities in the urban hierarchy is crucial in explaining growth differences in non-metropolitan areas. The concept of ‘borrowed size’ relates to locations in the proximity of urban agglomeration that may host a range of urban functions beyond what their size would typically support (Burger et al. Citation2015). On the other hand, urban agglomeration can also cast a development shadow (Cuberes, Desmet, and Rappaport Citation2021).
Based on the distance to urban areas, one can distinguish rural municipalities according to their remoteness. Table A1 in the Appendix shows the number of Spanish mainland rural municipalities at a 30 km and a 50 km threshold in terms of geodesic distance from the nearest urban core. However, travel time based on the road network provides a more realistic measure of accessibility. The road network used here, and the travel times are based on Holl (Citation2016, Citation2011, Citation2007) and refer to the base year of 2000.
Different thresholds for travel times have been used to characterize the accessibility of rural areas, but usually, 30-, 45- and 60-minute thresholds are used. In several studies, remote rural areas are considered those with travel times to the nearest urban area of more than 45 minutes; see, for example, Dijkstra and Poelman (Citation2008); Jonard et al. (Citation2009); Brezzi, Dijkstra, and Ruiz (Citation2011); Goerlich, Reig, and Cantarino (Citation2016), or Viñas (Citation2019). 45 min is considered the maximum daily commuting time. In some cases, 30 min have been used (Copus et al. Citation2008) to differentiate accessible from remote rural areas.
shows the number of Spanish mainland rural municipalities close and remote to urban core areas based on 30 and 45-min travel distance thresholds. More than half of all rural municipalities can be considered remote, with a travel time of more than 45 min to the nearest urban area. Less than 20% are within a travel distance of 30 min. In terms of population, remote rural municipalities account for 44% of the rural mainland population, but in terms of the total mainland population, this only corresponds to 6.4%. Appendix Figure A2 shows the map of travel times to urban core areas.
Table 1. Close and remote rural municipalities according to travel time thresholds.
4. Rural growth and decline
4.1. Historical context
illustrates the changes in rural and urban population and the population shares accounted for by today's rural municipalities, small rural towns and urban municipalities in mainland Spain since 1900. Spanish rural mainland municipalities accounted for approximately half of the population in 1900. Up to 1950, the total population increased in urban areas, small rural towns and in rural municipalities, but growth was much more pronounced in urban areas, which translated into a decreasing share of population in rural municipalities. On the other hand, small rural towns were able to maintain a fairly stable share of population of about 9–10% since 1900.
Figure 2. Historic population evolution of urban and rural municipalities. Notes: mainland municipalities; definition of urban based on the 2020 OECD functional urban area definition together with municipalities with a total population of at least 30.000 inhabitants. Small rural towns are rural municipalities with a population of 10,000–30,000 inhabitants.
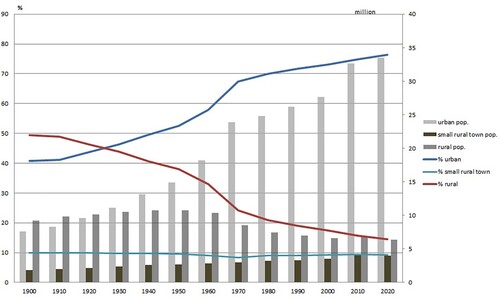
The total rural population in Spain peaked in the 1950s due to high rural birth rates during the first half of the century (Collantes and Pinilla Citation2011). However, rural municipalities have seen an absolute decline in population since the 1950s. Industrialization in Spain started relatively late, and the most substantial rural population decline happened during the second half of the twentieth century (Collantes and Pinilla Citation2011). Especially during the 50s, 60s and 70s, the economic growth of this period attracted rural workers to the main cities in large numbers. Only in the first decade of the 2000s did rural areas in Spain experience some growth because of a substantial influx of immigrant population. Most immigrants settled in the main metropolitan areas and areas of intensive agriculture with high labour demand in south-eastern Spain. However, some immigrants also settled in rural areas, thus compensating for the decline of the native population and slowing down rural depopulation during this period (Collantes et al. Citation2014).
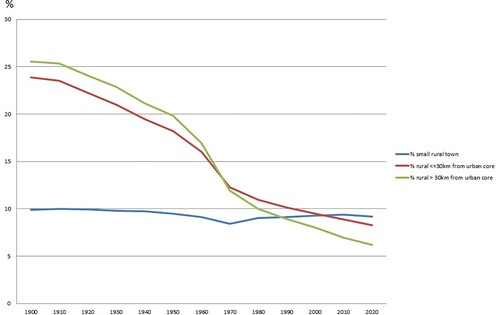
shows the evolution of the shares of the population of rural municipalities closer to urban areas compared to those more remote for the thresholds of 30 km from the nearest urban core area and compared to small rural towns. Up to the 1950s population evolved similarly in more accessible and remoter rural municipalities. Since 1950, however, population decline has been much more drastic in more remote rural municipalities. In those municipalities more than 30 km from an urban centre, the population declined by about 52% between 1950 and 2020. In contrast, more accessible rural municipalities also saw their population decline – yet to a lesser degree than remote rural areas. Their population declined by about 30% between 1950 and 2020. The population of small rural towns has been growing over time, except for the last decade. Close rural areas showed a slight population growth in the first decade of the 2000s with the arrival of a more significant immigrant influx while remote rural areas continued to lose population. Clearly, municipalities further away from urban areas have suffered stronger depopulation.
Figure 3. Historic population evolution of small rural towns, and close and remote rural municipalities. Notes: mainland municipalities; definition of rural based on the 2020 OECD functional urban area definition and with a total population of less than 10,000 inhabitants.
4. 2. A typology of growing and declining rural municipalities
Comparing the 1900 municipality population with the 2020 mainland municipality population shows that there are in total, 71% of mainland municipalities that have less population today than they had in 1900 and 76% have today less population than in 1950 at the peak of the rural population. It is a very important demographic change against an increase in the total population in mainland Spain that more than doubled over this period, from about 18.7 million in 1900 to 46.8 million in 2020. Approximately 95% of the municipalities that lost population since 1900 as well as since 1950 are rural municipalities and none of the municipalities that lost population over this long-time horizon, however, belong to urban core areas.
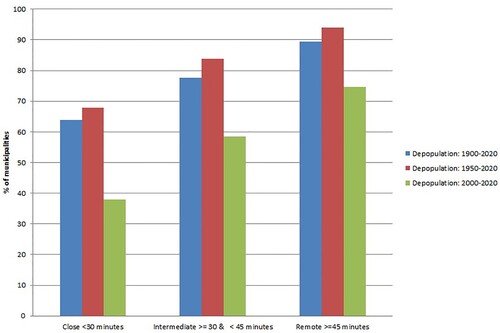
Considering as depopulation criteria a loss of at least 10% of population, plots the share of depopulating municipalities for rural areas that are close, intermediate and remote from urban centres, where distances are based on travel times. There are interesting differences. Among remote rural areas, the share of municipalities that suffered depopulation since 1900 is 89%, but since the peak of the rural population in 1950, 94% of remote rural areas suffered from depopulation and nearly three quarters even lost more than 10% of the population since the 2000s. Intermediate rural municipalities also suffered from depopulation but to a lesser degree and rural municipalities in proximity to urban areas even to a lesser degree. For the latter, around 68% have lost more than 10% of their population since the first half of the last century, and over a third of them suffered population losses of more than 10% during the 2000s.
Figure 4. Depopulation of rural municipalities according to travel time distance from urban core areas. Notes: mainland municipalities; definition of rural based on the 2020 OECD functional urban area definition and with a total population of less than 10,000 inhabitants.
Appendix Figure A3 shows the map of population change since 1900 (panel A) for rural municipalities. Today, many rural municipalities have less than 50% of the population than in 1900, and many of those areas never had high population densities (Pinilla and Sáez Citation2017; Molinero and Alario Citation2022). In fact, Spain's population was very unevenly distributed even before industrialization set in, with large areas with relatively few settlements and low population densities (Pinilla and Sáez Citation2017; Gutiérrez et al. Citation2020). This was mainly due to locational fundamentals and frontier warfare during the Reconquest (Ayuda, Collantes, and Pinilla Citation2010; Oto-Peralías Citation2020). As reflected by the so-called ‘Floridablanca Census’, published in 1787 – and argued in Collantes and Pinilla (Citation2022), many interior regions that today suffer the strongest from depopulation already had very low population densities in the eighteenth century.
Looking at the last twenty years (2000-2020) total mainland population in Spain increased by about 16% but also nearly two-thirds of municipalities lost population in this period. However, if we distinguish between urban core areas, urban hinterlands, small rural towns and rural areas, one sees that most of this decline happened again in rural areas. Only 15% of urban core areas, 12% of urban hinterland municipalities and 20% of rural small towns lost population over this period compared to 75% of rural municipalities. Appendix Figure A3 (Panel B) maps the population change since 2000. Many interior municipalities experienced population losses of over 30% during the last two decades. In the provinces of Zamora, Ourense and Leon, more than 90% of rural municipalities suffered population losses of 10% or more during the last two decades. On the other hand, rural municipalities that managed to grow (those coloured in dark green) have been predominantly close to urban areas, along the coast – except in Galicia and Asturias-, along some of the main transport corridors, and in the southern part of Spain (Molinero and Alario Citation2022).
As mentioned before, rural decline is related to low population densities. The European Commission defines sparsely populated NUTS 3 regions as those with population densities below 12.5 inhabitants per square kilometre. In Spain, three provinces (Cuenca, Soria and Teruel) fall below this threshold, but about half of all municipalities, today have population densities of less than 12.5 inhabitants per square kilometre. Since 1900, the number of municipalities with a population density below 12.5 increased from 1104 or 14% to 3955 municipalities or 50%. As reflected in , sparsely populated areas are mainly in the interior areas of Spain (especially the northern half) and parts of the Pyrenees. Indeed, about 22% of municipalities have even less than four people per square kilometre, affecting large parts of Cuenca, Soria and Teruel provinces. Pinilla and Sáez (Citation2017) called those areas ‘demographic deserts’.
Combining the criteria of population loss and a population density below the sparsely populated area threshold, presents a typology of rural municipalities where densities are based on our experienced density measure. Appendix Table A2 shows the corresponding typology based on ‘naïve’ densities.
Table 2. Typology of rural municipalities based on experienced density.
We distinguish:
declining rural municipalities in danger of depopulation: municipalities with a population decline that already had a population density below the sparsely populated threshold or fell below this threshold from 2000 to 2020.
intermediate rural municipalities: municipalities with stagnant population or population growth but with a population density that remained below the sparsely populated threshold or with a population decline that did not lead to dropping beyond the sparsely populated population density threshold.
stable or dynamic rural municipalities: municipalities with stagnant population or population growth but with a population density in 2000 above the sparsely populated threshold or with a population growth that led to an increase in population density from 2000 to 2020 to surpass the sparsely populated threshold.
shows that about 40% of rural municipalities can be considered in substantial danger of depopulation. 37% of rural municipalities fall in the intermediate group and only 22% of rural municipalities show a stable or dynamic performance. As our experienced densities take into account proximity to denser municipalities, a typology that uses ‘naïve’ densities (Appendix Table A2) leads to a somewhat higher percentage of rural municipalities in danger of depopulation (54%).Footnote7
incorporates into this typology the travel time distances to urban areas distinguishing close, intermediate and remote rural municipalities based on the 30- and 45-min thresholds. Most rural municipalities in substantial danger of depopulation are remote and beyond what could be considered the maximum of daily commuting. Few rural municipalities suffering substantial depopulation are within a travel distance of fewer than 30 min to the nearest urban area. In contrast, rural municipalities showing a stable or positive population evolution are mainly close to urban areas. Only a small number of rural municipalities (less than 7%) are remote from urban areas and has nevertheless managed a stable or positive evolution of their population over the last two decades. maps the rural municipalities according to this classification.Footnote8 The areas most exposed to rural depopulation are not only distant from urban areas but also far from the main highways. The more dynamic rural areas benefit from the influence of the two main metropolitan areas of Madrid and Barcelona. Also, along the coast or other tourism regions such as the Pyrenes or along the major highway corridors, some municipalities have a stable or dynamic evolution.
Figure 5. Typology of rural growth and decline. Source: Own elaboration.
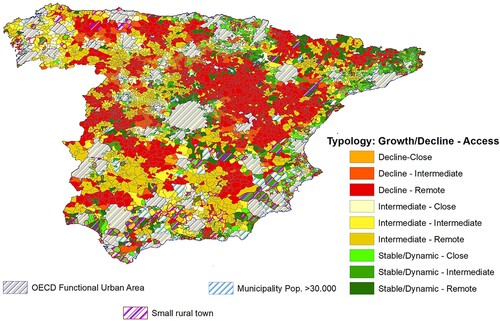
Table 3. Typology of rural municipalities based on growth and decline – experienced density and accessibility to urban areas (OECD FUA definition).
4.3. Factors related to rural population growth and decline
Rural growth and decline are associated with a range of diverse factors, which makes depopulation a multifactor and complex phenomenon. The literature has related rural population change to a broad set of factors, including differences in socio-demographic characteristics, natural geography, and economic factors, and differences in infrastructure endowment and historical factors. Our aim is to deepen the understanding of factors related to depopulation, but also to highlight potential drivers of rural adaptability and resilience (De Renzis, Faggian, and Urso Citation2022).
4.3.1. Variables
Demographic factors: The socio-demographic drivers of rural depopulation in Spain have been studied widely; see, for example, Collantes and Pinilla (Citation2011); Collantes et al. (Citation2014); Goerlich, Reig, and Cantarino (Citation2016); Pinilla and Sáez (Citation2017); Gutiérrez et al. (Citation2020), Pinilla and Sáez (Citation2021); or recently Molinero and Alario (Citation2022). Depopulation can be driven by negative natural growth (more death than birth) or more emigration than immigration (Pinilla and Sáez Citation2017; Pinilla and Sáez Citation2021). These studies highlight that most rural areas have a negative balance of natural population growth and suffer from outmigration. As a result, one of the critical challenges of rural depopulation is associated with population ageing. Population ageing leads to a reduced working-age population. It also implies a decrease in the population in fertile years, leading to even lower birth rates, further reducing the natural population growth potential. Hence, much of the potential for the revitalization of rural areas depends on attracting migrant flows with a younger age structure.
Natural Geography: The literature has shown that natural geography characteristics relate in complex ways to local development (Ellison and Glaeser Citation1999; Nunn and Puga Citation2012; Holl Citation2019; Gutiérrez et al. Citation2020). One of the critical factors is landscape relief (Goerlich and Mas Citation2009; Goerlich and Mollá Citation2021; Molinero and Alario Citation2022), with altitude and terrain ruggedness limiting the possibilities for food production and, consequently, human settlements. On the other hand, terrain ruggedness could also present a natural amenity making rural areas more attractive for tourism-related activities. Another relevant geographical factor relates to the distance from the coast. Aquifers are also crucial in developing human settlements and agriculture, especially in dry and arid areas (Burchfield et al. Citation2006; Holl Citation2019). Furthermore, climate strongly influences agriculture – and for rural areas, this is still relevant today (Molinero and Alario Citation2022). At the same time, climate has also become a vital amenity factor for tourism potential.
Economy and Competitiveness: Adverse natural geography cannot alone account for Spain's high spatial concentration of population (Gutiérrez et al. Citation2020). Economic factors are crucial in rural areas’ growth and decline processes. Differences in the local industry structure can condition population growth through employment opportunities. Employment opportunities may be limited in rural areas specialized in agriculture that has seen falling employment in many areas (Collantes and Pinilla Citation2011; Molinero and Alario Citation2022) – except in areas specialized in high productivity and intensive-export orientated agriculture (Merino and Prats Citation2020; Cañal-Fernández and Álvarez Citation2022). Areas specialized in fast-growing industries may retain and attract more population. We include the share of employment in high and medium-high-tech manufacturing and the share of employment in high-tech knowledge-intensive services. The sectors’ technology and knowledge intensity definitions are based on the Eurostat High-tech and Knowledge-intensive services (KIS) classification and Social Security employment data. In most rural areas, small and micro firms dominate, and those areas tend to suffer from a lack of large employers. Competitiveness will also relate to locations’ knowledge base; in this context, differences in the educational attainment of the local population can also play an important role (González-Leonardo et al. Citation2019; González-Leonardo et al. Citation2022).
Infrastructure: Many stable and more dynamic rural municipalities are close to the main highway corridors. Proximity to a major highway provides better accessibility to the country's main economic centres (Holl Citation2007). The literature has documented significant local growth effects of highways (for a review of this literature, see, for example, Redding and Turner (Citation2015), but the issue of infrastructure has still received little attention concerning rural depopulation (Grundel and Magnusson Citation2022). Another factor that has been emphasized to be crucial for competitiveness and growth in the literature is internet access. However, despite essential investments in rural internet infrastructure, there is still a critical urban-rural digital divide and significant variations in coverage among rural areas in Spain (Arronte Ledo and Holl Citation2022). We use highway distance and the number of households with internet connection as proxies for infrastructure availability.
History: Finally, we also include historical controls. The previous Sections have shown that rural depopulation has been a long-term phenomenon in many areas as history can cast a long shadow (Goerlich and Mas Citation2009; Collantes and Pinilla Citation2022). We include control for the 1900 population density; alternatively, we test for 1900 market potential. This latter variable considers not only the own municipality population but also access to neighbouring areas. It is calculated as the municipality's population plus the distance discounted population of other areas weighted by the inverse of geodesic distances between the locations (Holl Citation2012).
Appendix Table A3 shows the definition and data sources for the explanatory variables included in the analysis.Footnote9
4.3.2. Empirical analysis of factors associated with rural growth and decline
Appendix Table A4 shows differences in mean values of our set of variables. There are essential differences in nearly all traits related to the degree of rurality on the one hand and to growth and decline on the other hand.
In order to test how the diverse characteristics of rural municipalities relate to our typology we proceed with probit estimations that show controlled associations between municipality characteristics and population growth and decline.
(1)
(1) where
is the outcome variable of municipality i based on our proposed typology in and
is a vector of our explanatory variables. The error term
captures the influence of unobserved factors and is assumed to be i.i.d. normal.
Specifically, in , we present the results for the probability that a rural municipality suffers depopulation. The dependent variable takes on 1 if the municipality falls in the group of declining rural areas as of . The coefficients shown are marginal effects. In column 1 we pool all rural municipalities that fall in the group of declining rural areas. In columns 2–4, we distinguish according to the degree of rurality between remote, intermediate and close rural declining municipalities. The respective dependent variables relate to the municipality belong to the categories of our typology of row 1 – columns 1, 2 and 3 respectively of .
Table 4. Probit estimations: declining rural areas.
In , we contrast these results with corresponding estimates for the probability that a municipality is in our typology's stable and dynamic category (here the respective dependent variables relate to row 3 of ). These results show traits related to places that managed to withstand decline and have hence been more resilient. All estimations include regional fixed effects at the province level to control for unobserved regional heterogeneity.
Table 5. Probit estimations: rural stable and dynamic areas.
Regarding demographic factors, depopulating rural municipalities tend to have an older population and a smaller share of foreign-born residents. In contrast, a municipality's higher ratio of young to older adults is positively related to rural growth, as is a higher share of foreign-born residents. The positive contribution of immigration to the stability of remote rural municipalities opens interesting opportunities from the point of view of public policies that encourage new dynamics of the rural population (Collantes et al. Citation2014). However, immigration in rural areas is also variant and dynamic and to be succeeded requires well-defined rural development policies rooted in rural municipalities, especially in the declining process of remote rural depopulation areas (Bayona-i-Carrasco and Gil-Alonso Citation2013).
Concerning natural geography, rural declining municipalities tend to be in higher altitudes, in areas with more rugged terrain, tend to be further away from acquirers, and tend to show a greater temperature range – especially the more remote ones. Terrain ruggedness can increase the cost of development and together with the lack of groundwater limit the agricultural potential of rural areas (Holl Citation2019). On average, declining rural areas are also at a greater distance from the coast. However, distance to the coast shows no statistically significant relation to the probability that a municipality depopulates once we include province-fixed effects in our estimations. On the other hand, stable and dynamic rural areas tend to be in lower altitudes – especially the remote and intermediated ones, in less rugged terrain, closer to aquifers and in areas with a lower temperature range (). These results illustrate how natural geography relates to the degree of rurality and to rural development prospects (Holl Citation2019; Johnson and Lichter Citation2019; Alamá-Sabater et al. Citation2021).
In connection to the rural landscape functionality, the mentioned geographical traits may be referred to as a more complex issue related to the underuse of rural landscape and to the generation of a more complex socio-ecological phenomenon such as the tragedy of the commons by underuse of the rural landscape (Miyanaga and Shimada Citation2018; van der Vaart Citation2005). The above implications are the tip of the iceberg of a complex problem related to the provision of ecosystem services of the Spanish rural landscape. This needs to be studied more in-depth in its local particularities and in relation to issues such as the impact of climate change and the environmental risk posed by a landscape mosaic with thousands of years of an anthropic alternation (Laterra, Orúe, and Booman Citation2012).
Regarding economy and competitiveness factors, there are also significant differences between depopulating and more stable and growing rural municipalities. Depopulating rural municipalities have, on average, greater dependence on agriculture than stable and dynamic rural municipalities. In line with Molinero and Alario (Citation2022), we find that greater reliance on agriculture appears indeed as a growth-limiting factor, especially in remote rural areas, as is the lack of high-tech, medium-tech and knowledge-intensive service employment. Smaller average firm size is related to a greater probability of suffering depopulation; however, only for rural municipalities close to urban areas is the coefficient in our controlled association statistically significant. On average stable and dynamic rural municipalities have a greater share of employment in high-tech and medium-high-tech sectors and knowledge-intensive service sectors, and on average, they have a larger average firm size (Partridge et al. Citation2008, Tuitjer and Küpper Citation2020). However, in our controlled associations that include province-level fixed effects, these factors are not statistically related to a greater probability of falling in our stable and dynamic rural area category. On the other hand, a lower share of the population with a university degree is significantly related to lower growth, except for rural municipalities close to urban areas. Remote and intermediate rural municipalities with fewer university graduates in their population have a higher probability of belonging to the declining group, whereas remote rural areas with a higher share show a greater probability of being stable or dynamic. These findings are consistent with other recent studies regarding the critical role of human capital in the development potential of rural areas (Ballatore and Mariani Citation2019; Tuitjer and Küpper Citation2020; De Renzis, Faggian, and Urso Citation2022).
In terms of economy and competitiveness, our results highlight that public policies for rural development must go hand in hand with more significant investment in training opportunities for the rural population to create human and social capital. Yet, at the same time, job opportunities that meet those qualifications are also crucial to avoid the out-migration of the most skilled (Llorent-Bedmar, Palma, and Navarro-Granados Citation2021). This is essential for a sustainable socio-technical transition that allows the rural environment to be incorporated into the dynamics of the fourth industrial revolution, through the adoption, for example, of distributed and delocalized manufacturing models, such as additive manufacturing systems (Wu and Yabar Citation2021). Based on a case study of Andalusia, Cañete, Navarro, and Cejudo (Citation2018) have shown that these factors are also crucial for the participation of rural areas in competitive project calls such as the LEADER approach.
Regarding infrastructure, declining rural areas are on average further away from highways. But once other municipality characteristics are controlled for, this appears only as a significant growth limiting factor for remote rural areas. In contrast, proximity to urban areas is significantly related to the probability that rural areas show a stable and more dynamic growth path (this is in line with, for example, Martínez-Filgueira, Peón, and López-Iglesias Citation2017; Alamá-Sabater et al. Citation2021). Rural declining municipalities also have fewer households with internet access. The promotion of local administrative coordination mechanisms in the economic and infrastructure domain could produce positive synergy between declining and stable municipalities, which is relevant in connection to the gradient of potential services and manufacturing activities with the closest urban areas (Duranton and Puga Citation2020; Partridge et al. Citation2007). It may furthermore support the technological transition in rural areas to medium and high-tech manufacturing activities and KIS (Irwin et al. Citation2009; Wu and Yabar Citation2021).
History matters as well. Many depopulating rural areas never had high population densities (Collantes and Pinilla Citation2022) and Appendix Table A4 confirms that declining rural municipalities already had significantly lower densities in 1900. In and we have included the 1900 market potential variable, and lower historical market potential shows a statistically significant relationship with the probability that a rural municipality has been experiencing population decline.Footnote10 This confirms the long-lasting shadow of peripherality (Martínez-Filgueira, Peón, and López-Iglesias Citation2017; De Renzis, Faggian, and Urso Citation2022).
The results of and have to be viewed as exploratory and should not be interpreted as providing causal evidence. A limitation of our estimations is that especially our demographic and economic variables are not exogenous, but are likely influenced by population growth and decline itself. For robustness of the remaining factors, we present a stepwise estimation procedure for the pooled sample where we exclude the demographic and economic variables and start with independent variables that can be considered exogenous such as the natural geography variables and then add history variables and last infrastructure variables that may fail this assumption.Footnote11 Results are shown in Appendix Tables A5 and A6 and are qualitatively very similar for the included variables.
5. Concluding remarks
The phenomenon of the depopulation of rural areas has acquired global dimensions in terms of complexity with important repercussions in terms of social, economic, and environmental sustainability not only of the rural environment as a multifunctional landscape but also through its interdependence through the services it provides for urban areas.
Using granular population data, we have estimated experienced density in rural municipalities and proposed a new quantitative-based typology of rural entities with the aim to classify the phenomenon of depopulation among all rural municipalities in a way that better captures the diverse territorial realities. This typology has been related to a wide set of factors related to rural depopulation and that refer to (1) demographic factors; (2) natural geography; (3) economic factors that reflect the competitiveness of the territory, (4) infrastructure that also functions as an important proxy for the provision of public services; and (5) historical factors.
A relevant finding is that for the set of factors, there are essential differences in the proposed typology of municipalities in almost all the traits that operate as drivers of rural depopulation. From the perspective of public policies, it implies that in rural depopulation issues, one size does not fit all. The effectiveness of policies requires the awareness of local differences and needs to take into account the challenges related to the different rural contexts. Our typology and the subsequent analysis of factors associated with rural growth and decline highlight the need for such a differentiated place-based focus.
An adaptative policy mix approach should also involve an innovation policy design that supports rural innovation building on the specific needs and barriers in the different types of rural areas. It needs to include the local capabilities, as well as the connection to the related and near municipalities to support creative industries based on the territory and their connection with regional value chains. A related approach to policies that promote rural innovation processes is the case of Smart village initiatives which for the Spanish context, have been assessed in Paniagua (Citation2020). In this context, Paniagua (Citation2020) points out the importance of rural territories’ connection and integration processes, considering the asymmetries between what he calls central and peripheral rural areas. Social innovation has also gained relevance in the context of rural development (Neumeier Citation2017).
Access to technology, training opportunities, and services can help to form a robust workforce that supports sustainable manufacturing and builds bridges of innovation in urban-rural interdependence as part of their sustainability gradient.
The phenomenon of depopulation includes relevant questions beyond the scope of the present study, such as socioeconomic inequalities related to the rise of urbanization, industrialization and concentration of wealth in urban and peri-urban areas (Johnson and Lichter Citation2019, Reynaud and Miccoli Citation2018). To a large extent, the most recent literature suggests that in addition to the central question of the socioeconomic and demographic drivers of rural depopulation (Slack and Jensen Citation2020, Johnson and Lichter Citation2019), the problem of environmental sustainability of the rural environment, which is linked to the challenges derived from rural-urban interdependence in economic and environmental terms, constitutes a major threat (Lasanta et al. Citation2017).
This paper is a complementary contribution to the literature on rural depopulation in Spain, which, like all academic work, brings to light new questions and research possibilities. Issues such as rural-urban interdependence at the level of ecosystem services, a more in-depth analysis of the multi-functionality of the Spanish rural landscape, considering its regional particularities and the economic, environmental, and climatic implications of its underuse, constitute pending challenges. Behavioural approaches or studies of local narratives can add valuable insights in this regard.
Finally, it is important to emphasize that our results indicate associations between the different variables related to the probability of rural growth and decline, but they should not be interpreted neither as deterministic nor as showing causal relations. This has analytical implications related to the validity and usefulness of the explanatory variables from the point of view of public policies. In this sense, it is also critical to consider that explanatory variables should be relevant from the political point of view but there is still a critical gap in their political use. The latter requires a thorough understanding of the interactions between domains and subdomains of factors relevant to policy. Further research is needed that addresses those issues, including the problem of endogeneity to provide causal inferences about the drivers of growth and decline in rural areas.
Supplemental Material
Download MS Word (19.7 KB)Supplemental Material
Download MS Word (14.3 KB)Supplemental Material
Download MS Word (36.3 KB)Supplemental Material
Download MS Word (13.7 KB)Supplemental Material
Download MS Word (13.4 KB)Supplemental Material
Download MS Word (12.8 KB)Supplemental Material
Download MS Word (1.7 MB)Disclosure statement
No potential conflict of interest was reported by the author(s).
Additional information
Funding
Notes
1 There is also a large literature in the field of rural geography that has studied the qualitative dimensions of the phenomenon of depopulation, see, for example, Hoggart and Paniagua (Citation2001).
2 Law 45/2007, of December 13th, for the sustainable development of the rural areas (2007). Official State Bulletin (BOE in its acronym in Spanish), number 299, 14th December of 2007, pages 51339–51349.
3 Other rural-urban classifications for Spain have been developed in Ruiz, Boix and Galleto (Citation2005) and Goerlich, Reig, and Cantarino (Citation2016), or Arribas-Bel, Garcia-López, and Viladecans-Marsal (Citation2021) for example. Duranton (Citation2021) provides an overview of issues and problems related to the delineating of the urban from the rural. Apart from quantitatively based studies, different theoretical approaches to the definition of rurality are discussed in Paniagua (Citation2021).
4 In mainland Spain, there are 59 municipalities with a population of more than 30.000 inhabitants in 2020 that are not part of the functional urban areas according to the OECD definition and there are 242 municipalities with a population in the range of 10.000–30.000. These municipalities are treated separately, as these are mainly smaller cities and towns in rural environments.
5 We are grateful to one of the anonymous referees for drawing our attention to this issue.
6 Grid cell data has also been used, for example, in Bibby and Shepherd (Citation2004) for the U.K. and the case of Spain in Goerlich, Reig, and Cantarino (Citation2016), Gutiérrez et al. (Citation2020), or Goerlich and Mollá (Citation2021) to calculate local densities.
7 The share of municipalities identified in the recent Bank of Spain annual report as in serious danger of depopulation is 42% (BDE, Citation2021).
8 For alternative classifications, see, Molinero and Alario (Citation2022), who distinguish ‘profound’ rural areas, ‘stagnant’ rural areas and ‘progressive’ and ‘dynamic’ rural areas in their typology or Goerlich, Reig, and Cantarino (Citation2016), who provide a classification of Spanish municipalities based on land use and accessibility and distinguish remote and accessible rural areas.
9 There are of course other potential factors related to rural growth and decline and we have tested a wider range, including for example different climate variables, soil and rock formation characteristics, different age structure variables and different variables capturing the local industrial structure. However, in order to avoid problems associated to multicollinearity we keep the analysis to the set of variables outlined in Appendix Table A3.
10 To avoid problems of multi-collinearity, we have not included both historical variables at the same time. Nevertheless, estimates with 1900 population density point in the same direction and are available upon request.
11 We also recognize that there are other potential factors related to rural growth and decline. For example, regarding infrastructure, education and health centres are also relevant in the context of rural depopulation. Yet, we have refrained from including them as they are even more likely endogenous to rural growth and decline.
References
- Alamá-Sabater, L., V. Budí, J. M. Garcia-Álvarez-Coque, and N. Roig-Tierno. 2019. “Using Mixed Research Approaches to Understand Rural Depopulation.” Economía Agraria y Recursos Naturales-Agricultural and Resource Economics 19(1): 99–120.
- Alamá-Sabater, L., V. Budí, N. Roig-Tierno, and J. García-Álvarez-Coque. 2021. “Drivers of Depopulation and Spatial Interdependence in a Regional Context.” Cities 114: 103217. doi:10.1016/j.cities.2021.103217
- Arribas-Bel, D., M. Garcia-López, and E. Viladecans-Marsal. 2021. “Building (s and) Cities: Delineating Urban Areas with a Machine Learning Algorithm.” Journal of Urban Economics 125: 103217. doi:10.1016/j.jue.2019.103217
- Arronte Ledo, A., and A. & Holl. 2022. The Impact of Ultrahigh-Speed Fixed Broadband Availability on Rural Population Growth and Decline, mimeo, CSIC-IPP, Madrid.
- Ayuda, M., F. Collantes, and V. Pinilla. 2010. “From Locational Fundamentals to Increasing Returns: The Spatial Concentration of Population in Spain, 1787–2000.” Journal of Geographical Systems 12: 25–50. doi:10.1007/s10109-009-0092-x
- Ballatore, R., and V. Mariani. 2019. “Human Capital Differentials Across Urban and Rural Areas in Italy.” The Role of Migrations. Italian Economic Journal 5: 307–324. doi:10.1007/s40797-019-00098-9
- Bayona-I-Carrasco, J., and F. Gil-Alonso. 2013. “Is Foreign Immigration the Solution to Rural Depopulation? The Case of Catalonia (1996–2009).” Sociologia Ruralis 53: 26–51. doi:10.1111/j.1467-9523.2012.00577.x
- BDE. 2021. La distribución espacial de la población en España y sus implicaciones económicas. Informe Anual 2020. Madrid, España: Banco de España.
- Bibby, P., and J. Shepherd. 2004. Developing a New Classification of Urban and Rural Areas for Policy Purposes–The Methodology. London: Defra.
- Boix, R., and V. Galletto. 2005. Identificación de sistemas locales de trabajo y distritos industriales en España. Dirección General de Política para la PYME, Secretaría General de Industria, Ministerio de Industria, Turismo y Comercio, Madrid.
- Brezzi, M., L. Dijkstra, and V. Ruiz. 2011. “OECD Extended Regional Typology: The Economic Performance of Remote Rural Regions.” OECD Regional Development Working Papers, No. 2011/06, OECD Publishing, Paris.
- Burchfield, M., H. Overman, D. Puga, and M. Turner. 2006. “Causes of Sprawl: A Portrait from Space.” The Quarterly Journal of Economics 121: 587–633. doi:10.1162/qjec.2006.121.2.587
- Burger, M., E. Meijers, M. Hoogerbrugge, and J. Tresserra. 2015. “Borrowed Size, Agglomeration Shadows and Cultural Amenities in North-West Europe.” European Planning Studies 23: 1090–1109. doi:10.1080/09654313.2014.905002
- Cañal-Fernández, V., and A. Álvarez. 2022. “Explaining the Decline of Rural Population in Spain (1900–2018).” Journal of Interdisciplinary History 53: 25–47. doi:10.1162/jinh_a_01797
- Cañete, J., F. Navarro, and E. Cejudo. 2018. “Territorially Unequal Rural Development: The Cases of the LEADER Initiative and the PRODER Programme in Andalusia (Spain).” European Planning Studies 26 (4): 726–744. doi:10.1080/09654313.2018.1424118
- Collantes, F., and V. Pinilla. 2011. Peaceful Surrender: The Depopulation of Rural Spain in the Twentieth Century. Newcastle upon Tyne, UK: Cambridge Scholars Publishing.
- Collantes, F., and V. Pinilla. 2022. La despoblación de la España rural:¿ Una anomalía dentro de Europa? Sociedad de Estudios de Historia Agraria - Documentos de Trabajo - DT-SEHA n. 2201.
- Collantes, F., V. Pinilla, L. Sáez, and J. Silvestre. 2014. “Reducing Depopulation in Rural Spain: The Impact of Immigration.” Population, Space and Place 20: 606–621. doi:10.1002/psp.1797
- Copus, A., D. Psaltopoulos, D. Skuras, I. Terluin, and P. Weingarten. 2008. Approaches to Rural Typology in the European Union. EUR 23634 EN. Luxembourg (Luxembourg): Office for Official Publications of the European Communities (OPOCE). JRC48464. https://publications.jrc.ec.europa.eu/repository/handle/JRC48464.
- Cuberes, D., K. Desmet, and J. Rappaport. 2021. “Urban Growth Shadows.” Journal of Urban Economics 123: 103334. doi:10.1016/j.jue.2021.103334
- De La Roca, J., and D. Puga. 2017. “Learning by Working in Big Cities.” The Review of Economic Studies 84 (1): 106–142. doi:10.1093/restud/rdw031
- De Renzis, A., A. Faggian, and G. Urso. 2022. “Distant but Vibrant Places. Local Determinants of Adaptability to Peripherality.” Tijdschrift voor economische en sociale geografie 113 (5): 483–501. doi:10.1111/tesg.12535
- Dijkstra, L., and H. Poelman. 2008. Remote Rural Regions. How Proximity to a City Influences the Performance of Rural Regions. Regional Focus n.1 (2008) EC-DG REGIO. https://apo.org.au/sites/default/files/resource-files/2008-01/apo-nid163156.pdf.
- Dijkstra, L., H. Poelman, and P. Veneri. 2019. The EU-OECD definition of a functional urban area. OECD Regional Development Working Papers, No. 2019/11. Paris: OECD Publishing. doi:10.1787/d58cb34d-en.
- Duranton, G. 2021. “Classifying Locations and Delineating Space: An Introduction.” Journal of Urban Economics 125: 103353. doi:10.1016/j.jue.2021.103353
- Duranton, G., and D. Puga. 2020. “The Economics of Urban Density.” Journal of Economic Perspectives 34: 3–26. doi:10.1257/jep.34.3.3
- Ellison, G., and E. Glaeser. 1999. “The Geographic Concentration of Industry: Does Natural Advantage Explain Agglomeration?” American Economic Review 89 (2): 311–316. doi:10.1257/aer.89.2.311
- Goerlich, F. J., & M. Mas. 2009. Drivers of Agglomeration: Geography vs. History. MPRA Paper No. 15802.
- Goerlich, F. J., & S. I. L. V. I. A. Mollá. 2021. Desequilibrios demográficos en España: evolución histórica y situación actual. Presupuesto y gasto público, 102 (I/2021): 31–54.
- Goerlich, F. J., E. Reig, and I. Cantarino. 2016. Construcción de una tipología rural/urbana para los municipios españoles. Investigaciones Regionales-Journal of Regional Research 35: 151–173.
- González-Leonardo, M., A. López-Gay, and A. Esteve. 2022. “Interregional Migration of Human Capital in Spain.” Regional Studies, Regional Science 9: 324–342. doi:10.1080/21681376.2022.2060131
- González-Leonardo, M., A. López-Gay, and J. Recaño Valverde. 2019. Brain Drain and the Second Wave of Depopulation. Barcelona, España: Universidad Autónoma de Barcelona (UAB).
- Grundel, I., and D. Magnusson. 2022. “Planning to Grow, Planning to Rock on – Infrastructure Management and Development in Shrinking Municipalities.” European Planning Studies. forthcoming. doi:10.1080/09654313.2022.2108311.
- Gutiérrez, E., E. Moral-Benito, D. Oto-Peralías, and R. Ramos. 2020. “The Spatial Distribution of Population in Spain: An Anomaly in European Perspective.” Banco de España Working Paper. Madrid, España: Banco de España.
- Gutiérrez-Posada, D., F. Rubiera-Morollon, and A. Viñuela. 2017. “Heterogeneity in the Determinants of Population Growth at the Local Level: Analysis of the Spanish Case with a GWR Approach.” International Regional Science Review 40: 211–240. doi:10.1177/0160017615589009
- Hoggart, K., and A. Paniagua. 2001. “The Restructuring of Rural Spain?” Journal of Rural Studies 17 (1): 63–80. doi:10.1016/S0743-0167(00)00037-1
- Holl, A. 2007. “Twenty Years of Accessibility Improvements. The Case of the Spanish Motorway Building Programme.” Journal of Transport Geography 15: 286–297. doi:10.1016/j.jtrangeo.2006.09.003
- Holl, A. 2011. “Mejoras de accesibilidad viaria: un estudio retrospectivo para la España peninsular.” Papeles de Geografía 53-54: 171–183.
- Holl, A. 2012. “Market Potential and Firm-Level Productivity in Spain.” Journal of Economic Geography 12: 1191–1215. doi:10.1093/jeg/lbr030
- Holl, A. 2016. “Highways and Productivity in Manufacturing Firms.” Journal of Urban Economics 93: 131–151. doi:10.1016/j.jue.2016.04.002
- Holl, A. 2019. “Natural Geography and Patterns of Local Population Growth and Decline in Spain: 1960–2011.” Sustainability 11 (18): 4979. doi:10.3390/su11184979
- Irwin, E., K. Bell, N. Bockstael, D. Newburn, M. Partridge, and J. Wu. 2009. “The Economics of Urban-Rural Space.” Annual Review of Resource Economics 1: 435–459. doi:10.1146/annurev.resource.050708.144253
- Johnson, K., and D. Lichter. 2019. “Rural Depopulation: Growth and Decline Processes Over the Past Century.” Rural Sociology 84: 3–27. doi:10.1111/ruso.12266
- Jonard, F., Lambotte, M., Ramos, F., Terres, J.-M. & Bamps, C. 2009. “Delimitations of Rural Areas in Europe Using Criteria of Population Density, Remoteness and Land Cover.” JRC Scientific Report, EUR, 23757. European Commission, Ispra, Italy.
- Lasanta, T., J. Arnáez, N. Pascual, P. Ruiz-Flaño, M. Errea, and N. Lana-Renault. 2017. “Space–time process and drivers of land abandonment in Europe.” CATENA 149: 810–823. doi:10.1016/j.catena.2016.02.024
- Laterra, P., M. Orúe, and G. Booman. 2012. “Spatial Complexity and Ecosystem Services in Rural Landscapes.” Agriculture, Ecosystems & Environment 154: 56–67. doi:10.1016/j.agee.2011.05.013
- Llorent-Bedmar, V., V. Palma, and M. Navarro-Granados. 2021. “The Rural Exodus of Young People From Empty Spain.” Socio-educational Aspects. Journal of Rural Studies 82: 303–314. doi:10.1016/j.jrurstud.2021.01.014.
- Martin, R. 2021. “Rebuilding the Economy from the Covid Crisis: Time to Rethink Regional Studies?” Regional Studies, Regional Science 8: 143–161. doi:10.1080/21681376.2021.1919191
- Martínez-Filgueira, X., D. Peón, and E. López-Iglesias. 2017. “Intra-rural Divides and Regional Planning: An Analysis of a Traditional Emigration Region (Galicia, Spain).” European Planning Studies 25 (7): 1237–1255. doi:10.1080/09654313.2017.1319465
- Merino, F., and M.. Prats. 2020. “Why do Some Areas Depopulate? The Role of Economic Factors and Local Governments.” Cities 97: 102506. doi:10.1016/j.cities.2019.102506
- Miyanaga, K., and D. Shimada. 2018. “The Tragedy of the Commons’ by Underuse: Toward a Conceptual Framework Based on Ecosystem Services and Satoyama Perspective.” International Journal of the Commons 12: 332–351. doi:10.18352/ijc.817
- Molinero, F., and M. Alario. 2022. Una mirada geográfica a la España rural. Madrid, España: REVIVES.
- Neumeier, S. 2017. “Social Innovation in Rural Development: Identifying the key Factors of Success.” Geographical Journal 183 (1): 34–46. doi:10.1111/geoj.12180
- Nunn, N., and D. Puga. 2012. “Ruggedness: The Blessing of bad Geography in Africa.” Review of Economics and Statistics 94 (1): 20–36. doi:10.1162/REST_a_00161
- Oto-Peralías, D. 2020. “Frontiers, Warfare and Economic Geography: The Case of Spain.” Journal of Development Economics 146: 102511. doi:10.1016/j.jdeveco.2020.102511
- Paniagua, A. 2020. “Smart Villages in Depopulated Areas.” In Smart Village Technology: Concepts and Developments, edited by S. Patnaik, S. Sen, and M. S. Mahmoud, 399–409. Cham: Springer International Publishing. Switzerland.
- Paniagua, A. 2021. “Sustainable Geographical Changes in Rural Areas: Key Paths, Orientations and Limits.” Sustainability 13: 2059. doi:10.3390/su13042059
- Partridge, M., R. Bollman, M. Olfert, and A. Alasia. 2007. “Riding the wave of urban growth in the countryside: Spread, backwash, or stagnation?” Land Economics 83: 128–152. doi:10.3368/le.83.2.128
- Partridge, M., D. Rickman, K. Ali, and M. Olfert. 2008. “Lost in Space: Population Growth in the American Hinterlands and Small Cities.” Journal of Economic Geography 8: 727–757. doi:10.1093/jeg/lbn038
- Pinilla, V., and L. Sáez. 2017. “La Despoblación Rural en España: Génesis de un Problema y Políticas Innovadoras.” Informes CEDDAR 2: 1–24.
- Pinilla, V., and L. Sáez. 2021. “What do Public Policies Teach Us About Rural Depopulation: The Case Study of Spain.” European Countryside 13 (2): 330–351. doi:10.2478/euco-2021-0021
- Redding, S. J., and M. Turner. 2015. “Transportation Costs and the Spatial Organization of Economic Activity.” In Handbook of Urban and Regional Economics, Vol. 5, edited by G. Duranton, J. V. Henderson, and W. Strange, pp. 1339–1398. Amsterdam: Elsevier.
- Reynaud, C., and S. Miccoli. 2018. “Depopulation and the Aging Population: The Relationship in Italian Municipalities.” Sustainability 10: 1004. doi:10.3390/su10041004
- Rizzo, A. 2016. “Declining, Transition and Slow Rural Territories in Southern Italy Characterizing the Intra-Rural Divides.” European Planning Studies 24: 231–253. doi:10.1080/09654313.2015.1079588
- Rodríguez-Pose, A. 2018. “The Revenge of the Places That Don’t Matter (and What to do About it).” Cambridge Journal of Regions, Economy and Society 11: 189–209. doi:10.1093/cjres/rsx024
- Ruiz Pulpon, A., and M. Canizares Ruiz. 2020. “Enhancing the territorial heritage of declining rural areas in Spain: Towards integrating top-down and bottom-up approaches.” Land 9 (7): 216. doi:10.3390/land9070216
- Slack, T., and L. Jensen. 2020. “The Changing Demography of Rural and Small-Town America.” Population Research and Policy Review 39: 775–783. doi:10.1007/s11113-020-09608-5
- Tuitjer, G., and P. Küpper. 2020. “How Knowledge-Based Local and Global Networks Foster Innovations in Rural Areas.” Journal of Innovation Economics & Management 33: 9–29. doi:10.3917/jie.033.0009
- van der Vaart, J. 2005. “Towards a new rural landscape: consequences of non-agricultural re-use of redundant farm buildings in Friesland.” Landscape and Urban Planning 70: 143–152. doi:10.1016/j.landurbplan.2003.10.010
- Viñas, C. 2019. “Depopulation Processes in European Rural Areas: A Case Study of Cantabria (Spain).” European Countryside 11: 341–369. doi:10.2478/euco-2019-0021
- Wu, H., and H. Yabar. 2021. “Impacts of Additive Manufacturing to Sustainable Urban–Rural Interdependence Through Strategic Control.” Results in Control and Optimization 5: 100066. doi:10.1016/j.rico.2021.100066