
 ?Mathematical formulae have been encoded as MathML and are displayed in this HTML version using MathJax in order to improve their display. Uncheck the box to turn MathJax off. This feature requires Javascript. Click on a formula to zoom.
ABSTRACT
Cross-border cooperation is a major instrument of European policy to overcome the barriers posed by national borders and correcting regional imbalances. But the question of whether it is leading to the convergence of cross-border regions (CBRs) is still open for debate, given the significant heterogeneity of borders and the localized and spatially bound nature of many border effects. This article analyses the beta and sigma convergences in GDP per capita growth for the NUTS-3 at the Portuguese-Spanish border between 2000 and 2018, also considering their population growth. The main finding is that, even if their population growth is below the national averages, the CBR is converging in economic terms. This convergence is visible in the reduced dispersion of the GDP in the border regions and is also confirmed by spatial models, which showed that being a border region increases the probability of having above-average growth rates and that the NUTS-3 with initially low GDP in the cross-border region were also growing above average. This convergence was found to be robust, considering different model specifications and important factors for convergence, such as population growth and spatial dependence. A negative relationship between population and GDP per capita growth was found.
Introduction
Border regions tend to assume a peripheral position in their countries, in geographic as well as political and social terms (Anderson, O’Dowd, and Wilson Citation2002). Although being contact zones between different cultures, these regions often face institutional, cultural or natural barriers (Christodoulou and Christidis Citation2020; van Geenhuizen and Rietveld Citation2002), and tend to have much less developed infrastructures (Christodoulou and Christidis Citation2020; Hansen Citation1977; Rietveld Citation2012) or transportation services (Cavallaro and Dianin Citation2020; Rietveld and Stough Citation2005; Vulevic et al. Citation2020). Borders also limit knowledge and innovation transfers (van den Broek, Benneworth, and Rutten Citation2018; Weidenfeld, Björk, and Williams Citation2016), economic spillovers (van Gorp Citation2009) or labour market mobility (Decressin and Fatás Citation1995; Monfort Citation2020), in particular when there are cultural or language differences (Mantegazzi, McCann, and Venhorst Citation2020). And the cultural differences between different sides of the border have been shown to influence the degree of cross-border relations between local and regional actors (Bakry and Growe Citation2022). Overcoming the barriers posed by national borders and promoting regional convergence have, therefore, been long-standing goals of the European project (Alcidi Citation2019; Barrios, Flores, and Martínez Citation2019; Hansen Citation1977; Ratti and Reichman Citation1993), which have been advanced through the establishment of procedural and legislative standards and also, more specifically, through policies and programmes aimed at increasing cohesion and cross-border integration, such as the European Territorial Cooperation programmes (INTERREG) (González-Gómez and Gualda Citation2020).
The removal of institutional and legal barriers and the implementation of these kinds of policies and programmes, should, in theory, improve the position of border regions in the EU. And it has been noted that these policies have led to increasing cross-border cooperation (CBC) and for systematically reducing many cross-border barriers (Medeiros and Neto Citation2021). It is, nonetheless, difficult to find a straight answer regarding the degree to which regional growth is affected by the proximity to international borders and if/how these border-effects have been changing. Some authors identify a positive effect of European integration, such as Basboga (Citation2020), who observe that European border regions’ gross value added grew after the opening of national borders. But other authors also question the reach of these effects. Camagni, Capello, and Caragliu (Citation2019), for example, estimate that European administrative and legal border barriers still lead to a significant loss in GDP per capita, while Goecke and Hüther (Citation2016), found that abutting an international border had no effect on the probability of economic convergence in EU regions. Kallioras et al. (Citation2011) found that border regions behave differently, with some converging and others diverging, while Capello, Caragliu, and Fratesi (Citation2018b) note that border regions perform above average in the resources that are available to them, but lag behind in the efficient use of these resources – although in another article they note that this depends on the type of territorial resources that are explored (Capello, Caragliu, and Fratesi Citation2018a).
The difficulty in finding a clear pattern in the border effects at the EU level might partly reflect measurement problems, such as modifiable areal unit problems or the overrepresentation of some geographical locations (e.g. in countries such as Sweden or the Czech Republic almost all NUTS-3 can be considered border regions). Further adding to this difficulty is the relationship between border effects and broader regional and national convergence or divergence processes, which are influenced by drivers that operate at different scales and, often, in different directions. While some studies, for example, observe regional convergence in the EU (Alcidi Citation2019; Goecke and Hüther Citation2016; Pietrzykowski Citation2019), other analysis show that this convergence is the outcome of decreasing disparities between member states and not a convergence at the country level, where disparities have been increasing (Geppert and Stephan Citation2008; Kilroy and Ganau Citation2020; Monfort Citation2020). Other studies also stress the importance of national factors for convergence processes, noting that these factors play different roles for different regions, namely depending on how far they are from the leading regions in the national contexts (Costa, Garcilazo, and Oliveira Martins Citation2019).
Moreover, it has been noted that regional economic growth is subject to significant spatial dependence, that is related to spatial spillovers (Cuaresma, Doppelhofer, and Feldkircher Citation2014; Mohl and Hagen Citation2010; Postiglione, Cartone, and Panzera Citation2020) and the spatial autocorrelation of economic growth factors (Costa, Garcilazo, and Oliveira Martins Citation2019; Bo and Florio Citation2012). In the convergence literature this has led to the concept of club convergence, which suggests that regions’ ‘common balanced growth path can only be expected if their initial conditions are in the basin of attraction of the same steady state equilibrium’ (Bartkowska and Riedl Citation2012, 22), and which is expressed in the tendency for regions which similar structural conditions to converge to similar levels of economic development (Barrios, Flores, and Martínez Citation2019; Bartkowska and Riedl Citation2012; Kallioras et al. Citation2011; Monfort, Cuestas, and Ordóñez Citation2013). The increased likelihood of sharing these structural conditions that comes with geographic proximity (as expressed in Tobler’s first law of geography; Tobler Citation2004; Tobler Citation1970), also means that this club convergence tends to be geographically bound and that it is necessary to isolate the border effect from other factors that influence the convergence/divergence of specific regions.
But, most importantly, the identification of clear trends regarding the convergence of border regions is challenged by the nature of border effects. In fact, and contrary to European integration, which is based on supranational institutions and legislative processes to harmonize socioeconomic and procedural standards (González-Gómez and Gualda Citation2020), cross-border relations are localized and specific processes, with very different types of barriers (Tripathi Citation2015), history of joint projects and initiatives or governance structures (Durand and Decoville Citation2020; González-Gómez and Gualda Citation2020; Pupier Citation2020). The particular geographic context of different borders is also relevant, meaning that the border effects in some regions (e.g. highly central and dynamic ones) are very different from the border effects in other regions (e.g. more remote ones) (Feliu et al. Citation2013; Kallioras et al. Citation2011). In short, considering the significant heterogeneity of borders and the localized nature of many border effects, their measurement is very sensitive to the selected sample, the time-period, or the applied methodology. We, therefore, consider that a comprehensive picture of cross-border convergence is best obtained by complementing more general analysis (for example, at the EU level) with studies that focus on specific spatial contexts, and the way borders influence regional growth within them.
This article contributes to this subject by analysing the convergence of the cross-border region (CBR) of Portugal and Spain. As can be concluded from the next section, the CBC, although starting from low levels of cooperation and suffering from a peripheral position and low levels of socioeconomic development (Fernández and Trigal Citation2017; Medeiros and Neto Citation2021; Trigal Citation2005), is generally considered to have witnessed an increase in political interest, institutional integration and infrastructural development in the last three decades (Medeiros Citation2010; Rivera and Vázquez Citation2018). The open question is if this increased cooperation can be related to above average economic growth rates in the CBR. For answering this question, and after reviewing the CBC between both countries, we analyse if the CBR has been converging with the rest of the Portuguese and Spanish NUTS-3, considering the population and GDP per capita between 2000 and 2018. We assume, as do many authors, that convergence is a key concept for comparing the performance of regions or countries (Mankiw, Romer, and Weil Citation1992; Rey, Kang, and Wolf Citation2019; Sala-i-Martin and Barro Citation1991) and that economic convergence, while having significant limitations, is still important for assessing the regional disparities in development and, thus, for the degree of economic and social cohesion in the EU (Monfort Citation2008; Postiglione, Cartone, and Panzera Citation2020). Acknowledging the sharp demographic decline that affects many of the European regions, we also consider that it is important to include population change in the analysis – several authors have noted that demographic components, despite tending to be neglected, are important for economic growth (Headey and Hodge Citation2009; Lopes and Araújo Citation2016; Wesley and Peterson Citation2017).
Two types of convergence are analysed: sigma convergence, referring to the level of dispersion in growth rates between regions; and beta convergence, referring to the tendency for regions with lower initial values to grow above average (a catching-up process). The former is measured through the coefficient of deviation, while for the latter a growth function is used, where the explanatory variables include the initial GDP per capita and dummy variables for the border regions, as well as population growth. The parameters of this function are estimated through an ordinary least squares model (OLS) and a spatial error model (SEM), solved with a maximum likelihood and a Bayesian inference method to address the heterogenous (but structured) nature of regions’ socioeconomic and spatial characteristics and the bias they can introduce in standard regression models (Beenstock and Felsenstein Citation2008).
We make three major contributions to the analysis of cross-border convergence. First, we show that in the CBR the significant increase in cooperation was accompanied by economic convergence with the most developed regions of both countries, with the border having a positive effect on GDP per capita growth. We also show that this convergence is robust when controlling for spatial dependence which, in line with previous analyses (Mohl and Hagen Citation2010; Rey and Dev Citation2006; Rey and Janikas Citation2005), was shown to change the significance of the parameters measuring convergence.
Second, we show the importance of considering the convergence of border regions in the context of broader regional growth processes. For example, the beta convergence of the CBRs, and its absence in all the NUTS-3 of both countries, means that the convergence of the border regions with the best-performing regions is not explained by their low initial GDP, since this effect is not visible in non-border regions. Through this approach, it is possible to separate the convergence of the border regions from the broader convergence tendencies that have been observed for lagging European regions (Goecke and Hüther Citation2016; Monfort Citation2020).
Finally, we identify a significant and negative relationship between population growth and GDP per capita growth. This relationship has not, to the best of our knowledge, been previously identified for CBRs, and tends to be ignored in regional convergence analyses. This is the case in Goecke and Hüther (Citation2016), who analyse the convergence in GDP per capita of the EU’s NUTS-3, in Alcidi (Citation2019) and Pietrzykowski (Citation2019), making a similar analysis at the national and NUTS-2 level, or in Monfort (Citation2020), who analyse convergence for NUTS-2 and NUTS-3 level. For CBRs, population growth is also not considered by Capello, Caragliu, and Fratesi (Citation2018b), who measure the supply-side border-effects on GDP per capita growth, or Kallioras et al. (Citation2011), who analyse club GDP per capita convergence in the border regions applying the regions’ initial populations to a weighted least squares method, but do not consider its growth over time.
The cross-border cooperation between Portugal and Spain
Cross-border cooperation (CBC) has been a key feature of EU policy, consisting of a partnership between local or regional authorities of different countries to develop joint projects or strategies (Perkmann Citation2003). Although cross-border cooperation has been established in European regions since the late 1950s (where the creation of the Euregio between Germany and the Netherlands in 1958 stands out), it was through the Madrid Framework Convention for Transfrontier Cooperation in 1980 that CBC assumed a more formal, and definitive, character (Reitel, Wassenberg, and Peyrony Citation2018; Ricq Citation2006). In 1990, CBC was significantly promoted through the European Territorial Cooperation programmes (INTERREG), which financed numerous projects in five successive periods – INTERREG I (1990-1993), INTERREG II (1994-1999), INTERREG III (2000-2006), INTERREG IV (2007-2013) and INTERREG V (2014-2020) (European Commision Citation2021). In 2007, CBC became an integral part of the European regional policy through the concept of territorial cooperation, which also included transnational and inter-regional cooperation, stressing the diversity and complexity of cooperation, which goes beyond geographic contiguity (Reitel, Wassenberg, and Peyrony Citation2018). This also means that there are many different models of CBC in the EU and that, while some communities have adopted more formal and ambitious institutional frameworks, such as the Euregions (Proto Citation2008) or EuroCities (Castanho, Naranjo Gómez, and Kurowska-Pysz Citation2019), others opted for more spontaneous and thematic forms (Pupier Citation2020).
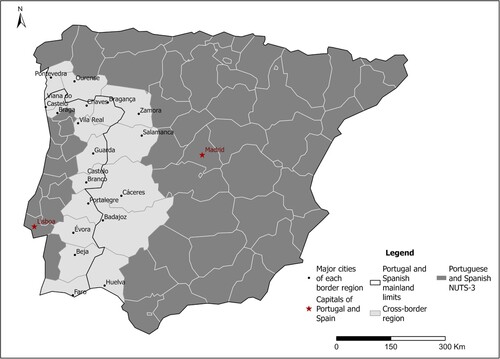
The specific models for CBC are very dependent on the type of border and their history. It has, namely, been noted that CBC as a social innovation can be associated with developed, urbanized and populated areas, where elements of socioeconomic complementarity are already present, facilitating cross-border regional awareness (Rivera and Vázquez Citation2018) (see for the general layout of the CBR). The Portuguese-Spanish CBR (or the Raya, as it is also known) fulfils none of those criteria, being mostly dominated by lagging, low-density territories with declining and ageing populations and a polycentric, poorly developed, urban network (Fernández and Trigal Citation2017; Medeiros and Neto Citation2021; Trigal Citation2005). The two states also have a history of coexisting without much interaction throughout most of the last century, essentially limiting the cross-border contacts to local trade and smuggling (Vázquez Citation2015), and setting conditions that are not very favourable to CBC.
The accession of both countries to the European Economic Community in 1986 and, later, the European Single Market, radically changed these situations, creating opportunities for a broader and more institutionalized, cooperation (Medeiros and Neto Citation2021; Rivera and Vázquez Citation2018). This cooperation gained increased momentum throughout the 1990s when, resulting from various protocols, many working groups and communities were established, such as Galicia North of Portugal (1991); Alentejo-Extremadura (1992); Andalusia-Algarve (1995); Castilla Léon-Centre of Portugal (1995); Castile León-North of Portugal (1995); the Braganza-Zamora (2000); or Andalusia-Alentejo (2001) (Rivera and Vázquez Citation2018).
In 2002 the Convention between the Republic of Portugal and the Kingdom of Spain for Cross-border Cooperation between Territorial Entities and Instances was signed in Valencia (entering into force in 2004), further institutionalizing the CBR between both countries and translating the guidelines of the Madrid Convention (Pérez-Nieto Citation2016). From the late 2000s onward, the Portuguese-Spanish border witnessed a significant increase in the establishment of territorially driven cross-border entities (Medeiros and Neto Citation2021), leading, namely, to the constitution of several EuroCities (Valença-Tui, Chaves-Verin, Monção-Salvaterra, Cerveira-Tomiño, Badajoz-Elvas and the EuroCity of the Guadiana) and five Euroregions – the Alentejo-Centro-Extremadura, the Alentejo-Algarve-Andalusia, the Galicia-North Portugal, the Duero-Douro and the Zasnet (the latter two later formed European Groupings of Territorial Cooperation, EGTC).
The successive INTERREG programmes were important in providing financial support to many of these initiatives and for the construction of many cross-border infrastructures, such as bridges over the Minho, Douro, Tagus, or Guadiana (INTERREG Portugal-Spain Citation2022), particularly in the early stages of the programmes’ implementation (Medeiros, Citation2010). They also helped to build institutional and cross-border management capacity and, similarly to other EU funding mechanisms, have been moving from infrastructural to socioeconomic development strategies (Medeiros Citation2007). In the latest programming period (2014-2020), the INTERREG was applied through the Program for Cross-border Cooperation between Portugal and Spain (POCTEP) aiming to: develop research, technological development and innovation; increase firms’ competitiveness; increase territorial resilience, address climate change and natural risks; protect the environment and promote an efficient use of resources; improve the institutional capacity and the efficacy of cross-border initiatives (INTERREG Portugal-Spain Citation2022). This programming period also witnessed a significant increase in funding which, compared to the previous period, increased tenfold, to approximately 485 million euros (INTERREG Portugal-Spain Citation2022). The latest Interreg programme (POCTEP 2021-2027) is essentially aligned with the priorities from the previous programme and, while seeing a slight decrease in funding (427 million euros), is the biggest CBC programme in the EU (INTERREG Portugal-Spain Citation2022).
It should, however, be noted that much of the efforts for CBC were driven by state initiative as well as EU funding opportunities (Fernández and Trigal Citation2017; Medeiros Citation2010; Rivera and Vázquez Citation2018) and that, as a consequence, there is a lack of public engagement with cross border institutions and initiatives (Trillo-Santamaría Citation2014) and limited participation of local and regional stakeholders, when compared to other CBC (González-Gómez and Gualda Citation2020; Medeiros Citation2010). But there is a discernible trend for intensification, marked by the adoption of more robust frameworks, by a move towards strategic cooperation and by a significant increase in financing. The many cross-border initiatives and institutions, and improved accessibilities, are also leading to a gradual normalization and diversification of cross-border relations (Medeiros Citation2010; Rivera and Vázquez Citation2018), facilitated by the fact there are no particularly severe cultural and linguistic barriers (particularly in the CBR’s north, where cross-border integration is considered strongest; Rivera and Vázquez Citation2018; Trillo-Santamaría Citation2014).
The open question is if, given the political interest in cross-border initiatives and the sizeable financial resources applied to support them, there has been a mitigation of the border effect in the CBR. And if so, if it led to an observable decrease in the difference between the economic development of those regions and the rest of the Portuguese and Spanish NUTS-3. The methodology of the next section aims to provide some answers to these questions.
Data and methods
To analyse the convergence of the Portuguese-Spanish CBR, we considered the GDP per capita in purchasing power parity as well as the population of the 71 NUTS-3 of Portugal and Spain in their 2013 delimitation (all oversea territories were excluded). The criterion for being considered a border region was to have physical contact with the border, leading to the selection of eleven NUTS-3 in Portugal and seven in Spain. The chosen timespan for economic convergence was from 2000 to 2018 and is considered adequate to measure medium-term trends while stopping before 2020 is important due to the unpredictable, and ongoing, effects of the Covid-19 epidemic. All data were obtained from the National Statistical Institutes from both countries, and, for population, the 2001 and 2021 Censuses were used.
Besides a descriptive analysis of the regional growth rates and their geographic patterns, two types of convergence were analysed: sigma convergence and beta convergence. For analysing the sigma convergence, the coefficients of deviation between the border regions and the other NUTS-3 of Portugal and Spain were calculated, expressing the ratio of the standard deviation and the sample mean. Beta convergence is generally analysed through a growth equation, where the growth rate is estimated as a function of the initial GDP per capita (Sala-I-Martin Citation1996; Young, Higgins, and Levy Citation2008). This model can be formulated as:
(1)
(1) where
is the GDP growth rate between (t = 2001 and 2021; z = 20 years) for each NUTS-3
,
is the GDP at the base year (2000) in each region
,
are additional covariates which describe characteristics of
and
measures their importance for explaining
. In our case, X includes a dummy variable to distinguish the CBRs and a slope dummy variable to measure the specific convergence effects inside the CBRs. The population growth rate between 2001 and 2018 for each region is also included, to control for the impact that fast-shrinking populations might have on GDP per capita (as was stressed in the introduction). Following the standard framework for analysing convergence, the regression parameter
can be interpreted as a measure of beta convergence across regions
. Finally,
is assumed to be an idiosyncratic random term, independent and identically distributed across
.
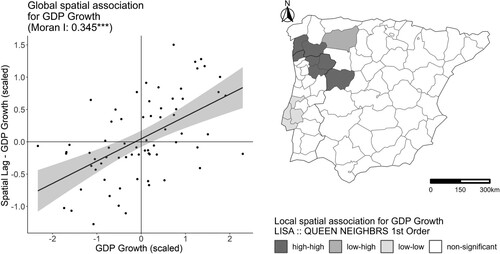
In spatial data, often the variance-covariance of the error term is not stable over space and similar values tend to form clusters (Monfort Citation2008). And, as noted by many different authors (Bartkowska and Riedl Citation2012; Harris, Moffat, and Kravtsova Citation2011), this tends to be true for economic growth, which depends on spillover effects and on structural conditions (Costa, Garcilazo, and Oliveira Martins Citation2019) that, as already stated by Tobler’s first law of geography (Tobler Citation2004; Tobler Citation1970), are more likely to be shared with geographic proximity. In our study, an exploratory spatial analysis shows a significant spatial autocorrelation in the GDP per capita growth rates (Moran’s I = 0.346), considering as neighbours all those regions which share a border (queen contiguity). This means that spatial autocorrelation must be addressed to produce robust parameter estimates.
There are different econometric approaches for including this kind of relationship. Assuming an exogenous spatial interaction structure between regions as the source of (spatial) dependence, a spatial error model (SEM) is the most appropriate specification. The choice of this type of specification is also supported by the Lagrange multiplier diagnostic tests (LMerr e LMlag and their robust versions) (Anselin et al. Citation1996) and the likelihood ratio tests (Vuong Citation1989), which were applied in a sequential (bottom-up) decision procedure based on the approach defined by Elhorst (Citation2010) (see ).
Table 1. Spatial model specification selection procedure and its results.
To accommodate the spatial interaction effects, the stochastic error component defined in equation (1) can be rewritten as:
(2)
(2) where
is a (predefined) spatial weights matrix and
is the parameter, to be estimated, which measures the importance of the spatial interaction mechanism. This model is usually estimated through a maximum likelihood framework.
As pointed by LeSage and Pace (Citation2009), notwithstanding the efforts to produce a more robust model considering the specification of spatial interaction structures, the nature of spatial idiosyncrasies can remain a source of additional heteroscedasticity. In fact, due to the characteristics of geographic units, spatial phenomena are commonly subject to outliers and to a degree of variance that is not well explained by standard growth models (Grillitsch et al. Citation2021).
To deal with these kinds of problems, we also adopted a Bayesian framework, which is considered a flexible and efficient strategy to address them (Gelman et al. Citation2013). An important aspect of this framework is that the parameter estimations are retrieved from a specific statistical distribution, allowing prior assumptions regarding this distribution and to estimate numerical approximations to the model’s posterior distribution using Monte Carlo Markov Chains or the Hamiltonian Monte Carlo Sampling, which was used here.
The standard linear model described in Equationeq. 1(1)
(1) can be rewritten through the statistical distribution notation, such as:
(3)
(3) where it is possible to additionally specify the following priors for the parameters to be estimated, according to a Bayesian approach:
(4)
(4)
The typical outliers and additional heteroscedastic problems of spatial regression models can be jointly addressed in this framework following the proposal of Geweke (Citation1993). This author suggests that a robust model estimation strategy can be obtained through the specification of the posterior distribution of the spatial model as a Student-t distribution with an unknown number of degrees of freedom. This model can be specified as:
(5)
(5) With the following (weakly informative) priors:
(6)
(6)
The estimation of this Bayesian model was done using R with two chains, a total number of 2100 interactions (in each chain) and half of them allocated to the burn-in phase.
Results and discussion
Overall economic and demographic trajectories and sigma convergence
As is shown in , the economic and demographic growth rates have contradictory trajectories in the CBR. In demographic terms, the CBR is declining sharply and its population growth rates are below the joint average of both countries and below the individual country averages on each side of the border, in line with the generally negative growth rates in EU border regions (Brakman et al. Citation2012). also shows that the Portuguese border regions, while witnessing a population decline that is much steeper than the Spanish ones, are still closer to the national average than the latter, considering the different national trends in both countries. The growth of GPD per capita, on the contrary, is relatively high in the CBR, on both sides of the border.
Table 2. Average yearly growth rates of the population (2001–2021) and GDP per capita (2001–2018).
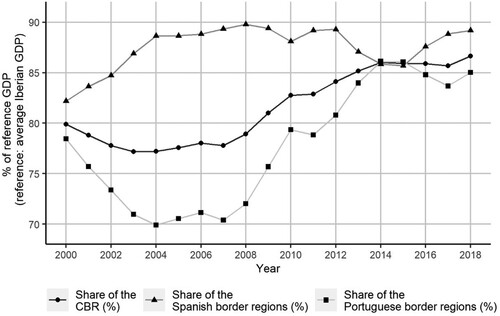
The CBR’s above-average growth rates mean that its share of the GDP per capita rose from about 79% of the average of the Iberian Peninsula in 2000, to about 87% in 2018 (). This relative growth of the GDP is very similar in both border regions, and the share of the GDP increased from about 78% to about 85% of the national average in Portugal, while in Spain it increased from about 82% to about 89%. But the trajectories of these values over time are very different, with the Portuguese side of the border witnessing a divergence from the national average from 2000 until 2007, only afterwards converging in most years, while the Spanish side of the border witnessed an early convergence which peaked in 2009, and afterwards fluctuated slightly below this value.
Figure 1. Portuguese and Spanish cross-border region.
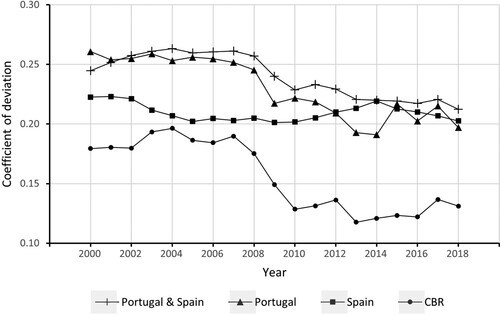
The overall level of dispersion of GDP per capita levels also diminished in the analysed period, showing clear signs of a sigma convergence (). This is true when jointly considering the 71 NUTS-3 of Portugal and Spain, for which there was a drop in the coefficient of deviation from 2000 to 2018, and, also, when considering only the NUTS-3 of the CBR and of each country individually.
Figure 2. GDP per capita share of the cross-border region in Portugal and Spain and of each border region as a share of the respective national average.
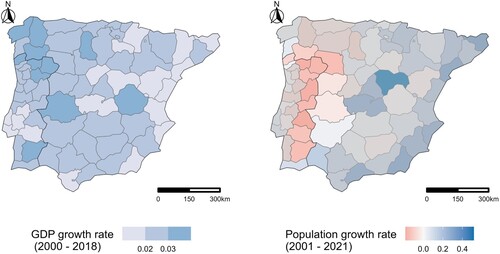
There are, however, territorial differences in the growth rates along the border, as illustrated by . Regarding GDP per capita, in the north, there is a cluster of regions with high growth rates on both sides of the border, while in the south there is no identifiable similarity in the behaviour of each side of the border. Population also shows a more similar behaviour in the northern part of the border, with most of the NUTS-3 on each side declining, while in the south the Portuguese side of the border shows a much more negative trend than the Spanish one.
Figure 3. Sigma convergence of the GDP per capita of the NUTS-3 of Portugal, Spain and the cross-border region.
The differences in GDP growth in the CBR are also visible in the local indicators of spatial association (LISA), which were proposed by Anselin (Citation1995) and express the positive or negative association of a variable’s value at a given location with the value of its neighbours. As shown in , and although the Moran’s I for all NUTS-3 of Portugal and Spain shows a significant, and high, spatial autocorrelation, the only significant local spatial autocorrelations are the below-average values around the Metropolitan Area of Lisbon and a cluster of above-average values on the northern border. The affected regions comprehend parts of the Galicia-North of Portugal border, which is considered the most integrated one in economic, political and institutional terms (Pérez-Nieto Citation2016; Trillo-Santamaría Citation2014), but also some of the more remote, less dynamic and less densely populated NUTS-3 on the north-eastern part of the border.
Figure 4. Economic growth and demographic growth rates, by NUTS-3.
Beta convergence
The spatial autocorrelation needs to be addressed when analysing convergence processes. As was stated in the Data and Methods, this was done through the adoption of a spatial error model solved through a maximum likelihood method as well as a Bayesian framework to guarantee a more robust estimation procedure given the exploratory data insights, such as the empirical data distribution ().
Figure 5. Global and Local indicators of spatial association for GDP growth between 2000 and 2018, by NUTS-3.
reports the estimates for the baseline model (OLS) and the spatial error model based on both frameworks. Given the different statistical frameworks, confidence intervals (for OLS and the spatial error model estimated through maximum likelihood) and credible intervals (for the Bayesian spatial error model) are reported for significance analysis. These results show the relevance of a robust estimation strategy, since the parameter related with beta convergence (Beta(1), for the LnGDP2000 variable) is significant at the usual levels for the OLS model, but not once the spatial effects are considered. The significant parameter estimated for these spatial effects (), is aligned with the complex phenomena revealed by the research on regional convergence in the EU (Harris Citation2011), such as club or cluster convergence (Bartkowska and Riedl Citation2012; Monfort, Cuestas, and Ordóñez Citation2013), and the rising role of spatial structures, spatial diffusion and spatial spillovers in regional growth patterns (Cuaresma, Doppelhofer, and Feldkircher Citation2014; Postiglione, Cartone, and Panzera Citation2020). Besides measuring these effects, the inclusion of the spatial error component also acts as a parsimonious proxy for unobserved spatial influences between regions, without introducing bias in the estimates for β that typically arises when larger, spatially related, variables are considered as an estimation strategy to fix these effects.
Figure 6. GDP growth rate between 2000 and 2018 – general shape.
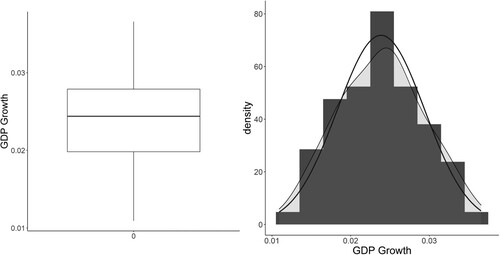
Table 3. Estimation results.
It should further be noted that regional convergence at the EU level has also been shown to be the outcome of approximating values between countries, while at the national level forces leading to economic agglomeration have led do increasing disparities (Geppert and Stephan Citation2008; Kilroy and Ganau Citation2020; Monfort Citation2020). A smaller geographic scope (two countries) can, thus, limit the impact of this EU-wide approximation and lead to the absence of significant convergence processes. And, in fact, previous analyses of the Portuguese and Spanish NUTS-3 also failed to identify economic convergence (Viegas and Antunes Citation2013).
For the CBR, on the contrary, there is a significant beta convergence, since both the dummy variable for sharing a border (CrossBorder) and the slope dummy variable considering the initial GDP of the CBR’s NUTS-3 (CrossB_LnGDP2000) have significant coefficients in all three model specifications. Considering that the spatial dependence is controlled for, this allows us to conclude that the cross-border convergence is related to the border effect and does not merely express a spatial club convergence. The fact that there is a convergence in the border regions, but not in all Portuguese and Spanish NUTS-3, further allows to isolate the border effect from the larger convergence processes, such as the tendency for lagging geographical locations in the EU to grow faster (as was shown by Goecke and Hüther Citation2016). This approach also allows to control for the tendency of less developed EU regions to receive significant national or EU funding (such as the European Structural and Investment Funds), which was shown to influence regional convergence processes (Caldas, Dollery, and Marques Citation2018).
Another interesting finding is the significant, and negative, relationship between GDP per capita growth and population growth. This finding confirms the importance of including population growth as a control variable when analysing economic growth – as was noted, demographic variables tend to be absent in regional convergence analyses, such as in Goecke and Hüther Citation2016; Alcidi Citation2019; Pietrzykowski Citation2019; or Monfort Citation2020, and also in the analysis of border effects on economic growth, such as in Capello, Caragliu, and Fratesi (Citation2018b) or Kallioras et al. (Citation2011).
But this finding is also relevant on its own, considering that the relationship between population growth and per capita economic growth is subject to contradictory findings. For example, Wesley and Peterson (Citation2017) and Headey and Hodge (Citation2009) found that this relationship is contingent to particular circumstances, depending on the age-structure of the population, the degree of economic development, or the quality of policies and institutions, while Lopes and Araújo (Citation2016), found that GDP per capita growth was independent from demographic variables for the Portuguese and Spanish NUTS-3, between 1995 and 2012. Moreover, the accelerated population decline in many regions might lead to changes in the relationship between these variables. For example, declining territories often witness the emigration of young and qualified populations (Wolff and Wiechmann Citation2018), leading to higher dependency rates, decreased labour pools and a less qualified labour-force, as well as diseconomies of scale and decreases in regional demand. Decline also affect regions’ attractiveness, generating brownfields (Jaroszewska Citation2019), vacant housing, or image problems (Johnson, Hollander, and Hallulli Citation2014). Whether these problems outweigh the positive impact of slow or negative population growths on per capita economic growth or if, as in the Portuguese-Spanish NUTS-3, the decline of many regions leads to an increase in their relative wealth, is a relevant question for scientific inquiry.
Conclusions
This article contributes to the understanding of cross-border convergence in the EU, in the context of increased integration and cooperation, based on the analysis of economic growth in the Portuguese-Spanish cross-border region (CBR). While being frequently addressed in the literature, this subject is challenging, given the sensitivity of economic convergence processes to localized and contextual factors, and the difficulty in isolating the border effect from other drivers and trends in regional growth. We consider that this article provides and interesting approach to these challenges, by considering the convergence of the CBR in the context of broader convergence processes in Portugal and Spain and by adopting a modelling approach that considers the effects of spatial dependence and population growth.
Our main finding is that the Portuguese-Spanish border NUTS-3 converged with the more developed regions of both countries in GDP per capita from 2000 to 2018. This trend is visible, on a merely descriptive level, by the CBR’s increasing share in the national GDPs, but it is also confirmed by the beta convergence models, which showed that being a border region increases the probability of having above average growth and that having lower initial GDP in the CBR was also associated with higher growth rates.
This cross-border convergence is even more relevant considering the absence of beta convergence in all Portuguese and Spanish NUTS-3 and that this relationship remains relevant when fixing spatial dependence. This means that the above-average growth rates in the border regions are not merely explained by their low starting positions or by a process of club convergence, by which regions with similar starting conditions in the EU converge to similar levels of development (Bartkowska and Riedl Citation2012; Monfort, Cuestas, and Ordóñez Citation2013) and which has also been observed for Portugal and Spain (Viegas and Antunes Citation2013). The contrast between decreasing dispersion of the GDP per capita in all the Portuguese and Spanish NUTS-3, together with the absence of a significant beta convergence, is also a good illustration of how club convergence can influence standard convergence measures: It can lead to an overall decrease in dispersion without guaranteeing any catching-up of the regions with initially lower GDP (the opposite of the leapfrogging process, by which groups of less wealthy regions surpass wealthier ones, and which can occur without reducing the data’s dispersion; Rey, Kang, and Wolf Citation2019).
The analysis also revealed a negative relationship between economic and demographic growth. This finding is relevant for analytical purposes, considering that population growth tends to be ignored in economic convergence and that the relationship between economic and population growth produces contradictory findings (in Portugal and Spain Lopes and Araújo Citation2016, for example, found this relationship to be insignificant). The demographic decline and below-average growth rates of European border regions (Brakman et al. Citation2012), as well as the more general trend for regional ageing and decline in the EU (Johansson, Nilsson, and Westlund Citation2018), also make it increasingly important to consider demographic changes when analysing economic growth patterns, considering questions such as: What are the minimum population thresholds for a functioning economy in peripheral border regions (such as the Raya)? What are the contextual factors that explain positive or negative relationships between these variables?
However, this relationship also reveals the limits of economic convergence regarding the broader challenges faced by border regions. In particular, it shows that economic convergence can coexist with very significant challenges to these regions’ quality of life, such as the negative consequences of drastic population decline (notwithstanding the opportunities created by decline, such as land use changes in cities; Haase, Haase, and Rink Citation2014; Johnson, Hollander, and Hallulli Citation2014; or the possibility for rewilding some rural areas; Navarro and Pereira Citation2015). It also stresses the multidimensional nature of border effects, which can be mitigated in some dimensions, while growing in others, and which this article largely leaves unaddressed. Another limitation is that this article, while observing increased cooperation and economic convergence in the CBR, did not explore this relationship more in detail, nor the particular effects of border barriers. In the Raya, there still remain, for example, significant legal and institutional barriers and mismatches, such as the existence of regional autonomy on the Spanish side of the border and its absence in Portugal (Medeiros Citation2010; Pérez-Nieto Citation2016), and the CBC has been characterized by a top-down approach and by significant infrastructural development (Fernández and Trigal Citation2017; Medeiros Citation2010; Rivera and Vázquez Citation2018). How these traits influence convergence processes would be an interesting subject for further analysis. The main challenge lie, as was noted by Basboga (Citation2020), in the complex relationship between CBC and the many factors affecting regional growth, as well as in the difficulty of isolating CBC from other outcomes of European integration.
Disclosure statement
No potential conflict of interest was reported by the author(s).
Additional information
Funding
References
- Alcidi, C. 2019. “Economic Integration and Income Convergence in the EU.” Intereconomics 54 (1): 5–11. doi:10.1007/s10272-019-0783-6.
- Anderson, J., L. O’Dowd, and T. Wilson. 2002. “Introduction: Why Study Borders Now?” Regional & Federal Studies 12 (4): 1–12. doi:10.1080/714004775.
- Anselin, L. 1995. “Local Indicators of Spatial Association-LISA.” Geographical Analysis 27 (2): 93–115. doi:10.1111/j.1538-4632.1995.tb00338.x.
- Anselin, L., A. Bera, R. Florax, and M. Yoon. 1996. “Simple Diagnostic Tests for Spatial Dependence.” Regional Science and Urban Economics 26 (1): 77–104. doi:10.1016/0166-0462(95)02111-6.
- Bakry, A., and A. Growe. 2022. “Spatial Effect of Ethnicity on Cross-Border Regions. Comparative Analysis for a Cultural Aspect Based on Territorial and Network Perspectives: The Cases of the EU Basque and Upper Rhine Border Regions.” European Planning Studies 0 (0): 1–23. doi:10.1080/09654313.2022.2120764.
- Barrios, C., E. Flores, and MÁ Martínez. 2019. “Club Convergence in Innovation Activity Across European Regions.” Papers in Regional Science 98 (4): 1545–1565. doi:10.1111/pirs.12429.
- Bartkowska, M., and A. Riedl. 2012. “Regional Convergence Clubs in Europe: Identification and Conditioning Factors.” Economic Modelling 29 (1): 22–31. doi:10.1016/j.econmod.2011.01.013.
- Basboga, K. 2020. “The Role of Open Borders and Cross-Border Cooperation in Regional Growth Across Europe.” Regional Studies, Regional Science 7 (1): 532–549. doi:10.1080/21681376.2020.1842800.
- Beenstock, M., and D. Felsenstein. 2008. “Regional Heterogeneity, Conditional Convergence and Regional Inequality.” Regional Studies 42 (4): 475–488. doi:10.1080/00343400701291500.
- Del Bo, C., & Florio, M. (2012). Infrastructure and Growth in a Spatial Framework: Evidence from the EU Regions. European Planning Studies, 20(8), 1393–1414. doi:10.1080/09654313.2012.680587
- Brakman, S., H. Garretsen, C. Van Marrewijk, and A. Oumer. 2012. “THE BORDER POPULATION EFFECTS OF EU INTEGRATION*.” Journal of Regional Science 52 (1): 40–59. doi:10.1111/j.1467-9787.2011.00752.x.
- Caldas, P., B. Dollery, and R. Marques. 2018. “European Cohesion Policy Impact on Development and Convergence: A Local Empirical Analysis in Portugal Between 2000 and 2014.” European Planning Studies 26 (6): 1081–1098. doi:10.1080/09654313.2018.1449815.
- Camagni, R., R. Capello, and A. Caragliu. 2019. “Measuring the Impact of Legal and Administrative International Barriers on Regional Growth.” Regional Science Policy & Practice 11 (2): 345–366. doi:10.1111/rsp3.12195.
- Capello, R., A. Caragliu, and U. Fratesi. 2018. “Compensation Modes of Border Effects in Cross-Border Regions.” Journal of Regional Science 58 (4): 759–785. doi:10.1111/jors.12386.
- Capello, R., A. Caragliu, and U. Fratesi. 2018. “Measuring Border Effects in European Cross-Border Regions.” Regional Studies 52 (7): 986–996. doi:10.1080/00343404.2017.1364843.
- Castanho, R., J. Naranjo Gómez, and J. Kurowska-Pysz. 2019. “How to Reach the Eurocities? A Retrospective Review of the Evolution Dynamics of Urban Planning and Management on the Iberian Peninsula Territories.” Sustainability 11 (3): 602. doi:10.3390/su11030602
- Cavallaro, F., and A. Dianin. 2020. “Efficiency of Public Transport for Cross-Border Commuting: An Accessibility-Based Analysis in Central Europe.” Journal of Transport Geography 89(September): 102876. doi:10.1016/j.jtrangeo.2020.102876.
- Christodoulou, A., and P. Christidis. 2020. “Bridges Across Borders: A Clustering Approach to Support EU Regional Policy.” Journal of Transport Geography 83(February): 102666. doi:10.1016/j.jtrangeo.2020.102666.
- D’Costa, S., J. Garcilazo, and J. Oliveira Martins. 2019. “Impact of Macro-Structural Reforms on the Productivity Growth of Regions: Distance to the Frontier Matters.” Papers in Regional Science 98 (1): 133–166. doi:10.1111/pirs.12346.
- Cuaresma, J., G. Doppelhofer, and M. Feldkircher. 2014. “The Determinants of Economic Growth in European Regions.” Regional Studies 48 (1): 44–67. doi:10.1080/00343404.2012.678824.
- Decressin, J., and A. Fatás. 1995. “Regional Labor Market Dynamics in Europe.” European Economic Review 39 (9): 1627–1655. doi:10.1016/0014-2921(94)00102-2.
- Durand, F., and A. Decoville. 2020. “A Multidimensional Measurement of the Integration Between European Border Regions.” Journal of European Integration 42 (2): 163–178. doi:10.1080/07036337.2019.1657857.
- Elhorst, J. 2010. “Applied Spatial Econometrics: Raising the Bar.” Spatial Economic Analysis 5 (1): 9–28. doi:10.1080/17421770903541772
- European Commission. 2021. Interreg: European Territorial Co-operation. https://interreg.eu/
- Feliu, E., C. Tapia, I. Viloria, M. Zaldua, W. Jung, D. Engelke, A. Putlitz, et al. 2013. Using Applied Research Results From ESPON as a Yardstick for Cross-Border Spatial Development Planning: Final Report. https://www.espon.eu/sites/default/files/attachments/Ulysses_Final_Report_2013_01_25.pdf
- Fernández, A., and L. Trigal. 2017. “Prólogo.” Polígonos, Revista de Geografía 29: 5–9. doi:10.18002/pol.v0i29.5198
- Gelman, A., J. Carlin, H. Stern, D. Dunson, A. Vehtari, and D. Rubin. 2013. “Bayesian Data Analysis.” Chapman and Hall/CRC. doi:10.1201/b16018.
- Geppert, K., and A. Stephan. 2008. “Regional Disparities in the European Union: Convergence and Agglomeration.” Papers in Regional Science 87 (2): 193–217. doi:10.1111/j.1435-5957.2007.00161.x.
- Geweke, J. 1993. “Bayesian Treatment of the Independent Student-t Linear Model.” Journal of Applied Econometrics 8 (S1): S19–S40. doi:10.1002/jae.3950080504.
- Goecke, H., and M. Hüther. 2016. “Regional Convergence in Europe.” Intereconomics 51 (3): 165–171. doi:10.1007/s10272-016-0595-x.
- González-Gómez, T., and E. Gualda. 2020. “Disclosing the Relational Structure of Institutional Cross-Border Cooperation in Two Cross-Border Regions in Europe.” Journal of Borderlands Studies 35 (1): 113–129. doi:10.1080/08865655.2017.1399810.
- Grillitsch, M., M. Martynovich, R. Fitjar, and S. Haus-Reve. 2021. “The Black Box of Regional Growth.” Journal of Geographical Systems 23 (3): 425–464. doi:10.1007/s10109-020-00341-3.
- Haase, D., A. Haase, and D. Rink. 2014. “Conceptualizing the Nexus Between Urban Shrinkage and Ecosystem Services.” Landscape and Urban Planning 132: 159–169. doi:10.1016/j.landurbplan.2014.09.003.
- Hansen, N. 1977. “The Economic Development of Border Regions.” Growth and Change 8: 2–8. doi:10.1111/j.1468-2257.1977.tb00343.x.
- Harris, R. 2011. “Models of Regional Growth: Past, Present and Future.” Journal of Economic Surveys 25 (5): 913–951. doi:10.1111/j.1467-6419.2010.00630.x.
- Harris, R., J. Moffat, and V. Kravtsova. 2011. “In Search of ‘W’.” Spatial Economic Analysis 6 (3): 249–270. doi:10.1080/17421772.2011.586721.
- Headey, D., and A. Hodge. 2009. “The Effect of Population Growth on Economic Growth: A Meta-Regression Analysis of the Macroeconomic Literature.” Population and Development Review 35 (2): 221–248. doi:10.1111/j.1728-4457.2009.00274.x.
- INTERREG Portugal-Spain. 2022. INTERREG Portugal-Spain. https://www.poctep.eu/en
- Jaroszewska, E. 2019. “Urban Shrinkage and Regeneration of an Old Industrial City: The Case of Wałbrzych in Poland.” Quaestiones Geographicae 38 (2): 75–90. doi:10.2478/quageo-2019-0023.
- Johansson, M., P. Nilsson, and H. Westlund. 2018. “Migration and Ageing in Expanding and Shrinking European Regions.” In Modelling Aging and Migration Effects on Spatial Labor Markets, edited by R. R. Stough, K. Kourtit, P. Nijkamp, and U. Blien, 107–131. Cham: Springer. doi:10.1007/978-3-319-68563-2_7.
- Johnson, M., J. Hollander, and A. Hallulli. 2014. “Maintain, Demolish, Re-purpose: Policy Design for Vacant Land Management Using Decision Models.” Cities 40: 151–162. doi:10.1016/j.cities.2013.05.005
- Kallioras, D., P. Artelaris, L. Topaloglou, and M. Tsiapa. 2011. Detecting the Growth Pattern (s) of the EU Border Regions: A Convergence Clubs Approach. ERSA Conference Papers, April 2014.
- Kilroy, A., and R. Ganau. 2020. Economic Growth in European Union NUTS-3 Regions (No. 9494; Policy Research Working Paper). World Bank, Washington, DC.
- LeSage, J., and R. Pace. 2009. Introduction to Spatial Econometrics. New York: Chapman and Hall/CRC.
- Lopes, J., and T. Araújo. 2016. “Geographic and Demographic Determinants of Regional Growth and Convergence: A Network Approach.” Revista Portuguesa de Estudos Regionais 43 (1): 35–49.
- Mankiw, N., D. Romer, and D. Weil. 1992. “A Contribution to the Empirics of Economic Growth.” The Quarterly Journal of Economics 107 (2): 407–437. doi:10.2307/2118477
- Mantegazzi, D., P. McCann, and V. Venhorst. 2020. “The Impact of Language Borders on the Spatial Decay of Agglomeration and Competition Spillovers.” Journal of Regional Science 60 (3): 558–577. doi:10.1111/jors.12464.
- Medeiros, E. 2007. 16 anos de cooperação transfronteiriça no âmbito do INTERREG-A. Actas Do III Congresso de Estudos Rurais (III CER), Universidade Do Algarve, Faro.
- Medeiros, E. 2010. “Old vs Recent Cross-Border Cooperation: Portugal-Spain and Norway-Sweden.” Area 42 (4): 434–443. doi:10.1111/j.1475-4762.2010.00940.x.
- Medeiros, E., and P. Neto. 2021. “Border Cities in Portugal–Spain and Territorial Development Trends.” In Border Cities and Territorial Development, edited by E. Medeiros, 190–208. New York: Routledge. doi:10.4324/9781003164753-14
- Mohl, P., and T. Hagen. 2010. “Do EU Structural Funds Promote Regional Growth? New Evidence from Various Panel Data Approaches.” Regional Science and Urban Economics 40 (5): 353–365. doi:10.1016/j.regsciurbeco.2010.03.005.
- Monfort, P. 2008. Convergence of EU Regions: Measures and Evolution. Directorate-General for Regional Policy Working Paper 1, 1–20.
- Monfort, P. 2020. Convergence of EU Regions Redux: Recent Trends in Regional Disparities (2/2020; Directorate-General for Regional and Urban Policy Working Paper). Publications Office, 1–25. doi:10.2776/27556.
- Monfort, M., J. Cuestas, and J. Ordóñez. 2013. “Real Convergence in Europe: A Cluster Analysis.” Economic Modelling 33: 689–694. doi:10.1016/j.econmod.2013.05.015.
- Navarro, L., and H. Pereira. 2015. Rewilding Abandoned Landscapes in Europe. In Springer (Ed.), Rewilding European Landscapes (pp. 3–23). https://www.oapen.org/download?type = document&docid = 1001892#page = 21
- Perkmann, M. 2003. “Cross-Border Regions in Europe.” European Urban and Regional Studies 10 (2): 153–171. doi:10.1177/0969776403010002004.
- Pérez-Nieto, E. 2016. “Centralization as a Barrier to Cross-Border Cooperation? Some Preliminary Notes from an Iberian Approach.” Journal of Borderlands Studies 31 (4): 481–495. doi:10.1080/08865655.2016.1174597.
- Pietrzykowski, M. 2019. “Convergence in GDP per Capita Across the EU Regions – Spatial Effects.” Economics and Business Review 5 (2): 64–85. doi:10.18559/ebr.2019.2.4.
- Postiglione, P., A. Cartone, and D. Panzera. 2020. “Economic Convergence in EU NUTS 3 Regions: A Spatial Econometric Perspective.” Sustainability 12, doi:10.3390/SU12176717.
- Proto, P. 2008. Survey on Euroregions and EGTC: What Future for the Adriatic Area. Geraadpleegd Op http://www.Cespi.It/WP/WP45-Euroregioni_Gect_Proto_en.Pdf
- Pupier, P. 2020. “Spatial Evolution of Cross-Border Regions. Contrasted Case Studies in North-West Europe.” European Planning Studies 28 (1): 81–104. doi:10.1080/09654313.2019.1623975.
- Ratti, R., and S. Reichman. 1993. Theory and Practice of Transborder Cooperation. Basel: Helbing & Lichtenhahn.
- Reitel, B., B. Wassenberg, and J. Peyrony. 2018. “The INTERREG Experience in Bridging European Territories. A 30-Year Summary.” In Urban Book Series, edited by Eduardo Medeiros, 7–23. Springer International Publishing. doi:10.1007/978-3-319-74887-0_2
- Rey, S., and B. Dev. 2006. “σ-Convergence in the Presence of Spatial Effects.” Papers in Regional Science 85 (2): 217–234. doi:10.1111/j.1435-5957.2006.00083.x.
- Rey, S., and M. Janikas. 2005. “Regional Convergence, Inequality, and Space.” Journal of Economic Geography 5 (2): 155–176. doi:10.1093/JNLECG/LBH044.
- Rey, S., W. Kang, and L. Wolf. 2019. “Regional Inequality Dynamics, Stochastic Dominance, and Spatial Dependence.” Papers in Regional Science 98 (2): 861–881. doi:10.1111/pirs.12393.
- Ricq, C. 2006. Handbook of Transfrontier Co-Operation. Strasbourg: Council of Europe Publishing. (2006 Edition).
- Rietveld, P. 2012. “Barrier Effects of Borders: Implications for Border-Crossing Infrastructures.” European Journal of Transport and Infrastructure Research 12 (2): 150–166. doi:10.18757/ejtir.2012.12.2.2959.
- Rietveld, P., and R. Stough. 2005. “Institutional Dimensions of Cross-Border Transport.” IATSS Research 29 (2): 6–8. doi:10.1016/s0386-1112(14)60127-8.
- Rivera, P., and F. Vázquez. 2018. “Institutional Aspects of Portugal-Spain Cross-Border Cooperation.” Journal of Borderlands Studies 33 (4): 585–604. doi:10.1080/08865655.2016.1267588.
- Sala-I-Martin, X. 1996. “Regional Cohesion: Evidence and Theories of Regional Growth and Convergence.” European Economic Review 40 (6): 1325–1352. doi:10.1016/0014-2921(95)00029-1.
- Sala-i-Martin, X., and R. Barro. 1991. “Convergence Across States and Regions.” Brookings Papers on Economic Activity 1991(1): 107–182.
- Tobler, W. 1970. “A Computer Movie Simulating Urban Growth in the Detroit Region.” Economic Geography 46: 234–240. doi:10.2307/143141.
- Tobler, W. 2004. “On the First Law of Geography: A Reply.” Annals of the Association of American Geographers 94 (2): 304–310. doi:10.1111/j.1467-8306.2004.09402009.x.
- Trigal, L. 2005. La Raya Ibérica como espacio de atracción y cooperación. In La Raya Ibérica: centro-sur No. 21 (pp. 3–14). Papeles de Economia Epañola, Economia de las comunidades autónomas, fundación de las cajas de ahorros.
- Trillo-Santamaría, J. 2014. “Cross-Border Regions: The Gap Between the Elite’s Projects and People’s Awareness. Reflections from the Galicia-North Portugal Euroregion.” Journal of Borderlands Studies 29 (2): 257–273. doi:10.1080/08865655.2014.915704.
- Tripathi, D. 2015. “Interrogating Linkages Between Borders, Regions, and Border Studies.” Journal of Borderlands Studies 30 (2): 189–201. doi:10.1080/08865655.2015.1042010.
- van den Broek, J., P. Benneworth, and R. Rutten. 2018. “Border Blocking Effects in Collaborative Firm Innovation.” European Planning Studies 26 (7): 1330–1346. doi:10.1080/09654313.2018.1476470.
- van Geenhuizen, M., and P. Rietveld. 2002. “Land-Borders and Sea-Borders: An Exploration of Differences in Border Region Development.” Journal of Borderlands Studies 17 (2): 63–77. doi:10.1080/08865655.2002.9695591.
- van Gorp, N. 2009. “Backwardness of Border Regions.” Tijdschrift Voor Economische En Sociale Geografie 100 (3): 358–364. doi:10.1111/j.1467-9663.2009.00544.x.
- Vázquez, F. J. C. 2015. “Repasando la frontera hispano-portuguesa: Conflito, interacción y cooperación transfronteriza.” Estudios Fronterizos 16 (31): 65–89.
- Viegas, M., and M. Antunes. 2013. “Convergence in the Spanish and Portuguese NUTS 3 Regions: An Exploratory Spatial Approach.” Intereconomics 48 (1): 59–66. doi:10.1007/s10272-013-0445-z.
- Vulevic, A., R. Castanho, J. Gómez, L. Loures, J. Cabezas, L. Fernández-Pozo, and J. Gallardo. 2020. “Accessibility Dynamics and Regional Cross-Border Cooperation (CBC) Perspectives in the Portuguese—Spanish Borderland.” Sustainability 12, doi:10.3390/su12051978.
- Vuong, Q. 1989. “Likelihood Ratio Tests for Model Selection and Non-Nested Hypotheses.” Econometrica 57 (2): 307–333. doi:10.2307/1912557.
- Weidenfeld, A., P. Björk, and A. Williams. 2016. “Cognitive and Cultural Proximity Between Service Managers and Customers in Cross-Border Regions: Knowledge Transfer Implications.” Scandinavian Journal of Hospitality and Tourism 16: 66–86. doi:10.1080/15022250.2016.1244587.
- Wesley, E., and F. Peterson. 2017. “The Role of Population in Economic Growth.” SAGE Open 7 (4): 1–15. doi:10.1177/2158244017736094.
- Wolff, M., and T. Wiechmann. 2018. “Urban Growth and Decline: Europe’s Shrinking Cities in a Comparative Perspective 1990–2010.” European Urban and Regional Studies 25 (2): 122–139. doi:10.1177/0969776417694680.
- Young, A., M. Higgins, and D. Levy. 2008. “Sigma Convergence Versus Beta Convergence: Evidence from U.S. County-Level Data.” Journal of Money, Credit and Banking 40 (5): 1083–1093. doi:10.1111/j.1538-4616.2008.00148.x.