
ABSTRACT
The study aimed to analyse serum haptoglobin concentrations by calving number and lactation phase in clinically healthy dairy cattle and to determine the correlation between concentrations in serum and milk samples. For this purpose, serum samples were collected from 228 clinically healthy cows after milking from 14 randomly selected herds. Additionally, milk samples were collected from 80 out of the 228 cows from the milking prior to blood collection. Both serum and milk samples were analysed with a commercial ELISA test. The effect of the calving number and lactation phase on mean serum haptoglobin concentrations was examined by Kruskal–Wallis/Jonckheere–Terpstra tests. After that, in a multivariate approach, a mixed-effects linear model was also performed. In addition, intraclass correlation coefficients were used to evaluate the correlation between concentrations in serum and milk samples. Results indicated a downward trend in haptoglobin concentrations throughout lactation, that was statistically significant when comparing fresh cows with the remaining lactation phases. The higher haptoglobin concentrations in fresh cows could be the result of inflammatory illnesses without clinical disease, stress or variations within the physiological state. Although previous studies showed some discrepancies, a good correlation between serum and milk concentrations has been observed in the present paper.
1. Introduction
Acute phase proteins (APP) are plasma proteins, mainly synthesized in the liver which are stimulated by inflammatory mediators. They include C-reactive protein, α1-acid glycoprotein, haptoglobin (Hp), mannose-binding protein, fibrinogen, α1-antitrypsin, and complement components C3 and C4. Thereby, the APPs are a heterogeneous group of proteins with different roles, but they are mainly related to immunoglobulin production and tissue repair (Kent Citation1992). From a diagnostic point of view, APPs can be measured to detect situations triggering an inflammatory response (an acute phase response) and, therefore, they were proposed as general markers for animal health and welfare (Gómez-Laguna et al. Citation2011).
In the particular case of cattle, Hp has been considered one of the most specific APPs (Chan et al. Citation2004). Hp increases over 100-fold at the onset of an inflammation event (Kerwin and Overton Citation2020). Consequently, the quantification of Hp has been widely used to assess a variety of inflammatory processes.
In dairy cattle, variations of Hp concentrations with dystocia, puerperal metritis, retained placenta or periparturient metabolic stress (determined by elevated β-hydroxybutyrate levels) have been documented (Huzzey et al. Citation2009; Pohl et al. Citation2015). Huzzey et al. (Citation2009) even indicated that Hp screening may assist in the early detection of metritis, providing increased opportunities for early treatment and prevention. Some authors argue that, during the postpartum period, there is a relationship between Hp concentration and different blood markers, such as non-esterified fatty acids (NEFA), which can serve as support to have an indication of the nutritional and health status of dairy cows (Galvao et al. Citation2010; Pohl et al. Citation2015; Kaya et al. Citation2016).
Different previous studies observed a decrease in milk production and reproductive performance in dairy cows during the postpartum period, which were related to circulating levels of Hp (Huzzey et al. Citation2015; Shin et al. Citation2018).
Additionally, the measurement of Hp has been suggested as a reliable method to detect animals with subclinical or clinical mastitis, although milk amyloid A seemed to be a more sensitive factor for diagnosis of subclinical mastitis (Haghkhah et al. Citation2010; Wollowski et al. Citation2021). In cattle, increases in Hp concentration have also been examined in conditions such as lameness, foot and mouth disease, respiratory disease, or even bovine viral diarrhoea virus persistent infections (Smith et al. Citation2010; Ulutas et al. Citation2011; Merhan et al. Citation2017; Joshi et al. Citation2018).
Moreover, Hp, as well as other APPs, have been proposed as markers of stress in cattle and other species. Seva et al. (Citation2007) concluded that, in stress situations, fighting cattle showed plasma Hp levels higher than normal and, hence, this APP could be used as an indicator of the level of stress suffered by the animal. Shipment of pigs and lambs can also lead to an Hp response that can be related to the stress of transport (Piñeiro et al. Citation2007; Tadich et al. Citation2009). APP could contribute to evaluate welfare problems related to transport (Saco et al. Citation2003).
Most previous studies analysing Hp levels in different conditions have used serum samples; however, individual, composite and bulk tank milk samples have also been analysed on occasion (alone or in combination with serum samples), essentially for bovine mastitis related studies (Grönlund et al. Citation2005; Åkerstedt et al. Citation2007; Haghkhah et al. Citation2010). However, few studies have specifically addressed the correlation of Hp concentrations in both types of samples (serum and milk).
The aim of the present study was to characterize serum Hp concentrations by calving number and lactation phase in clinically healthy dairy cattle and to determine the correlation between Hp concentrations in serum and milk samples.
2. Materials and methods
2.1. Area description and herds surveyed
The study was conducted in Galicia (north-west Spain) during 2020 and 2021. Galicia is the main dairy cattle area of the country, accounting for 55% of farms and 38% of milk production. The mean herd size per farm is 45 cows (lower than the national average of 60), and farms are still predominantly family-owned and managed. In Galicia, 35% of the herds are enrolled in the Dairy Herd Improvement Program (DHIP), which represents 72% of the milk produced in this region (AFRICOR Citation2020).
The data used in the study were obtained from 14 dairy farms (all of which are Holstein breed). They were selected by simple random sampling, among those included in the DHIP. The mean herd size (cows ≥1 year) in the studied farms was 74.2 (maximum of 147 and minimum of 65).
In these herds, blood samples were collected from 228 clinically healthy cows after morning milking. Clinically healthy status was defined based on complete clinical inspection, farmer survey, and DHIP data. Blood was collected by tail vein venipuncture into anticoagulant-free Vacutainer tubes. Additionally, milk samples were collected from 80 out of the 228 cows from the milking prior to blood collection.
From each cow, information on calving number and days in milk (DMI) at sampling were collected. Three categories were established according to calving number: (1) 1st parity cows, (2) 2nd parity and (3) 3rd or higher. According to DIM five categories were established: (1) fresh cow, from 0 to 30 DIM, (2) peak lactation, from 31 to 90 DIM, (3) mid lactation, 91–150 DIM, (4) late lactation, ≥151 DIM, and (5) dry cow.
2.2. Analyses
Both serum and milk samples were analysed with a commercial ELISA test (BIO K 328 – QuantELISA Bovine haptoglobin/sandwich, Bio-X Diagnostics, Belgium). This is a competitive ELISA kit for the quantitative determination of bovine Hp.
Analyses were performed following the recommendations and dilutions indicated by the manufacturer for serum and milk samples. The recommended dilution factors were 1/1000 for serum samples and 1/10 for milk samples; in the specific case of serum samples from animals with known inflammatory illnesses, a 3000-fold dilution factor would be recommended. After analysis, in order to calculate the Hp concentrations in the samples, calibration curves were determined by four-parameter regression. According to the test, Hp concentrations were expressed in ng/ml (the concentration of the standards ranged from 5.6 to 360 ng/ml).
2.3. Statistical tests
Data were analysed using SPSS 11.0 software (StataCorp., TX, USA).
The effect of calving number and DIM on mean serum Hp concentrations was examined by Kruskal–Wallis (K–W) and Jonckheere–Terpstra (J–T) tests, respectively. After that, in a multivariate approach, data were analysed by using a mixed-effects linear model. In the model, calving number and DIM were included as fixed effects. A term for interaction between these two variables was also incorporated. Herd was included as a random effect.
Otherwise, intraclass correlation coefficients (ICC) (absolute agreement and consistency) were used to assess the correlation between Hp concentration in serum and milk samples.
3. Results
Mean serum Hp concentrations by calving number (along with 95% confidence intervals) are provided in . Second parity animals were those that showed lower concentrations (9.57 vs. 12.34 ng/ml in 1st parity cows, and 15.47 ng/ml in 3rd parity and older cows). However, according to the K–W test, these differences were not significant (p = .756).
Table 1. Mean haptoglobin concentrations (ng/ml) in serum samples from dairy cows in Galicia (NW Spain) according to calving number and lactation phase.
In relation to DIM, data indicated a downward trend in Hp concentrations throughout lactation. Thereby, they decreased from 20.56 ng/ml in fresh cows to 10.11 ng/ml in late lactation cows (). According to the J–T test, this trend would not be significant either (p = .346). However, when comparing fresh cows (as mentioned, with a mean Hp serum concentration of 20.56 ng/ml) with the remaining groups (mean = 11.30 ng/ml), the differences were statistically significant (p = .024).
In line, the mixed model, including DIM as a binary variable (fresh cows vs. remaining groups) also indicated significant differences in Hp concentration (p = .019) (). In the model, calving number and the interaction term between calving number and lactation phase were not significant.
Table 2. Results of mixed-effects model for the effect of lactation number and lactation phase on mean haptoglobin concentrations (ng/ml) in serum samples from dairy cows in Galicia (NW Spain).
As regards the 80 cows in which serum and milk samples were collected, descriptive statistics for haptoglobin concentrations in each kind of sample category are shown in . The scatter plots showed a good correlation between serum and milk concentrations (). Thereby, ICC figures were 0.842 (consistency) and 0.844 (absolute agreement) (p < .001 for both coefficients).
Figure 1. Scatter plot of serum haptoglobin concentration (y-axis) and milk haptoglobin concentration (x-axis) (ng/ml), in 80 dairy cows from Galicia (NW Spain).
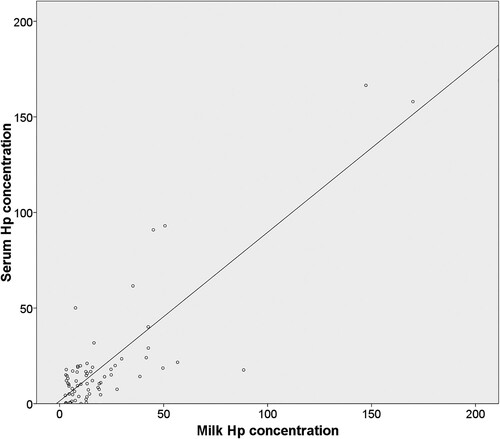
Table 3. Descriptive statistics for haptoglobin concentrations (ng/ml) by type of sample (serum/milk) from 80 dairy cows in Galicia (NW Spain).
4. Discussion
Hp, along with amyloid A, are the most widely studied APP in cattle. Hp has been consistently found to be a useful marker in case of infection, inflammation, trauma or stress. Moreover, APP, including Hp, are elevated more by acute rather than chronic inflammatory disorders, allowing to discriminate between both situations (Horadagoda et al. Citation1999).
The present study is based on the use of a commercial quantitative ELISA, using plates sensitized with monoclonal antibody directed specifically against bovine Hp. Currently, several commercial ELISA kits are available, being this the most frequently used test method since offers simplicity, convenience and accessibility (Morimatsu et al. Citation1992).
Few previous studies have related Hp concentration to calving number. The present paper showed that the highest Hp concentrations are observed in third parity and older cows followed by first parity cows, but without observing significant differences. This finding was in accordance with other previous studies (Nazifi et al. Citation2008; Kalmus et al. Citation2013; Wollowski et al. Citation2021). Conversely, Thomas et al. (Citation2015) found a significant correlation between milk Hp and parity; likewise, they indicated that parity could be a confounding factor when diagnosing inflammatory illnesses (such as mastitis) using Hp. Moreover, another previous report indicated that healthy heifers (1st parity) had higher mean Hp than healthy mature cows (≥2nd parity) but only in week 1 after calving (Crawford et al. Citation2005). In the present study, the mixed model showed that the interaction term between calving number and DIM was not significant.
As regards DIM, our study showed that there is a downward trend in Hp concentrations throughout lactation, but differences were only significant when comparing fresh cows with the remaining lactation groups. Dębski et al. (Citation2016) and Premi et al. (Citation2021) found a similar trend in Hp concentrations, that could be associated with the lessening of the acute phase response occurring since early lactation phase.
The puerperium period of dairy cows is often characterized by inflammatory illnesses, frequently subclinical or with non-specific symptoms. Inflammation is the cause of impairment in liver function (not activity, which is, perhaps, higher), and perhaps of performance (milk yield and fertility) (Bertoni et al. Citation2008). Likewise, during the period before calving and few weeks after parturition cows suffer from stress-related problems, which could lead to higher Hp concentrations. This period is connected with environmental and management changes (i.e. milk parlour or social regrouping). Dębski et al. (Citation2016) suggested that not only inflammations but also physiological factors such as pregnancy, delivery and/or state of lactation may have a significant impact on APPs values in the blood plasma of dairy cows. In line, Hiss et al. (Citation2009) indicated that the concentration of serum Hp was affected by calving with low levels 4 weeks prepartum and elevated levels 1 week postpartum. Thereby, determining possible variations according to DIM would allow interpreting more accurately potential Hp increases that can occur in the different lactation phases.
The use of zeolites, such as clinoptilolite, may have improved energy status during early lactation and consequently decreased values of SAA and Hp during the postpartum period. Thus, cows could be less susceptible to bacterial infections and consequently the incidence of inflammation could be decreased (Folnožić et al. Citation2019).
Although previous studies have analysed Hp concentrations in both serum and milk samples, the correlation between the values obtained in the two types of samples has been less evaluated. In the present study, the correlation levels were good (using the dilutions recommended by the ELISA manufacturer), although Hp concentrations in milk tend to be slightly higher than in serum samples. Gračner et al. (Citation2006) found higher Hp concentrations in milk (compared to serum) in cows with mastitis, but slightly lower in healthy cows.
A previous report showed a weak (non-significant) positive correlation when comparing serum and milk Hp concentrations in healthy cattle. The correlation between serum and milk concentrations was even negative in some inflammatory illnesses, notably in subclinical mastitis (Khoshvaghti et al. Citation2009). Thus, although they conclude that serum and milk Hp are sensitive factors for the diagnosis of inflammatory illnesses in cattle, the correlation between the concentration obtained in both samples seems to be poor. Previously, Nielsen et al. (Citation2004), also indicated no correlation between Hp concentrations in serum and milk in healthy cows, cows with clinical mastitis and cows with extramammary inflammatory illnesses. On the contrary, a significant moderate positive correlation was observed in other former reports (Eckersall et al. Citation2001; Hiss et al. Citation2009).
Although Hp is mainly synthesized in the liver, local production within the mammary gland has also been described (Hiss et al. Citation2004). The same study supported a very close link between mastitis and Hp synthesis in mammary tissue and indicates that Hp detectable in milk not only originates from circulation. The lack of correlation between milk and serum levels observed in some studies has been attributed to this synthesis in the mammary gland, basically in the case of animals with intramammary infection. Hp acts in plasma picking free haemoglobin but also has antioxidant activities and this may be an important function in milk (Lim et al. Citation2000). Additionally, there have been previous reports of the potential production of Hp during the acute phase response in other extrahepatic tissues such as lung (Yang et al. Citation1995) or endometrium (Sharpe-Timms et al. Citation1998); although secretion from these two tissues have not been confirmed in the case of cattle.
5. Conclusion
The present study agrees with most of the previous papers since no differences in Hp concentrations according to calving were found. In relation to the lactation phase, fresh cows seemed to show higher Hp concentrations that could be related to inflammatory illnesses in the absence of clinical disease, stress or variations within the physiological state. On the other hand, there seems to be discrepancies in previous research as regards the correlation between Hp concentrations in serum and milk samples, both in healthy cows and cows suffering from different pathologies; the correlations found in this study were high.
Acknowledgements
The authors thank the Lence (Leite Rio) and Innogando companies for their support. The many farmers who have contributed to this research and Fernando Rodríguez from the AFRICOR LUGO Association are thanked for their contributions.
Disclosure statement
No potential conflict of interest was reported by the author(s).
Additional information
Funding
References
- AFRICOR. 2020. Memoria Anual. [accessed 2022 March 1]. https://issuu.com/transmediacomunicacion/docs/africor_lugo_2020_completa.
- Åkerstedt M, Waller KP, Sternesjö Å. 2007. Haptoglobin and serum amyloid A in relation to the somatic cell count in quarter, cow composite and bulk tank milk samples. J Dairy Res. 74(2):198–203. doi:10.1017/S0022029906002305.
- Bertoni G, Trevisi ERM, Han X, Bionaz M. 2008. Effects of inflammatory conditions on liver activity in puerperium period and consequences for performance in dairy cows. J Dairy Sci. 91(9):3300–3310. doi:10.3168/jds.2008-0995.
- Chan JPW, Chu CC, Fung HP, Te Chuang S, Lin YC, Chu RM, Lee SL. 2004. Serum haptoglobin concentration in cattle. J Vet Med Sci. 66(1):43–46. doi:10.1292/jvms.66.43.
- Crawford RG, Leslie KE, Bagg R, Dick CP, Duffield TF. 2005. The impact of controlled release capsules of monensin on postcalving haptoglobin concentrations in dairy cattle. Can J Vet Res. 69(3):208–214.
- Dębski B, Nowicki T, Zalewski W, Ochota M, Mrowiec J, Twardoń J. 2016. Evaluation of acute phase proteins in clinically healthy dairy cows in perinatal period and during lactation. Pol J Vet Sci. 19(3):519–523. doi:10.1515/pjvs-2016-0065.
- Eckersall PD, Young FJ, McComb C, Hogarth CJ, Safi S, Weber A, McDonald T, Nolan AM, Fitzpatrick JL. 2001. Acute phase proteins in serum and milk from dairy cows with clinical mastitis. Vet Rec. 148(2):35–41. doi:10.1136/vr.148.2.35.
- Folnožić I, Samardžija M, Đuričić D, Vince S, Perkov S, Jelušić S, Valpotić H, Beer Ljubić B, Lojkić M, Gračner D, et al. 2019. Effects of in-feed clinoptilolite treatment on serum metabolic and antioxidative biomarkers and acute phase response in dairy cows during pregnancy and early lactation. Res Vet Sci. 127:57–64. doi:10.1016/j.rvsc.2019.10.010.
- Galvao KN, Flaminio MJBF, Brittin SB, Sper R, Fraga M, Caixeta L, Ricci A, Guard CL, Butler WR, Gilbert RO. 2010. Association between uterine disease and indicators of neutrophil and systemic energy status in lactating Holstein cows. J Dairy Sci. 93(7):2926–2937. doi:10.3168/jds.2009-2551.
- Gómez-Laguna J, Salguero FJ, Pallarés FJ, Rodríguez-Gómez IM, Barranco I, Carrasco L. 2011. Acute phase proteins as biomarkers in animal health and welfare. In: Veas F, editor. Acute phase proteins as early non-specific biomarkers of human and veterinary diseases. London: IntechOpen; p. 259–280.
- Gračner D, Bedrica L, Cergolj M, Harapin I, Samardžija M, Gračner GG, Žubčić D, Rešetić J, Fury M. 2006. Haptoglobinspielel in Blut und Milch von Kuhen mit einer Staphylokokkenmastitis. Tierärtzl Umschau. 61:636–641.
- Grönlund U, Sandgren CH, Waller KP. 2005. Haptoglobin and serum amyloid A in milk from dairy cows with chronic sub-clinical mastitis. Vet Res. 36(2):191–198. doi:10.1051/vetres:2004063.
- Haghkhah M, Nazifi S, Jahromi AG. 2010. Evaluation of milk haptoglobin and amyloid A in high producing dairy cattle with clinical and subclinical mastitis in Shiraz. Comp Clin Pathol. 19(6):547–552. doi:10.1007/s00580-009-0919-3.
- Hiss S, Mielenz M, Bruckmaier RM, Sauerwein H. 2004. Haptoglobin concentrations in blood and milk after endotoxin challenge and quantification of mammary Hp mRNA expression. J Dairy Sci. 87(11):3778–3784. doi:10.3168/jds.S0022-0302(04)73516-X.
- Hiss S, Weinkauf C, Hachenberg S, Sauerwein H. 2009. Relationship between metabolic status and the milk concentrations of haptoglobin and lactoferrin in dairy cows during early lactation. J Dairy Sci. 92(9):4439–4443. doi:10.3168/jds.2008-1632.
- Horadagoda NU, Knox KMG, Gibbs HA, Reid SWJ, Horadagoda A, Edwards SER, Eckersall PD. 1999. Acute phase proteins in cattle: discrimination between acute and chronic inflammation. Vet Rec. 144(16):437–444. doi:10.1136/vr.144.16.437.
- Huzzey JM, Duffield TF, LeBlanc SJ, Veira DM, Weary DM, von Keyserlingk MAG. 2009. Haptoglobin as an early indicator of metritis. J Dairy Sci. 92(2):621–625. doi:10.3168/jds.2008-1526.
- Huzzey JM, Mann S, Nydam DV, Grant RJ, Overton TR. 2015. Associations of peripartum markers of stress and inflammation with milk yield and reproductive performance in Holstein dairy cows. Prev Vet Med. 120(3-4):291–297. doi:10.1016/j.prevetmed.2015.04.011.
- Joshi V, Gupta VK, Bhanuprakash AG, Mandal RSK, Dimri U, Ajith Y. 2018. Haptoglobin and serum amyloid A as putative biomarker candidates of naturally occurring bovine respiratory disease in dairy calves. Microb Pathog. 116:33–37. doi:10.1016/j.micpath.2018.01.001.
- Kalmus P, Simojoki H, Pyörälä S, Taponen S, Holopainen J, Orro T. 2013. Milk haptoglobin, milk amyloid A, and N-acetyl-β-d-glucosaminidase activity in bovines with naturally occurring clinical mastitis diagnosed with a quantitative PCR test. J Dairy Sci. 96(6):3662–3670. doi:10.3168/jds.2012-6177.
- Kaya S, Kaçar C, Öğün M, Kuru MN, Özen HÇ, Demir M, Çahin L, Zonturlu AK. 2016. Evaluation of serum C-reactive protein and natural antibodies in cows with endometritis. Kafkas Univ Vet Fak Derg. 22(5):709–715.
- Kent JE. 1992. Acute phase proteins: their use in veterinary diagnosis. Br Vet J. 148(4):279–282. doi:10.1016/0007-1935(92)90081-B.
- Kerwin AL, Overton TR. 2020. Association between haptoglobin and cow and herd level outcomes. [accessed 2022 April 15]. https://ecommons.cornell.edu/bitstream/handle/1813/72895/Kerwin%2C%20Allison%20%28manuscript%29.pdf?sequence=2.
- Khoshvaghti A, Nazifi S, Vafafar A, Gheysari H. 2009. Evaluation of serum and milk haptoglobin in some inflammatory diseases of cattle. Int J Vet Res. 3(1):31–36.
- Lim YK, Jenner A, Ali AB, Wang Y, Hsu SI, Chong SM, Baumman H, Halliwell B, Lim SK. 2000. Haptoglobin reduces renal oxidative DNA and tissue damage during phenylhydrazine-induced hemolysis. Kidney Int. 58(3):1033–1044. doi:10.1046/j.1523-1755.2000.00261.x.
- Merhan O, Bozukluhan K, Kiziltepe S, Gokce HI. 2017. Investigation of levels of haptoglobin, serum amyloid A, ceruloplasmin and albumin in cattle with foot-and-mouth disease. Isr J Vet Med. 72:14–17.
- Morimatsu M, Sarikaputi M, Syuto B, Saito M, Yamamoto S, Naiki M. 1992. Bovine haptoglobin: single radial immunodiffusion assay of its polymeric forms and dramatic rise in acute-phase sera. Vet Immunol Immunopathol. 33(4):365–372. doi:10.1016/0165-2427(92)90007-D.
- Nazifi S, Rezakhani A, Koohimoghadam M, Ansari-Lari M, Esmailnezhad Z. 2008. Evaluation of serum haptoglobin in clinically healthy cattle and cattle with inflammatory diseases in Shiraz, a tropical area in southern Iran. Bulg J Vet Med. 11(2):95–101.
- Nielsen BH, Jacobsen S, Andersen PH, Niewold TA, Heegaard PM. 2004. Acute phase protein concentrations in serum and milk from healthy cows, cows with clinical mastitis and cows with extramammary inflammatory conditions. Vet Rec. 154(12):361–365. doi:10.1136/vr.154.12.361.
- Piñeiro M, Pineiro C, Carpintero R, Morales J, Campbell FM, Eckersall PD, Lampreave F. 2007. Characterisation of the pig acute phase protein response to road transport. Vet J. 173(3):669–674. doi:10.1016/j.tvjl.2006.02.006.
- Pohl A, Burfeind O, Heuwieser W. 2015. The associations between postpartum serum haptoglobin concentration and metabolic status, calving difficulties, retained fetal membranes, and metritis. J Dairy Sci. 98(7):4555–4551. doi:10.3168/jds.2014-9181.
- Premi M, Mezzetti M, Ferronato G, Barbato M, Piccioli Cappelli F, Minuti A, Trevisi E. 2021. Changes of plasma analytes reflecting metabolic adaptation to the different stages of the lactation cycle in healthy multiparous Holstein dairy cows raised in high-welfare conditions. Animals (Basel). 11(6):1714. doi:10.3390/ani11061714.
- Saco Y, Docampo MJ, Fabrega E, Manteca X, Diestre A, Lampreave F, Bassols A. 2003. Effect of transport stress on serum haptoglobin and Pig-MAP in pigs. Anim Welf. 12(3):403–409. doi:10.1017/S0962728600025896.
- Seva JI, Martínez JS, Martínez-Subiela S, Pallarés FJ, Cerón JJ. 2007. Haptoglobina como indicador de estrés en vacas de lidia. An Vet Murcia. 23:121–127.
- Sharpe-Timms KL, Piva M, Ricke EA, Surewicz K, Zhang YL, Zimmer RL. 1998. Endometriotic lesions synthesize and secrete a haptoglobin-like protein. Biol Reprod. 58(4):988–994. doi:10.1095/biolreprod58.4.988.
- Shin DH, Jeong JK, Choi IS, Moon SH, Lee SC, Kang HG, Park SB, Kim IH. 2018. Associations between serum haptoglobin concentration and peri-and postpartum disorders, milk yield, and reproductive performance in dairy cows. Livest Sci. 213:14–18. doi:10.1016/j.livsci.2018.04.015.
- Smith BI, Kauffold J, Sherman L. 2010. Serum haptoglobin concentrations in dairy cattle with lameness due to claw disorders. Vet J. 186(2):162–165. doi:10.1016/j.tvjl.2009.08.012.
- Tadich N, Gallo C, Brito ML, Broom DM. 2009. Effects of weaning and 48 h transport by road and ferry on some blood indicators of welfare in lambs. Livest Sci. 121(1):132–136. doi:10.1016/j.livsci.2008.06.001.
- Thomas FC, Waterston M, Hastie P, Parkin T, Haining H, Eckersall PD. 2015. The major acute phase proteins of bovine milk in a commercial dairy herd. BMC Vet Res. 11(1):1–10. doi:10.1186/s12917-015-0533-3.
- Ulutas B, Tan T, Ulutas PA, Bayramli G. 2011. Haptoglobin and serum amyloid A responses in cattle persistently infected with bovine viral diarrhea virus. Acta Sci Vet. 39(3):1–6.
- Wollowski L, Heuwieser W, Kossatz A, Addis MF, Puggioni GMG, Meriaux L, Bertulat S. 2021. The value of the biomarkers cathelicidin, milk amyloid A, and haptoglobin to diagnose and classify clinical and subclinical mastitis. J Dairy Sci. 104(2):2106–2122. doi:10.3168/jds.2020-18539.
- Yang F, Friedrichs WE, Navarijo-Ashbaugh AL, deGraffenried LA, Bowman BH, Coalson JJ. 1995. Cell-type-specific and inflammatory-induced expression of haptoglobin gene in lung. Lab Invest. 73(3):433–440.