
ABSTRACT
We modelled thermo-rheological perturbations, related to the emplacement of a magmatic body in the upper crust. This approach was considered relevant for the areas characterized by elevated surface heat flow and chiefly for the geothermal fields. The numerical conductive thermal model applied to the Larderello geothermal area in Tuscany, allowed to constrain size, depth and timing of emplacement of the pluton. We inferred that the emplacement of a magmatic body, at a minimum depth of 3 km, having a horizontal extension of 14 km and a maximum thickness of 8 km, can reasonably reproduce the observed regional surface heat flow anomaly of the Larderello area, when 300 (± 100) kyr are elapsed from the magma emplacement. Even assuming an incremental growth, the first magma injection should not be older than 1 ± 0.3 Ma.
Results of the thermal model were used to set up a rheological model and to simulate the drifting of the brittle-ductile transition during the cooling of the pluton. A comparison with the K-horizon profile, a prominent seismic reflector in the Larderello area, was then performed. It was found that the K-horizon approximately corresponds with the pluton roof and with the current location of the brittle-ductile transition.
1. Introduction
The surface heat flow is a key parameter for understanding the thermal conditions and processes acting at depth (Ranalli & Rybach, Citation2005). It results from various contributions such as (i) the heat flowing from the mantle into the crust, (ii) the radiogenic heat produced within the continental crust, (iii) tectonothermal events such as lithospheric thinning or thickening, (iv) surface and shallow crustal levels processes such as sedimentation, erosion, uplift, subsidence, paleoclimate T changes, fluid circulation and, finally, (v) the emplacement of igneous bodies in the upper crust (e.g., Della Vedova, Bellani, Pellis, & Squarci, Citation2001). The relationship between high surface heat flow areas and magma emplacement in the continental crust is well documented in the literature (Allis et al., Citation1995; Baldi et al., Citation1994; Cathles, Erendi, & Barrie, Citation1997; Gianelli, Manzella, & Puxeddu, Citation1997; Gupta, Citation1981; Reiter, Chamberlain, & Love, Citation2010; Stimac, Goff, & Wohletz, Citation1997, Citation2001). The increase of surface heat flow is particularly elevated when magma emplacement takes place at shallow depth (e.g., Stimac, Goff, & Goff, Citation2015). To quantify this effect, thermal modelling has been performed by considering both (i) conductive (Allis et al., Citation1995; Dalrymple et al., Citation1999; Rikitake, Citation1995; Stimac et al., Citation2001) and (ii) convective heat transfer (e.g., Dalrymple et al., Citation1999; Stimac et al., Citation2001). Norton & Knight (Citation1977) simulated cooling of a magmatic body emplaced at shallow depth and demonstrated that the resulting temperature field obtained with the two approaches is significantly different in zones located above the pluton roof but is comparable in zones located at the margin or in the surroundings of the pluton. On this basis, it could be reasonable to apply conductive models to geothermal areas if the objective is circumscribed to the simulation of the long wavelength thermal anomaly related to magma emplacement (Dalrymple et al., Citation1999). By reproducing the regional thermal anomaly is then possible to constrain size, depth and age of emplacement of the magmatic body. In this paper, we applied this approach to the well-known high heat flow area of Larderello in Tuscany. Here, the magmatic source, invoked in all studies, is still poorly defined, despite the importance of the related geothermal field, the most ancient in the world (e.g. Saccorotti et al., Citation2014).
A debatable feature of the Larderello area is the prominent seismic reflector, called K-horizon (e.g. Cameli, Dini, & Liotta, Citation1993), whose origin has not understood yet. For this reason, once defined the time-dependent thermal profiles of the area, a rheological model has been developed with the aim to provide a contribution to the interpretation of the K-horizon.
2. Relevant features of the Larderello geothermal area
The Larderello geothermal area () is located in the inner part of the Northern Apennines chain (southern Tuscany). This area, since early-middle Miocene, has been affected by extensional tectonics that produced a relevant lithospheric thinning and favoured the development of Neogene basins with dominant NW-SE orientation. Current thickness of crust and lithosphere are estimated at c. 23 km (e.g., Ponziani et al., Citation1995) and c. 40 km (e.g., Calcagnile & Panza, Citation1980), respectively. Moreover, this area was affected by magmatism, that migrated progressively eastwards, from Corsica (Sisco, 14 Ma) to the inner Tuscany (Mt. Amiata, 0.2 Ma), being responsible for the genesis of the acid intrusive bodies of Montecristo, Giglio and Elba Island and of the volcanic products of Capraia and Mt. Amiata (e.g., Dini, Gianelli, Puxeddu, & Ruggieri, Citation2005). According to Peccerillo (Citation2005), the origin of silicic magmatism in Tuscany is attributed to crustal anatexis.
Figure 1. Regional heat flow contour lines in southern Tuscany. Equidistance is 50 mWm−2 (modified after Batini, Brogi, Lazzarotto, Liotta, & Pandeli, Citation2003).
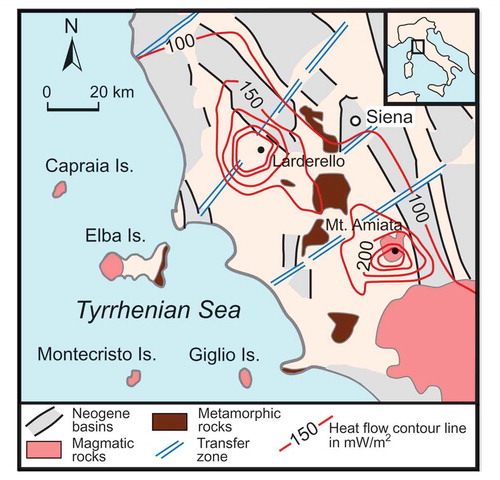
In the Larderello area, the local heat flow anomaly, dominated by convection, reaches a peak value in the order of 1000 mWm−2 (e.g., Bellani, Brogi, Lazzarotto, Liotta, & Ranalli, Citation2004). Instead, the regional long wavelength heat flow anomaly (), dominated by conduction, has a maximum in the order of 150–200 mWm−2 (e.g., Bellani, Magro, Brogi, Lazzarotto, & Liotta, Citation2005), well above the average value for a continental area of 65 mWm−2 (Pollack, Hurter, & Johnson, Citation1993). Hydrothermal circulation is responsible for the short wavelength thermal anomaly (Baldi et al., Citation1994; Magro, Bellani, & Della Vedova, Citation2009), whereas extensional tectonics and emplacement of magmas in the upper crust have the main influence on the long wavelength thermal anomaly (Baldi et al., Citation1994; Bellani et al., Citation2004). Both convective (Della Vedova, Vecellio, Bellani, & Tinivella Citation2008; Ebigbo et al., Citation2016; Magro et al., Citation2009; Romagnoli, Arias, Barelli, Cei, & Casini, Citation2010) and conductive (Calore, Celati, Gianelli, Norton, & Squarci, Citation1981; Mongelli, Palumbo, Puxeddu, Villa, & Zito, Citation1998) models have been proposed for this area.
This paper is focused on the interpretation of the regional heat flow anomaly and its relationship with the magmatic heat source. In the Larderello geothermal field, the heat source is attributed to shallow igneous intrusions, belonging to the Tuscan Magmatic Province (Gianelli, Citation2008, and references therein). The presence of a magmatic body is confirmed by most of the deep wells that reached granite intrusions (Dini et al., Citation2005; Villa & Puxeddu, Citation1994). However, despite the numberless studies on the Larderello area, there are still different opinions about the size, depth and age of emplacement of the magmatic heat sources underneath the geothermal field. Del Moro, Puxeddu, Radicati Di Brozolo, & Villa (Citation1982), attributed the origin of the geothermal field to the intrusion of a granitic body having an age older than 3.7 Ma and a depth of emplacement lower than 9 km. According to Villa & Puxeddu (Citation1994), the emplacement of the magma took place at depths ranging from 4 to 9 km and occurred at 4 Ma. Afterwards, the granitic body underwent a monotonic cooling, without evidence of ascent of multiple magmatic pulses. The still active geothermal anomalies are attributed to the predominance of slow conduction over fast convection heat transfer (Villa & Puxeddu, Citation1994). Mongelli et al. (Citation1998) built up a conductive model based on the cooling of a huge magmatic body in order to reproduce the temperatures observed in the wells of the geothermal field. Their results suggest that the last magma injection occurred at 0.3 Myr. According to Dini et al. (Citation2005), multiple intrusions of granitic magmas emplaced between 3.8 and 1.3 Myr, at depths ranging from 3 to 5 km. The geological cross-sections of Bertini, Casini, Gianelli, & Pandeli (Citation2006) show a convex-upward shape of a Quaternary granite, up to 20 km wide, emplaced at 3–4 km depth. Rossetti et al. (Citation2008), suggested that the pluton, in the Larderello area, is the result of the coalescence of multiple intrusions. During the growth, roof lifting provided the room for magma emplacement. More recently, Spinelli et al. (Citation2015) inferred that dated intrusions (see ) cannot be responsible for the active geothermal system, considering the short time (in the order of 10–100 kyr) sufficient to reach thermal equilibrium between the magmatic bodies and wall rocks. Santilano et al. (Citation2015) sustained that the shallow magmatic intrusion, underneath the Larderello geothermal system, should be more recent than 1 Myr. The same authors, in accordance with Spinelli et al. (Citation2015), attributed the thermal anomaly to the shallow emplacement of a very recent granitic magma body.
Table 1. Depth and age of the magmatic rocks cored in the Larderello area.
Regarding geophysical studies, seismic data revealed the presence of three low velocity zones below the Larderello area: two anomalies at depths of 4 and 7 km, with a width ranging from 5 to 10 km, and a third anomaly located at depths between 7 and 20 km (Gianelli et al., Citation1997, and references therein). Also, magnetotelluric surveys indicated the presence of a large conductive body at a depth of 5–6 km (Fiordelisi et al., Citation1995). Mongelli et al. (Citation1998), on the basis of tomographic studies of Foley, Toksoz, & Batini (Citation1992), suggested a cylindrical shape for the magmatic body, a width of 15–20 km and a height of 40 km.
Summing up, from the inspection of the literature on the Larderello area, it emerges that the magmatic heat source responsible for the thermal anomaly has a size not well defined and a depth of emplacement ranging between 3 and 9 km. Regarding the age, it comes up a dichotomy between geochronological dating (4–1.3 Myr) and thermal model results (< 1–0.3 Myr). In addition, both a single and a multiple intrusion of granitic magma have been proposed.
Another interesting feature of this area regards the so called ‘K-horizon’, a prominent seismic reflector (), regionally located at depths of 8–10 km, and showing an evident culmination in the Larderello and Mt. Amiata geothermal areas, where it reaches depths of 3–6 km (e.g. Cameli, Dini, & Liotta, Citation1998) (). The interpretation of this reflector is still controversial. For some authors, it represents the roof of a kinematically active shear zone, located at the top of the BD1 transition (Brogi, Lazzarotto, Liotta, Nicolich, & Ranalli, Citation2003; Cameli et al., Citation1998; Liotta & Ranalli, Citation1999). The strong contrast in acoustic impedance, causing the high amplitudes, could be explained by the presence of shear zones with mylonitic rocks (Batini, Duprat, & Nicolich, Citation1985b; Cameli et al., Citation1993) and very high pore fluid pressure (Brogi et al., Citation2003; Liotta & Ranalli, Citation1999). Also, based on deep boreholes, the depth of the K-horizon can be correlated with an isotherm in the range of 450 ± 50°C (Cameli et al., Citation1998; Liotta & Ranalli, Citation1999). According to other authors, the K-horizon could be related to the presence of a granitic body. In particular, Gianelli et al. (Citation1988), suggested that this reflector, in the Mt. Amiata geothermal area, could correspond to a fractured zone, with thermo-metamorphic minerals and fluids, at the top of an igneous body. According to Bertini et al. (Citation2006), the K-horizon, in the Larderello area, corresponds to the roof of a Quaternary granitic intrusion and related fractured contact rocks permeated by a supercritical fluid.
Figure 2. Line-drawing showing the profile of the K-horizon as deduced from the seismic section in the Larderello-Travale geothermal area (as reported in Batini et al., Citation2003).
Figure 3. Contour lines in kilometers (equidistance: 0.5 km) of the K-horizon depth (modified after Batini et al., Citation2003). The blue line is the trace of the K-horizon profile shown in –.
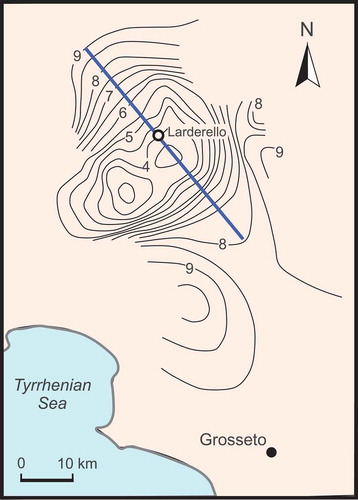
Figure 14. Rheological cross-sections at 300 kyr after the magma emplacement. The colour scale denotes Log10[strength, MPa]. The black line shows the location of the BD1 transition. The blue dots indicate the depth of the K-horizon along the profile, represented by the blue line in .
![Figure 14. Rheological cross-sections at 300 kyr after the magma emplacement. The colour scale denotes Log10[strength, MPa]. The black line shows the location of the BD1 transition. The blue dots indicate the depth of the K-horizon along the profile, represented by the blue line in Figure 3.](/cms/asset/e0904002-6673-46ba-a86c-c5be213ee1fa/tgda_a_1488912_f0014_oc.jpg)
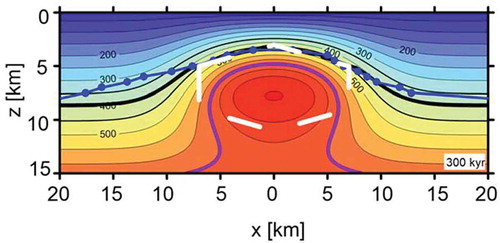
Figure 15. Temperature (°C) cross-section at 300 kyr after the magma emplacement. The white dashed line represents the boundary of the magmatic body. The black line shows the location of the BD1 transition obtained from the rheological calculations. The blue dots indicate the depth of the K-horizon along the profile represented by the blue line in .
3. Thermal model
A method to obtain information on the thermal and geometrical properties of the heat source in the Larderello area is the reproduction of the observed regional thermal anomaly and the comparison between model estimates and observed data (e.g. de Lorenzo, Di Renzo, Civetta, D’Antonio, & Gasparini, Citation2006). In this way, we can gauge extent, depth and age of magmatic body emplacement. We have constrained these parameters by using a trial and error approach, in order to fit the observed regional heat flow anomaly (150–200 mWm−2) along a NW-SE profile (). For this purpose, we set up a 2D numerical model to solve the following heat equation:
Figure 4. Heat flow contour map (mWm−2) in the Larderello geothermal field, modified after Magro et al. (Citation2009). The red line is the trace of the surface heat flow profile shown in (red dots).
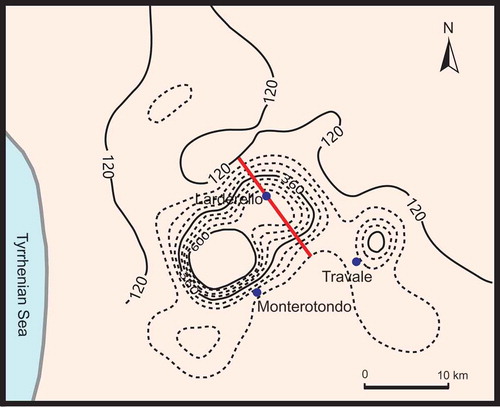
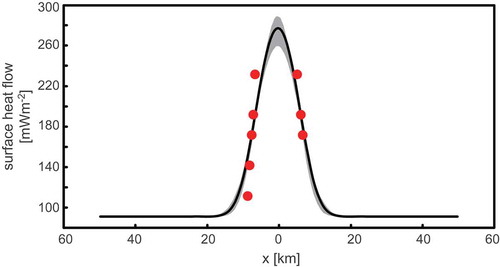
Figure 8. Comparison between observed (red dots) and model (black line) values at 300 kyr of surface heat flow along the profile indicated by the red line in . Heat flow range in the 200–400 kyr time interval is indicated in grey.
where is temperature;
is time;
and
are horizontal and vertical coordinates;
is thermal conductivity;
is rock density,
is specific heat at constant pressure and
is radiogenic heat production. The numerical solution to equation (1) has been obtained adopting the explicit solution to the finite difference problem (e.g., Anderson, Citation1995), using first order forward difference for the computation of the time derivative and second order central differences for the computation of the spatial derivatives. This approach allows the computation of the temperature at each grid point (i∆x, j∆z) (i = 1,…N; j = 1,…M), at the time step (k + 1) ∆t, if the temperature in the adjacent points, at the time k∆t is known. The time marching scheme is the following:
where is the thermal diffusivity,
and
are, respectively, the temperature and the internal heat generation in the grid points (
) at time step
. For the explicit approach, the value of
is chosen according to the following stability criterion (e.g., Becker & Kaus, Citation2016):
where and
indicate the node spacing in spatial direction
and
, respectively. In this case,
has been assumed.
The thermal conductivity is assumed equal to 2.0 W m−1°C−1. This represents the mean value of thermal conductivity in the earth’s crust (e.g., Kappelmeyer & Hänel, Citation1974). Even, considering a thermal dependence of thermal conductivity, the results in terms of size, depth and age of magmatic body are substantially unchanged. For this reason, we adopted the simplest configuration, assuming a constant thermal conductivity.
The initial geotherm has been computed by assuming T = 10°C at the surface (z = 0 km) and T = 900°C at the bottom of the crust (z = 23 km). The latter value is required for significant biotite dehydration melting in the lower crust (e.g., Bucher & Grapes, Citation2011). It was also assumed that the radiogenic heat production decreases exponentially with depth, according to the following expression (e.g., Lachenbruch, Citation1970):
where is the surface (z = 0) radioactive heat generation (3 μWm−3) and
is the scale length of radioactivity (15 km) (e.g., Turcotte & Schubert, Citation2014). In this way, the initial surface heat flow is equal to 100 mWm−2 ().
The contribution to the temperature field due to the latent heat of crystallization has been computed by using the approach proposed by Spear (Citation1993), according to the following equation:
where is the effective specific heat (2500 J kg−1°C−1),
is the true specific heat (1000 Jkg−1°C−1),
is the latent heat of crystallization equal to 300 kJ kg−1 and
is the temperature interval of magma crystallization (850–650°C) (e.g. Spear, Citation1993). A typical density value of 2750 kg m−3 has been assumed for the rocks in the crust.
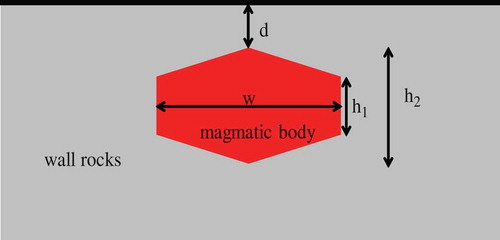
A simplified hexagonal shape has been adopted in order to approximate the geometry of a lenticular magmatic body (). This shape may be in agreement with a geological cross-section of Bertini et al. (Citation2006), at least for the roof of the intrusion. Since we have not insights about the lower part of the magmatic body, a symmetrical shape has been considered, that may be produced by mechanisms of roof lifting and floor depression (Cruden, Citation1998).
Figure 5. Schematic figure of the geometric shape used to approximate a lenticular magmatic body. The black arrowed lines indicate the size (w = width, h1 = lateral thickness, h2 = central thickness) and the depth (d) of the pluton constrained, from the surface heat flow data, through a trial and error approach (see later).
In order to model this shape, the discretization step is computed, after setting discretization step
and hexagon dimension, following this expression:
where is the slope of one side of the hexagon. In this way, the borders of the body cross the grid points, avoiding the calculation of their position through interpolation. In this case,
= 0.5 km and
= 0.14 km.
4. Rheological model
In order to obtain 2D strength profiles of the upper crust (down to a depth of 15 km) and to define the boundary between the brittle and ductile domains, we set up a rheological model following principles and methods described by Ranalli (Citation1995). In addition, in order to provide a contribution to the interpretation of the K-horizon, we compared the depth of this seismic reflector with depth of BD1 transition.
The brittle strength has been computed by using the Coulomb–Navier shear failure criterion (e.g. Liotta & Ranalli, Citation1999):
where and
are maximum and minimum principal stresses,
is the average rock density above depth z,
is the gravity,
is the pore fluid factor (ratio of fluid pressure to lithostatic pressure) and
is a dimensionless parameter depending on the predominant tectonic regime and on the friction coefficient of rocks. We assumed an extensional regime (
= 0.75; see Ranalli, Citation1995),
equal to 2750 kg m−3 and
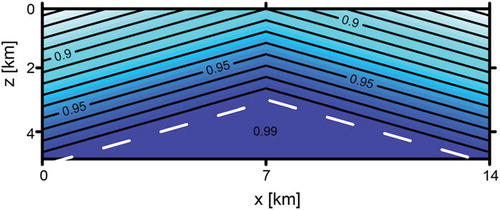
0.85 << 0.99 (see Liotta & Ranalli, Citation1999). In particular, in the country rocks located below and aside the magmatic body,
increases linearly from 0.85 (at z = 0 km) to 0.99 according to the following expression:
thus, is equal to 0.99 at z = 5 km and this value is kept constant down to 15 km. Instead, for the country rocks located above the magmatic body, we adopted an expression accounting for the dependence of
on both z and x. Therefore,
increases from 0.85 at the surface to 0.99 at the interface between the host rocks and the magmatic body, according to this equation:
This takes into account the increase with the approach to the pluton. Finally, a
equal to 0.99 has been adopted for the magmatic body ().
Figure 6. Schematic figure of the pore fluid factor () variation above the roof of the pluton (dashed white line).
The ductile strength has been computed using the power-law creep equation (e.g. Ranalli, Citation1995):
Where is the strain rate,
and
are the maximum and minimum principal stresses,
,
and
are the creep parameters,
is the gas constant and
is the absolute temperature. This equation can be expressed in terms of stress as:
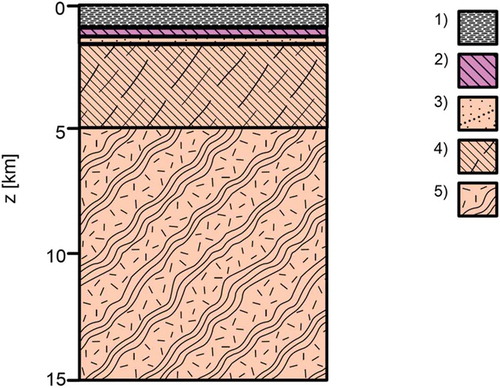
The 2D temperature field obtained from the previous thermal model is used to estimate the ductile strength in the upper crust. We adopted a schematic lithological section (), on the basis of the geological cross-sections through the Larderello geothermal area (e.g. Brogi & Liotta, Citation2006), assuming the flow law parameters listed in . A critical point concerns the choice of the strain rate parameter. In fact, considerably different values have been assumed or estimated in the past (e.g., Acocella & Rossetti, Citation2002; Dallmeyer & Liotta, Citation1998; Liotta & Ranalli, Citation1999), indicating the difficulty of constraining this parameter. For the purpose of our simplified model, we have assumed a value of 10−14 s−1, located in the middle of the range used for calculations by Liotta & Ranalli (Citation1999).
Table 2. Rheological parameters related to the lithological scheme of .
Figure 7. Schematic lithological section of the Larderello geothermal area adopted for the rheological model: 1) Argillite; 2) Evaporite; 3) Quartzite; 4) Phyllite; 5) Gneiss.
5. Results of the thermal model
Size, depth and age of emplacement of the heat source, responsible for the regional anomaly of the surface heat flow (150–200 mWm−2) in the Larderello area, have been calibrated using a trial and error approach. Theoretical estimates have been compared with values of the surface heat flow observed along the NW-SE profile reported in . After varying shape, size and depth of emplacement of the magmatic body, the preferred fitting was obtained with the following geometry of the heat source: a magmatic body having a flattened hexagonal shape in cross section; a thickness ranging from 8 km (at the centre) down to 4 km (at the border); a horizontal axis length of 14 km; a depth of the roof varying from a minimum of 3 km (at the centre) down to 5 km (at the border) (). The regional heat flow anomaly is reproduced, satisfactorily, when 300 (± 100) kyr are elapsed since the magma emplacement (). Instead, the peak value of the heat flow estimated by the model at the center of the regional anomaly (c. 300 mWm−2) turns out to be decidedly lower than the measured values, exceeding 500 mWm−2 (see ) and locally reaching the peak of c. 1000 mWm−2 (e.g., Bellani et al., Citation2004). This confirms that observed peak values above the pluton center reflect the dominant contribution of the convective heat transport (Norton & Knight, Citation1977). For this reason, our conductive model aims to reproduce values of the regional heat flow anomaly lower than 200 mWm−2, related to zones close to the margins of the magmatic body.
Once constrained shape, size and depth of the pluton, the thermal evolution has been simulated from the surface down to 15 km, with several snapshots () during a magma cooling history of 1.4 Myr. Melt-present conditions are assumed for the zones with temperatures exceeding 650°C outlined by the purple contour line (). In addition, values of the surface heat flow are provided at top of the contoured thermal sections.
Figure 9. Temperature (°C) cross-sections at various time steps after the magma emplacement. The white dashed line represents the boundary of the magmatic body. The purple line indicates the 650°C isotherm delimitating the melt-present zone. Model values of the surface heat flow (mWm−2) are also provided on the top of each cross-section (red arrows).
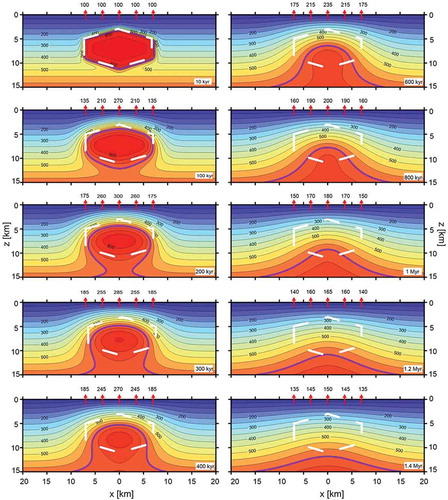
During the early thermal history (t < 200 kyr), the shallower part of the pluton is affected by a faster magma cooling with respect to zones close to the lateral margins. This reflects on the increase of the surface heat flow, quicker in the point located on the vertical axis of the pluton (max after 200 kyr) than in points located in correspondence of the pluton margins (max after 300 – 400 kyr). Closed contour lines are present up to 800 kyr. Then a slow depression and flattening of the isotherms reflects a relaxation towards a condition of thermal equilibrium. During the cooling history, the melt-present zone within the plutonic body progressively reduces and disappears at c. 1.2 Myr (). In detail, this can be observed in the diagram of a. Meanwhile, the upper front of the melt-present zone migrates from a minimum depth of 3 km to a depth of c. 11 km (b). Interestingly, contoured thermal sections show that the zone below the pluton bottom may be affected by a significant heating, able to trigger partial melting in quartz-feldspars-rich rocks in water-saturated conditions. As previously stated, the snapshot at t = 300 kyr represents the best fit to the observed regional surface heat flow anomaly and thus to the current state of the Larderello area. The model predicts that the pluton roof has a temperature of 450 – 500°C and that the melt-present zone, reduced to 65% in volume, is located at a minimum depth of c. 5 km.
Figure 10. Melt reduction in the plutonic body as resulting in the thermal model. (a) Reduction and disappearance of the melt-present zone (vol %) during the cooling history of the magmatic body. (b) Migration of the upper front of the melt-present zone, from 3 km (depth of magma emplacement) to c. 11 km (at t = 1.2 Myr after magma emplacement).
We computed the evolution of the geotherm in the continental crust, along a vertical profile passing through the top vertex of the magmatic body (a). It can be observed the thermal perturbation due to magma emplacement and the subsequent thermal relaxation, during the cooling history.
Figure 11. Diagrams illustrating the evolution of the transient geotherm and the variation of the surface heat flow reconstructed by the thermal model. (a) Evolution of the transient geotherm within the continental crust along a vertical profile passing through the top vertex of the magmatic body. The different colour lines indicate a specific time during the evolution of the transient geotherm. (b) Temporal variation of the surface heat flow calculated at the centre of the model anomaly.
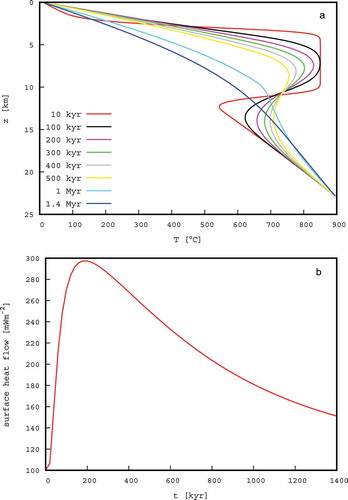
We computed, also, the temporal variation of the surface heat flow at the center of the model anomaly (b). It is important to note that the peak value is achieved 100–200 kyr after magma emplacement. The current situation is presumed to occur at 300 kyr after magma emplacement and corresponds to a phase of decreasing surface heat flow.
6. Results of the rheological model
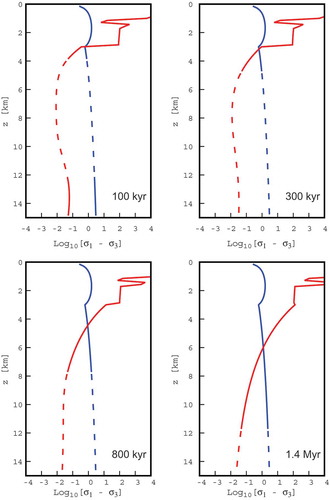
Brittle and ductile strength profiles, calculated with the rheological model, have been used to obtain rheological sections at different time steps. Results are shown in . In this figure, the BD1 transition is represented by the black curve joining the points where the difference between brittle and ductile strength is equal to 0. It can be observed a significant rheological evolution with time and an evident migration of the BD1 transition in proximity of the pluton. At t ≤ 300 kyr, the BD1 transition coincides with the roof of the pluton. During the magma cooling, the ductile strength increases and the BD1 transition deepens: at 800 kyr, it is within the magmatic body and at 1.4 Myr it tends to an equilibrium at a depth of c. 8.5 km. In , the crustal strength profiles, along a vertical line crossing the centre of the plutonic body (x = 0 km), are represented at the same time steps as the rheological cross sections of . The BD1 transition, corresponding to the intersection between brittle and ductile strength profiles, is indicated by the blue and red lines, respectively. The decrease of the strength in the brittle domain, after c. 1.8 km, is due to the increase of λ with the depth.
Figure 12. Rheological cross-sections at various time steps after the magma emplacement. The colour scale denotes Log10[strength, MPa]. The black line represents the location of the BD1 transition. The white dashed line outlines the boundary of the magmatic body. The letters B and D indicate the brittle and ductile domains, respectively.
![Figure 12. Rheological cross-sections at various time steps after the magma emplacement. The colour scale denotes Log10[strength, MPa]. The black line represents the location of the BD1 transition. The white dashed line outlines the boundary of the magmatic body. The letters B and D indicate the brittle and ductile domains, respectively.](/cms/asset/45c194da-f63f-47d7-af0b-28d164270a2a/tgda_a_1488912_f0012_oc.jpg)
Figure 13. 1D strength profiles, along a vertical line crossing the centre of the plutonic body (x = 0 km), at different time steps after the magma emplacement. The blue line represents the brittle strength calculated by equation (7) and the red line represents the ductile strength calculated by equation (11). The dashed parts are related to probable melt-present conditions (T > 650°C).
Comparing the BD1 transition profile with the K-horizon profile (), an acceptable correspondence can be observed when 300 kyr are elapsed from the magma emplacement. In particular, this is evident in proximity of the roof of the pluton and on its right side. Instead, by choosing lower λ values, ranging between 0.80 and 0.95, it is observed a better correspondence on the left side of the pluton. Another possible influence on the BD1 transition is linked to the strain rate value. Varying the exponent of the strain rate in the order of ± 1, with respect to the adopted value (10−14 s−1), the BD1 transition’s depth is approximately unchanged in correspondence of the pluton roof and it changes laterally, of c. ± 1.5 km.
Also, comparing the thermal section at 300 kyr with the K-horizon and BD1 transition profiles (), it can be observed that their depths, near the pluton roof, correspond broadly with the 450–500°C isotherms. Instead, on the pluton sides, the BD1 transition profile coincides with the 400°C isotherm. Finally, the K-horizon profile follows the 300–350°C isotherms on the left side and the 350–400°C isotherms on the right side of the magmatic body.
7. Discussion
The difficulty to understand the relationship between the magmatic bodies and geothermal systems has been underlined in several papers (Cathles et al., Citation1997; Erkan, Blackwell, & Leidig, Citation2005; Stimac et al., Citation2001). This can be particularly critical where evidence of volcanic activity is poor or absent, as in the Larderello area (Erkan et al., Citation2005; Mongelli et al., Citation1998). In our case, the magmatic heat source is not clearly defined: size, age and depth of emplacement of the magmatic body have not been constrained yet. The thermal model presented in this paper, despite the simplifications and the shortcomings to represent completely a geothermal system, may be useful to cover these gaps of knowledge. The choice of a purely conductive model can be allowed if the objective is the reproduction of the regional thermal anomaly due to the emplacement of a magmatic body in the upper crust. This approach has been adopted by Dalrymple et al. (Citation1999), for the case of the Geysers geothermal field.
Another simplification in the model is the assumption of the instantaneous magma emplacement, in contrast with the growing evidence that emplacement of medium to large magmatic bodies occurs incrementally (e.g. Annen, Citation2011). However, for the case of the Larderello area, geometric and chronological data on the plutonic body are too scanty to define realistically size and frequency of the magma increments. For this reason, an instantaneous emplacement represents a forced choice, that still can provide significant results for end-member conditions. The thermal evolution for a single intrusion depends, on size and shape of the pluton, magma and crust initial temperatures, depth of magma emplacement and thermal conductivity of the host rocks (Annen, Citation2011; Stimac et al., Citation2001). In our case, varying the size and depth of emplacement, all other factors being equal, the most important key parameter influencing the surface heat flow is the depth of emplacement of the magma body. In fact, the peak value of the regional thermal anomaly cannot be reproduced if the apex of the pluton roof is located at a depth exceeding 3 km. Stimac et al. (Citation2001), reached a similar conclusion in the study of the Clear Lake magmatic hydrothermal system (California, USA), finding a depth range of the pluton of 3–4 km, in order to reproduce the observed surface heat flow anomaly. Interestingly, the estimated depth of emplacement of the magmatic body, from 3 (top vertex) to 5 km (lateral vertices) is in agreement both with geological (Bertini et al., Citation2006; Dini et al., Citation2005), geophysical (Fiordelisi et al., Citation1995; Gianelli et al., Citation1997) and petrological (Gianelli, Citation1998) data available in literature. Regarding the size, the estimated horizontal axis length of the pluton (14 km) is in agreement both with the width proposed by Mongelli et al. (Citation1998), on the basis of the magnetotelluric data (Fiordelisi et al., Citation1995), and compatible with the dimension of the pluton deduced from the geological cross-sections published by Bertini et al. (Citation2006). The estimated age of emplacement of the magmatic body (300 kyr) is in agreement with the model estimates of Mongelli et al. (Citation1998) and Gola et al. (Citation2017) and turns out to be comparable with the age estimated for the volcanic activity of the neighbouring Mt. Amiata (Dini et al., Citation2005). However, it is decidedly lower than geochronologic dates (> 1 Myr) available for some intrusive rocks cored in exploratory wells in the Larderello geothermal field (see ). The discrepancy between geochronological dates and numerical model results was found by several authors (e.g., Cathles et al., Citation1997), for different geothermal areas in the world. It represents a critical point for a complete comprehension of the relationship between geothermal systems and heat sources. The problem cannot be solved by considering the effect of the convective heat transfer. In fact, in this case, a faster cooling of the magma body would be obtained and thus an even younger age of emplacement would be estimated. The same effect would have the implementation of a 3D model, implying a faster heat loss of the magmatic body than a 2D model. A chance to explain the age mismatch is provided by models based on the incremental emplacement of the magmatic body (Annen, Citation2011). By this way, it would be possible to reproduce a more persistent thermal anomaly. However, to avoid a drastic reduction of the simulated surface heat flow, the interval between single magmatic pulses should be contained below a critical value (e.g., 100 kyr; see later). For the same reason, an upward accretion of the magmatic body is preferred with a respect to a downward accretion. On the basis of these considerations, an incremental growth of the plutonic body was reproduced by a numerical model (see Langone, Caggianelli, Festa, & Prosser, Citation2014 for details). The adopted approach consisted in finding the maximum time interval between single magma pulses still compatible with the observed values of the regional surface heat flow anomaly. Indeed, if the time interval between single magma pulses is much greater than the solidification time of a single pulse, i.e. in case of slow pluton growth (Annen, Citation2011), the local thermal perturbation generates a negligible effect on the surface heat flow. In the absence of chronological and geometric data, the number of the magma increments, has been constrained by the need to preserve the melt-present conditions during the pluton growth and by the final size of the modelled magmatic body. Then, considering a pluton growth occurring in ten magma increments, it was obtained a maximum interval between single magma pulses of c. 100 kyr, that implies a pluton growth occurring in 1 Myr. By this way, the observed value of the surface heat flow, in correspondence of the pluton margins (average value of 170 mWm−2), can be still reproduced (). By increasing the time interval to 200 and 300 kyr and a pluton accretion completed in 2 Myr and 3 Myr, respectively, the peak of the surface heat flow progressively decreases being well below the observed reference value (see ). Therefore, by this approach the maximum age estimated for the start of the emplacement of the Larderello granite is of 1 ± 0.3 Myr, lower than most of the available geochronological dates. The only comparable value of 1.23 ± 0.13 Ma (see ) has been obtained by Villa, Ruggieri, & Puxeddu (Citation2001). On the basis of our results, the other magmatic rocks that provided ages older than 2 Myr cannot be considered responsible for the current thermal anomaly of the Larderello area. It is worth noting that, even considering an incremental growth, the observed heat flow is reproduced only in the final stages of pluton accretion. Then the results of both models (single and incremental emplacement) suggest recent last injections of magma, in the Larderello area. This result has important implications for understanding the geothermal field, because it demonstrates that although there have been various phases between 3.8 and 0.3 Ma in the area, we can consider that there is a relative continuity in this magmatic activity.
Figure 16. Variation of the surface heat flow with time, in correspondence of the pluton margin, according to the incremental growth model of the magmatic body, in case of a pluton construction in 1, 2 and 3 Myr. The horizontal dashed line indicates the corresponding value of the observed surface heat flow. Magma increments have volume increasing from c. 70 km3 up to a maximum of 250 km3 and then decreasing back to 70 km3.
If the pluton growth was accomplished in an interval of c. 1 Myr, an estimate of the rate of pluton construction can be made. Firstly, a volume of c. 2000 km3 can be calculated for the Larderello plutonic body, by considering the 2D section of the magmatic body assumed in the model and its probable extent in NE-SW direction (see ). It transpires that the pluton construction rate was of c. 2. x 10−3 km3yr−1. This value is compatible with data on duration and pluton construction rates compiled by De Saint Blanquat et al. (Citation2011), ranging between 10−1 and 10−4 km3yr−1. Nonetheless, further studies, dedicated to model more complex mechanisms of emplacement and growth of the Larderello granite, are needed for a full comprehension of the connection between the regional thermal anomaly and the magmatic heat source.
Regarding the debated interpretation of the K-horizon, despite the simplified assumptions involved in the estimation of the 2D strength profiles, the results show an acceptable correspondence between the BD1 transition and the K-horizon profile when 300 kyr are elapsed from the magma emplacement. This is compatible with the hypothesis that the K-horizon represents the top of the BD1 transition (e.g., Liotta & Ranalli, Citation1999). Comparing the thermal cross-section at 300 kyr with the K-horizon profile it results that it occurs at a temperature of c. 400 ± 100°C, in accordance with boreholes data showing that the seismic reflector follows approximately the 450 ± 50°C isotherm (e.g., Liotta & Ranalli, Citation1999). Moreover, from the evolution of 2D strength profiles of the upper crust, it emerges that the BD1 transition is time-dependent and that its pronounced culmination progressively fades out during magma cooling. Throughout this migration there is a time interval (up to 300 kyr) when it coincides with the pluton roof, conforming to the interpretation of the K-horizon provided by Bertini et al. (Citation2006) and more recently by Saccorotti et al. (Citation2014), on the basis of local earthquake tomography.
Therefore, from our results it emerges that the interpretations proposed of the K-horizon, i.e. (i) the top of the BD1 transition (e.g., Liotta & Ranalli, Citation1999) vs. (ii) the roof of the pluton (e.g. Bertini et al., Citation2006), are not necessarily in disagreement.
The presence of extensional shear zones in correspondence with the regional BD1 transition may have played an important role for the rising of granitic magma in the crust. It is worth noting that the link between extensional regime and syn- to late-tectonic plutonism has been suggested, also, for the emplacement of the Porto Azzurro pluton in the near Elba Island (Italy) (Smith, Holdsworth, & Collettini, Citation2011), which is considered as an analogue of the current Larderello geothermal field (e.g., Dini, Mazzarini, Musumeci, & Rocchi, Citation2008). The ascent of further magma above the regional BD1 transition, may be favoured by nontectonic processes, accommodating the space required for the pluton emplacement, like roof lifting (Acocella & Rossetti, Citation2002), which we retain could explain the upper shape of the modelized magmatic body. This scenario may be compatible with our results, indicating that the roof of the pluton coincides with the current position of the local BD1 transition. Nevertheless, specific studies are necessary for understanding the relationship between deformation and pluton emplacement in geothermal areas.
8. Concluding remarks
The proposed thermo-rheological model allowed us to constrain size, age and depth of emplacement of the magmatic heat source responsible for the regional heat flow anomaly of the Larderello area. In addition, rheological calculations provided information useful for the interpretation of the K-horizon, a seismic reflector of controversial interpretation.
The main results of the present study are summarized below:
The regional surface heat flow anomaly can be ascribed to the emplacement of an approximately biconvex magmatic body having a maximum thickness ranging from 8 km (at the centre) down to 4 km (at the border), a horizontal axis length of 14 km and a depth of the roof varying from a minimum of 3 km (at the centre) down to 5 km (at the border).
The anomaly is reproduced satisfactorily when 300 kyr are elapsed from the magma emplacement. At this time, the pluton roof has a temperature of 450–500°C, the melt- present zone reduced to 65% of the original volume and the upper magmatic front retreated to a minimum depth of c. 5 km.
The estimated age of 300 kyr is decidedly lower than the current geochronologic dates (> 1 Myr) of the Larderello intrusive rocks (Dini et al., Citation2005). Also considering an incremental emplacement of the magmatic body the age mismatch cannot be explained. A maximum of 1 ± 0.3 Ma is required for the start of the pluton growth. On this basis, it is sustained that magmatic rocks below the Larderello area, older than 1.3 Ma cannot be responsible for the current regional heat flow anomaly.
The pluton crystallization is completed in 1.2 Myr when the surface heat flow anomaly becomes negligible.
The X-Z mechanical strength profiles allowed to reconstruct the drifting of the BD1 transition during the cooling of the magmatic body.
The K-horizon profile is compatible with both the upper contact of the plutonic body and the BD1 transition, when 300 kyr are elapsed from the magma emplacement.
Finally, the performed study, although applied to a specific case, may provide interesting results for all the geothermal areas related to magma emplacement in the upper continental crust.
Acknowledgments
We are grateful and in debt with Giorgio Ranalli for showing the way to build up a thermo-rheological model. Discussions with Domenico Liotta were useful to set up the rheological model and to refine the interpretation of our results. Comments and suggestions by the editor Erdin Bozkurt and an anonymous reviewer helped to improve significantly the former version of the manuscript.
Disclosure statement
No potential conflict of interest was reported by the authors.
References
- Acocella, V., & Rossetti, F. (2002). The role of extensional tectonics at different crustal levels on granite ascent and emplacement: An example from Tuscany (Italy). Tectonophysics, 354, 71–83.
- Allis, R. G., Armstrong, P. A., & Funnel, R. H. (1995). Implications of a high heat flow anomaly around new plymouth, North Island, New Zealand. New Zealand Journal of Geology and Geophysics, 38, 121–130.
- Anderson, J. D. (1995). Computational fluid dynamics: the basics with applications (International ed). New York\Singapore: McGraw-Hill.
- Annen, C. (2011). Implications of incremental emplacement of magma bodies for magma differentiation, thermal aureole dimension and plutonism-volcanism relationships. Tectonophysics, 500, 3–10.
- Baldi, P., Bellani, S., Ceccarelli, A., Fiordelisi, A., Squarci, P., & Taffi, L. (1994). Correlazioni tra le anomalie termiche ed altri elementi geofisici e strutturali della Toscana meridionale. [Correlation between thermal anomalies and other geophysical and structural elements of the Southern Tuscany]. In Studi Geologici Camerti, Volume Speciale (1) (pp. 139–149). Istituto di Mineralogia e Geologia dell'Università di Camerino.
- Batini, F., Bertini, G., Gianelli, G., Pandeli, E., Puxeddu, M., & Villa, I. M. (1985a). Deep structure, age and evolution of the larderello-travale geothermal field. Geothermal Resource Council Transaction, 9, 253–259.
- Batini, F., Brogi, A., Lazzarotto, A., Liotta, D., & Pandeli, E. (2003). Geological features of larderello-travale and mt. amiata geothermal areas (southern Tuscany, Italy). Episodes, 6, 239–244.
- Batini, F., Duprat, A., & Nicolich, R. (1985b). Contribution of seismic reflection to the study of geothermal reservoirs in Tuscany (Italy). Geothermal Resources Council Transactions, 9, 245–252.
- Becker, T. W., & Kaus, B. J. P. (2016). Numerical modeling of earth systems, an introduction to computational methods with focus on solid earth applications of continuum mechanics. Lecture Notes for USC GEOL557, 1.1.4 (pp. 222).
- Bellani, S., Brogi, A., Lazzarotto, A., Liotta, D., & Ranalli, G. (2004). Heat flow, deep temperatures and extensional structures in the larderello geothermal field (Italy): Constraints on geothermal fluid flow. Journal of Volcanology and Geothermal Research, 132, 15–29.
- Bellani, S., Magro, G., Brogi, A., Lazzarotto, A., & Liotta, D. (2005) . Insights into the larderello geothermal field: structural setting and distribution of thermal and 3he anomalies. Proceedings World Geothermal Congress. Antalya, TR.
- Bertini, G., Casini, M., Gianelli, G., & Pandeli, E. (2006). Geological structure of a long-living geothermal system, Larderello, Italy. Terra Nova, 18, 163–169.
- Brogi, A., Lazzarotto, A., Liotta, D., Nicolich, R., & Ranalli, G. (2003). L’orizzonte K nella crosta dell’area geotermica di lardello (toscana meridionale). [the k-horizon in the crust of the larderello geothermal area (southern tuscany)]. Bollettino Della Società Geologica Italiana, 122, 103–116.
- Brogi, A., & Liotta, D. (2006). Understanding the crustal structures of southern tuscany: the contribution of the crop18 project. Bollettino Di Geofisica Teorica E Applicata, 47(3), 401–423.
- Bucher, K., & Grapes, R. (2011). Petrogenesis of Metamorphic Rocks. Verlag Berlin Heidelberg: Springer.
- Calcagnile, G., & Panza, G. F. (1980). The main characteristics of the lithosphere-asthenosphere system and surrounding regions. Pure and Applied Geophysics, 119, 865–879.
- Calore, C., Celati, R., Gianelli, G., Norton, D., & Squarci, P. (1981). Studi sull’origine del sistema geotermico di Larderello. [Studies about the origin of the Larderello geothermal system]. Proceeding 2nd Seminar of Finalized Energy Program, Geothermal Energy, Sub-Project, CNR, Rome (pp. 218–225).
- Cameli, G. M., Dini, I., & Liotta, D. (1993). Upper crustal structure of the Larderello geothermal field as a feature of post-collisional extensional tectonics (Southern Tuscany, Italy). Tectonophysics, 224, 413–423.
- Cameli, G. M., Dini, I., & Liotta, D. (1998). Brittle/ductile boundary from seismic reflection lines of southern Tuscany (Northern Apennines, Italy). Memorie Della Società Geologica Italiana, 52, 153–162.
- Cathles, L. M., Erendi, A. H. J., & Barrie, T. (1997). How long can a hydrothermal system be sustained by a single intrusive event?. Economic Geology, 92, 766–771.
- Cruden, A. R. (1998). On the emplacement of tabular granites. Journal of Geological Society London, 155, 853–862.
- Dallmeyer, R. D., & Liotta, D. (1998). Extension, uplift of rocks and cooling ages in thinned crustal provinces: The Larderello geothermal area (inner Northern Apennines, Italy). Geological Magazine, 135(2), 193–202.
- Dalrymple, G. B., Grove, M., Lovera, O. M., Harrison, T. M., Hulen, J. B., & Lanphere, M. A. (1999). Age and thermal history of the Geysers plutonic complex (felsite unit), Geysers geothermal field, California: A 40Ar/39Ar and U–Pb study. Earth and Planetary Science Letters, 173, 285–298.
- de Lorenzo, S., Di Renzo, V., Civetta, L., D’Antonio, M., & Gasparini, P. (2006). Thermal model of the Vesuvius magma chamber. Geophysical Research Letters, 33, L17302.
- De Saint Blanquat, M., Horsman, E., Habert, G., Morgan, S., Vanderhaeghe, O., Law, R., & Tikoff, B. (2011). Multiscale magmatic activity cyclicity, duration of pluton construction, and the paradoxical relationship between tectonism and plutonism in continental arcs. Tectonophysics, 500, 20–33.
- Del Moro, A., Puxeddu, M., Radicati Di Brozolo, F., & Villa, I. M. (1982). Rb-Sr and K-Ar Ages on Minerals at Temperatures of 300°-400° C from Deep Wells in the Larderello Geothermal Field (Italy). Contributions to Mineralogy and Petrology, 81, 340–349.
- Della Vedova, B., Bellani, S., Pellis, G., & Squarci, P. (2001). Anatomy of an orogen: The Apennines and Adjacent Mediterranean Basins. In G. B. Vai & I. P. Martini (Eds.), Deep temperature and surface heat flow distribution (pp. 65–76). Dordrecht: Springer.
- Della Vedova, B., Vecellio, C., Bellani, S., & Tinivella, U. (2008). Thermal modelling of the Larderello geothermal field (Tuscany, Italy). International Journal of Earth Sciences, 97, 317–332.
- Dini, A., Gianelli, G., Puxeddu, M., & Ruggieri, G. (2005). Origin and evolution of Pliocene-Pleistocene granites from the Larderello geothermal field (Tuscan Magmatic Province, Italy). Lithos, 81, 1–31.
- Dini, A., Mazzarini, F., Musumeci, G., & Rocchi, S. (2008). Multiple hydro-fracturing by boron-rich fluids in the Late Miocene contact aureole of eastern Elba Island (Tuscany, Italy). Terra Nova, 20, 318–326.
- Ebigbo, A., Niederau, J., Marquart, G., Dini, I., Thorwart, M., Rabbel, W., … Clauser, C. (2016). Influence of depth, temperature, and structure of a crustal heat source on the geothermal reservoirs of Tuscany: Numerical modelling and sensitivity study. Geothermal Energy, 4, 5.
- Erkan, K., Blackwell, D. D., & Leidig, M. (2005). Crustal thermal regime at the Geysers/Clear Lake area, California. Proceedings World Geothermal Congress. Antalya, TR.
- Fiordelisi, A., Mackie, R. L., Madden, T., Manzella, A., & Rieven, S. A. (1995). Application of the magnetotelluric method using a remote-remote refence system for characterizing deep geothermal system. In E. Barbier, G. Frye, E. Iglesias, & G. Palmasson (Eds). Proceedings Worlds Geothermal Congress, (pp. 893–897). Florence, IT.
- Foley, J. E., Toksoz, M. N., & Batini, F. (1992). Inversion of teleseismic travel time residuals for velocity structure in the Larderello geothermal system, Italy. Geophysical Research Letters, 19, 5–8.
- Gianelli, G. (1998). Condizioni di pressione e temperatura del termometamorfismo nel sistema geotermico di larderello. [pressure and temperature conditions of the termometamorphism in the larderello geothermic system]. Atti soc. tosc. sci. nat., mem., Serie A, 105, 17–35.
- Gianelli, G. (2008). A comparative analysis of the geothermal fields of Larderello and Mt. Amiata, Italy. In H. I. Ueckermann (Ed.), Geothermal energy research trends (pp. 59–85). New York: Nova Science Publishers.
- Gianelli, G., & Laurenzi, M. A. (2001). Age and cooling rate of the geothermal system of Larderello. Transaction-Geothermal Resource Council, 25, 731–735.
- Gianelli, G., Manzella, A., & Puxeddu, M. (1997). Crustal models of the geothermal areas of southern Tuscany (Italy). Tectonophysics, 281, 221–239.
- Gianelli, G., Puxeddu, M., Batini, F., Bertini, G., Dini, I., Pandeli, E., & Nicolich, R. (1988). Geological model of a young volcano-plutonic system: The geothermal region of Monte Amiata (Tuscany, Italy). Geothermics, 17(5–6), 719–734.
- Gola, G., Bertini, G., Bonini, M., Botteghi, S., Brogi, A., De Franco, R., … Trumpy, E. (2017). Data integration and conceptual modelling of the Larderello geothermal area, Italy. Energy Procedia, 125, 300–309.
- Gupta, M. L. (1981). Surface heat flow and igneous intrusions in the Cambay basin, India. Journal of Volcanology and Geothermal Research, 10, 279–292.
- Kappelmeyer, O., & Hänel, R. (1974). Geothermics with special reference to application [Geoexploration Monograph]. In Rosenbach, O. & Morelli, C. (Eds), Geoexploration Monographs, Series 1 (pp. 4). Berlin, Stuttgart: Gebr. Borntraeger.
- Lachenbruch, A. H. (1970). Crustal temperature and heat production: Implications of the linear heat-flow relation. Journal of Geophysical Research, 75, 3291–3300.
- Langone, A., Caggianelli, A., Festa, V., & Prosser, G. (2014). Time Constraints on the Building of the Serre Batholith: Consequences for the Thermal Evolution of the Hercynian Continental Crust Exposed in Calabria (Southern Italy). The Journal of Geology, 122, 183–199.
- Liotta, D., & Ranalli, G. (1999). Correlation between seismic reflectivity and rheology in extended lithosphere: Southern Tuscany, inner Northern Apennines, Italy. Tectonophysics, 315, 109–122.
- Magro, G., Bellani, S., & Della Vedova, B. (2009). The deep roots of the Larderello Geothermal Field (Italy) from the Heat Flux and 3He Anomalies. GRC Transactions, 33, 405–410.
- Mongelli, F., Palumbo, F., Puxeddu, M., Villa, I. M., & Zito, G. (1998). Interpretation of the geothermal anomaly of Larderello, Italy. Memorie Della Società Geologica Italiana, 13, 305–318.
- Muller, W. H., & Briegel, U. (1978). The rheological behaviour of polycrystalline anhydrite. Eclogae Geologicae Helvetiae, 71, 397–407.
- Norton, D., & Knight, J. (1977). Transport phenomena in hydrothermal systems: Cooling plutons. American Journal of Science, 277, 937–981.
- Peccerillo, A. (2005). Plio-Quaternary Volcanism in Italy, Petrology, Geochemistry, Geodynamics. Verlag Berlin Heidelberg: Springer.
- Pollack, H. N., Hurter, S. J., & Johnson, J. R. (1993). Heat flow from the Earth’s interior: Analysis of the global data set. Reviews of Geophysics, 31, 267–280.
- Ponziani, F., De Franco, R., Minelli, G., Biella, G., Federico, C., & Pialli, G. (1995). Crustal shortening and duplication of the Moho in the Northern Apennines: A view from seismic refraction data. Tectonophysics, 252, 391–418.
- Ranalli, G. (1995). Rheology of the Earth. London, GB: Chapman and Hall.
- Ranalli, G., & Rybach, L. (2005). Heat flow, heat transfer and lithosphere rheology in geothermal areas: Features and examples. Journal of Volcanology and Geothermal Research, 148, 3–19.
- Reiter, M., Chamberlain, R. M., & Love, D. W. (2010). New data reflect on the thermal antiquity of the Socorro magma body locale, Rio Grande Rift, New Mexico. Lithosphere, 2, 447–453.
- Rikitake, T. (1995). Intrusion and cooling of magma-comparison between 2D and 3D analyses. Journal of Physics of the Earth, 43, 715–728.
- Romagnoli, P., Arias, A., Barelli, A., Cei, M., & Casini, M. (2010). An updated numerical model of the Larderello–Travale geothermal system, Italy. Geothermics, 39, 292–313.
- Rossetti, F., Balsamo, F., Villa, I. M., Bouybaouenne, M., Facenna, C., & Funiciello, R. (2008). Pliocene-Pleistocene HT-LP metamorphism during multiple granitic intrusions in the southern branch of the Larderello geothermal field (southern Tuscany, Italy). Journal of the Geological Society, London, 165, 247–262.
- Saccorotti, G., Piccinini, D., Zupo, M., Mazzarini, F., Chiarabba, C., Piana Agostinetti, N., … Bagagli, M. (2014). The deep structure of the Larderello-Travale geothermal field (Italy) from integrated, passive seismic investigations. Energy Procedia, 59, 227–234.
- Santilano, A., Manzella, A., Gianelli, G., Donato, A., Gola, G., Nardini, I., … Botteghi, S. (2015). Convective, intrusive geothermal plays: What about tectonics?. Geothermal Energy Science, 3, 51–59.
- Shea, W. T., & Kronenberg, A. K. (1992). Rheology and Deformation Mechanism of an Isotropic Mica Schist. Journal of Geophysical Research, 97, B11, 201–15, 237
- Smith, S. A. F., Holdsworth, R. E., & Collettini, C. (2011). Interactions between low-angle normal faults and plutonism in the upper crust: Insights from the Island of Elba, Italy. GSA Bullettin, 123(1–2), 329–346.
- Spear, F. S. (1993). Metamorphic Phase equilibria and Pressure-Temperature-Time Paths. Washington DC, USA: Mineralogical Society of America.
- Spinelli, R., Casini, M., Costantino, N., Giudetti, G., Ciuffi, S., & Dini, A. (2015). Anatomy of Granite Intrusions in the Travale Geothermal Field (Italy): A First Geochemical-Petrographic-spectral Gamma Ray Log Approach. Proceedings World Geothermal Congress. Melbourne, AUS.
- Stimac, J., Goff, F., & Goff, C. J. (2015). Intrusion-related Geothermal Systems. In H. Sigurdsson, B. Houghton, S. McNutt, H. Rymer, & J. Stix (Eds.), The Encyclopedia of Volcanoes (pp. 799–822). New Mexico: Academic Press.
- Stimac, J., Goff, F., & Wohletz, K. (1997). Thermal modelling of the Clear Lake magmatic system, California: Implications for conventional and hot dry rock geothermal development. Los Alamos Report LA-12778-MS, 38p.
- Stimac, J., Goff, F., & Wohletz, K. (2001). Thermal modelling of the Clear Lake magmatic-hydrothermal system, California, USA. Geothermics, 30, 349–390.
- Turcotte, D., & Schubert, G. (2014). Geodynamics. New York, USA: Cambridge University Press.
- Villa, I. M., Ruggieri, G., & Puxeddu, M. (2001). Geochronology of magmatic and hydrothermal micas from the Larderello geothermal field, Italy. In R. Cidu (Ed.), Water Rock Interaction (Vol. 2, pp. 1589–1592). Lisse: N: Balkema Publishers.
- Villa, I. M., Gianelli, G., Puxeddu, M., Bertini, G., & Pandeli, E. (1987). Granitic dykes of 3.8 Ma age from 3.5 km deep geothermal well at Larderello (Italy). Rendiconti Della Società Italiana Di Mineralogia E Petrologia, 42, 364.
- Villa, I. M., & Puxeddu, M. (1994). Geochronology of the Larderello geothermal field: New data and the “closure temperature” issue. Contributions to Mineralogy and Petrology, 115, 415–426.
- Villa, I. M., Ruggieri, G., & Puxeddu, M. (1997). Petrological and geochronological discrimination of two white-mica generations in a granite cored from the Larderello-Travale geothermal field (Italy). European Journal of Mineralogy, 9, 563–568.
- Villa, I. M., Ruggieri, G., Puxeddu, M., & Bertini, G. (2006). Geochronology and isotope transport systematics in a subsurface granite from Larderello-Travale geothermal system (Italy). Journal of Volcanology and Geothermal Research, 152, 20–50.