
 ?Mathematical formulae have been encoded as MathML and are displayed in this HTML version using MathJax in order to improve their display. Uncheck the box to turn MathJax off. This feature requires Javascript. Click on a formula to zoom.
Abstract
Several methods have been developed to detect differences between temporal satellite images for change detection. Image differencing, which is easy to compute and implement, does not require ground-based data. In this study, the performance of 11 other spectral distances was explored in addition to simple differencing for change detection. Moreover, the fusion of these distances was evaluated using various methods, including linear combination, classification, and majority voting. Comparing the results in different study areas showed that Pearson-Correlation and Spearman-Correlation were the most accurate distances. Additionally, the evaluation of the results indicated that the unsupervised fusion of different distances could increase the final accuracy by an average of 10%. Furthermore, the classification of distance images, which had slightly lower accuracy than the post-classification comparison of original images, was more accurate than the fusion of distances using these methods or thresholding the individual distances.
1. Introduction
Change detection (CD) is a process used to identify differences in phenomena, features, and patterns on the land surface over time (Singh Citation1989; Yang and Lo Citation2002; Chen et al. Citation2003). CD is widely applied in various fields of geoscience, such as urban development and change monitoring, forest monitoring, environmental disaster prevention, map updating and optimal management of natural resources (Coppin and Bauer Citation1996; Goswami and Khire Citation2016; Ma et al. Citation2016; Touati et al. Citation2016). Remote sensing (RS) data, with their wide coverage, relevant temporal resolution, availability at different times and places, high spectral, spatial, and radiometric resolution, digital format and computer processing capability, are valuable for studying temporal and spatial changes of land cover/land use (Lunetta et al. Citation2006; Jensen Citation2009; Eismann Citation2012). Land use/land cover changes appear as changes in texture, shape, or gray levels in RS images (Singh Citation1989).
Due to the importance of CD in land cover/use, it is essential to detect changes accurately. Accordingly, in addition to the quality of the data used to detect changes, the ability of the CD method also greatly influences the efficiency and accuracy of the results. Hence, appropriate and efficient methods are required to process the data and produce accurate change maps and information layers (Lu et al. Citation2004). Several studies have been done on RS CD algorithms. The list of available RS CD algorithms in the related literature can be found in Fatemi Nasrabadi (Citation2019).
Given the time-consuming and costly process of generating ground truth data, as well as the inadequate coverage, users tend to use unsupervised CD algorithms more than supervised ones, which generally have less computational complexity (Bruzzone and Prieto Citation2000, Citation2002; Bovolo and Bruzzone Citation2006; Pacifici et al. Citation2007). Therefore, developing an unsupervised CD method with acceptable performance has attracted the attention of researchers in this field (Renza et al. Citation2017; Kusetogullari and Yavariabdi Citation2018; de Jong and Bosman Citation2019; Petry et al. Citation2019).
Algebraic methods (e.g. image differencing, image regression, image rationing) are among the most popular categories of unsupervised RS CD methods (Lu et al. Citation2004). They are relatively simple, straightforward, and easy to implement; however, they cannot provide complete information about the type of change. Threshold selection is a common challenge in these methods to determine changed areas (Tung and LeDrew Citation1988). Image differencing and rationing were the most widely used RS CD methods in the past due to their simple and fast implementation and the absence of training data requirements (Deepthy and Vasuki Citation2013; Fatemi Nasrabadi Citation2019). Pixels of the difference image with significantly large values are associated with areas likely to show change (Byun et al. Citation2015). The simple differencing method detects binary changes and does not provide from-to information about the changes (Hussain et al. Citation2013). Each Spectral Distance (SD), which measures the differences between corresponding pixels in two or more images, can provide helpful information about changes made during the study period. Accordingly, the values of the SDs indicate the intensity of the changes. In addition to the simple differencing method, different distances have been used to detect changes in many studies using RS images (Alberga Citation2009; Pillai and Vatsavai Citation2013; You et al. Citation2020). Using these distances produces difference maps, which can be converted to change maps by applying a suitable threshold.
In many RS CD studies, researchers have employed the Change Vector Analysis (CVA) algorithm, using various spectral distances (SDs) such as Euclidean, Spectral Angle Mapper (SAM) and Spectral Correlation Mapper (SCM) (Coulter et al. Citation2011; Gong et al. Citation2011; Renza et al. Citation2013; Martinez et al. Citation2017; Zakeri and Saradjian Citation2022). CVA techniques compute a multidimensional difference image by subtracting the spectral feature vectors associated with each pair of corresponding pixels in two images acquired from the same scene at different times (Bovolo and Bruzzone Citation2006). Among the SDs used in CVA methods, the most commonly used differencing algorithms are SAM (Kruse et al. Citation1993) and SCM (Carvalho Júnior and Meneses Citation2000). Carvalho Júnior and Meneses (Citation2000) explored changes in an area in northwest Brazil using Euclidean and Mahalanobis distances, as well as SAM and SCM to investigate the direction of the changes. Accuracy assessment of the CD results of various distances on multi-temporal Landsat TM images showed better performance of Euclidean and SAM distances than Mahalanobis and SCM distances. Renza et al. (Citation2017) presented a new unsupervised method for detecting changes in a vegetated area by developing separate SAM approaches to compare the reference spectrum with each multi-temporal image. They employed three methods to evaluate the presented approach: a supervised post-classification CD method based on the SVM classifier, and two unsupervised differencing CD methods based on SAM and NDVI. Their experience indicated that the accuracy of the proposed method is comparable to (as high as) the supervised method, and its computational complexity and execution time are similar to (as low as) the unsupervised methods. Furthermore, Yan et al. (Citation2018) employed an unsupervised fusion-based approach to increase the efficiency of the SDs in detecting changes by ETM + images. They used SCM, spectral gradient difference (SGD), and Euclidean distance as the spectral similarity measures, and integrated the results to represent a novel fusion-derived method named hybrid spectral difference (HSD).
Despite their simplicity and high speed, most unsupervised CD methods, such as algebraic methods, do not provide more accurate results than supervised ones. Additionally, they are unable to produce from-to information on the changes. Therefore, in recent years, many researchers have focused on post-classification comparison and machine learning methods (Parihar et al. Citation2013; Cao Citation2019; Toosi et al. Citation2019). However, these methods have greater computational complexity and execution time, and they require relevant spectral information and sufficient training data to be effective (Deepthy and Vasuki Citation2013).
Achieving suitable and efficient results with minimal time and computational complexity, without the need for reference data, using simple unsupervised methods has become a challenge in RS CD studies. Moreover, differences in the physical and mathematical characteristics of the SDs may result in variations in the changes detected by them in some pixels. Therefore, the accuracy of the CD results obtained using different SDs may differ. In the past decades, only a few comprehensive studies have utilized the potential of SDs for RS CD. Consequently, a limited number of available SDs have been used for CD, whereas, as previously mentioned, the use of SDs has yielded valuable results in prior studies. Furthermore, SDs are often disregarded in supervised CD methods, which limits their ability to detect changes using RS images. It can be tested through supervised or unsupervised fusion methods. Despite the great potential of SDs fusion, it is rarely encountered in the literature. The importance of using simple SDs in CD becomes evident when dealing with a time series of RS data, and training in supervised methods becomes a significant challenge.
In the present study, we aimed to employ a diverse and comprehensive set of 12 of the most common SDs for RS CD. Using these SDs together, some of them for the first time, for unsupervised CD is a potential that has not been fully explored. We individually investigated the performance of the proposed SDs in CD in different landscapes. Additionally, we aimed to evaluate the potential of different SDs in providing changed/unchanged information content for various unsupervised/supervised RS CD approaches. Moreover, we investigated the effect of employing fusion-based methods, which integrate the capabilities of the proposed SDs, on improving the CD results. In this regard, some supervised/unsupervised fusion algorithms were applied at the feature and decision level. Overall, 12 change maps were produced based on the employed SDs in an unsupervised CD method. Thus, we implemented three fusion algorithms to improve the accuracy of the CD results, including linear combination, majority voting, and different post-classification algorithms using the distances. The results of integrating the distances confirm that applying a fusion method to the individual SDs can improve the accuracy of the final CD map.
2. Study area and datasets
Generally, two distinct datasets were utilized to identify changes using the RS images. To assess the methods’ effectiveness in varying conditions, study areas with different characteristics were chosen. Consequently, multi-temporal images from two sensors with high and medium spatial resolution were selected. Additionally, reference data was utilized to evaluate the accuracy and train the classifiers.
2.1. Remote sensing data
Two satellite-derived datasets consisting of multi-temporal images obtained from regions with diverse characteristics were utilized. To enhance the accuracy of the detected changes and avoid spurious changes, we aimed to choose images with similar specifications based on their acquisition information. Consequently, multi-temporal images with comparable acquisition times (similar months and days in different years) were selected to minimize the parameters that could affect the results’ accuracy, such as differences in atmospheric, environmental, sun geometry, and land cover parameters.
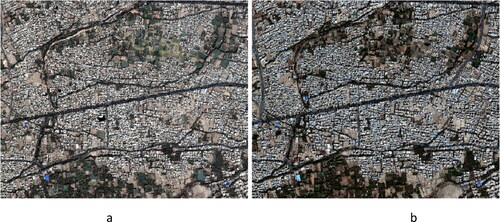
The first dataset comprises an image from Pléiades taken on 21 November 2012, and a WorldView-3 (WV-3) image acquired on 28 October 2016, with nadir angles of 0 and 2 degrees, respectively. These images cover a portion of Isfahan city (Iran) with a resolution of 4000*5000 pixels and a spatial resolution of 0.5 meters, with four spectral bands (three visible bands and one infrared band). The images of the first dataset () cover a dense urban area. In such regions, CD algorithms often aim to identify changes in urban buildings, green areas, and passages created or modified between the image capture times.
Figure 1. Pléiades and WV-3 images of the Isfahan urban area for the years (a) 2012 and (b) 2016, respectively.
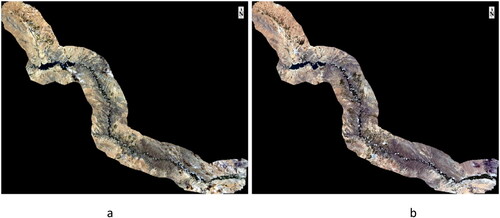
The second study area includes a portion of the marginal agricultural area of the Zayandeh-Rud river, with 80 km long in Isfahan Province (Iran). This area lies in a latitude of 32°20′04″ to 32°55′28″N and a longitude of 50°28′1″ to 51°21′45″E. The dataset for this region (dataset 2) includes the first scene captured by ETM+ (Landsat 7) on 4 July 2001, and the second scene taken by Optical Land Imager (OLI, Landsat 8) on 5 July 2016, with a spatial resolution of 30 m and seven identical bands.
In recent years, the region has faced multiple challenges, such as changes in rainfall patterns and inadequate water resource management in the Zayandeh-Rud catchment, culminating in severe land cover changes in the agricultural areas along the river (Gholinejad and Fatemi Citation2019). Excessive water harvesting in the area has led to the drying up of the river’s eastern parts, causing significant issues for the local population. Meanwhile, unregulated water withdrawal in the upstream areas has expanded the agricultural zones. Detecting changes in vegetation cover in the western region can indicate that the increase in the agricultural area is due to excessive water harvesting. Since the farms in this area are often located along the river, we investigated the changes in the vegetation cover areas along the river. Therefore, a zone within a buffer of 6 km from the axis of the Zayandeh-Rud River was preserved ().
2.2. The reference data
To train the classifiers and evaluate the final results, reference data are essential. Hence, the reference data were generated in both study areas by visually interpreting the satellite images and assigning 'changed’ and 'unchanged’ labels to certain pixels. Subsequently, the performance of various applied CD methods was evaluated in each study area.
Two categories, training data and test data, were created for the reference data in each study area. To be specific, in each study area, 80% of the reference 'changed’ and 'unchanged’ pixels were randomly chosen and assigned as the training data while the remaining 20% was used as the test data. The training dataset and the test dataset had no overlapping pixels. A detailed account of the number of changed and unchanged pixels for the training and test data in each dataset are provided ().
Table 1. Number of changed/unchanged pixels used as test/training data in each dataset.
3. Methodology (methods and implementation)
During this study, a total of 18 CD methods were employed, which were classified into four categories. These categories comprise two unsupervised approaches that were based on thresholding the individual SDs and their fusion, a supervised fusion of SDs by classifying the stacked DIs and traditional post-classification comparison CD using the stacked original bands. Although the resulting change maps highlighted significant differences between the applied CD approaches, we used numerical evaluation results for precise comparison. In order to evaluate the performance of the proposed methods in each study area, the corresponding change maps were validated in comparison with the ground truth data. For this purpose, the test part of reference data was used to assess the accuracy of the produced change maps. The overall accuracy (OA) (Congalton Citation1991) values were calculated for the final change maps using the same test data for all cases in both study areas.
3.1. The applied spectral distances
While applying a basic distance metric on multi-temporal images can produce a change map, there are several distance measures that can be employed. Consequently, the primary challenge is determining which distance measure can provide more accurate results. The selection of an appropriate method for CD is a challenging task in practical applications (Lu et al. Citation2004).
Changes in land use/land cover, crop type and condition in agricultural areas, precipitation, temperature and construction in urban and industrial areas, as well as various natural and human-induced events can lead to spectral differences between corresponding pixels on two different dates (Mishra et al. Citation2017). When the gray level difference between corresponding pixels increases, their spectral similarity decreases, and the SD value between them in the feature space also increases. As a result, SDs can be used to indicate the presence of changes during the study period, as they measure the degree of difference between corresponding pixels. While SDs provide valuable information about the changes, selecting an appropriate CD method remains a significant challenge, as there is no existing method that is optimal and applicable to every situation (Liu et al. Citation2005; Foody Citation2009). Although there may be some drawbacks, using the spectral change difference (SCD) for change detection has advantages, such as the ease of working with SDs, low time consumption, and simple implementation with low computational complexity.
Additionally, employing SDs as unsupervised algorithms for CD eliminates the need for training reference data. Combining different SCD images can potentially improve the ability to detect changes and reduce the uncertainties of using a single difference image (distance). The abilities of different SDs to detect changes are not the same (Ridd and Liu Citation1998; Carvalho Júnior et al. Citation2011; Deepthy and Vasuki Citation2013; Yan et al. Citation2018). Indeed, the distances calculated using various algorithms would determine unequal dissimilarities and extract different changes from various sources. Therefore, several SDs with different physical and theoretical bases were tested for RS CD. Furthermore, to more accurately assess the potential of SDs, they also were applied in different supervised/unsupervised fusion-based CD methods.
In the present study, 12 different SDs were calculated after applying pre-processing procedures to the satellite images, including atmospheric and geometric correction and geo-referencing (the corresponding images were precisely co-registered to prevent undesirable errors and false alarms). The applied distances include Euclidean, City-Block, Chebyshev, Mahalanobis, Pearson-Correlation, Spectral Angle Mapper, Spearman-Correlation, Spectral Gradient Distance, Cosine, Covariance Equalization (CE), Chronochrome (CC), and Hyperbolic Anomalous Change Detection (HACD). Each distance is described in detail in the following.
In all equations (), and
represent the pixel’s value at row i and column j of the first and second images, respectively, b denotes the band number, N is the number of the pixels of the image, and D is the corresponding distance. Since the images are assumed to be atmospheric corrected, the digital number (DN) of the pixels contains surface reflectance quantities.
Table 2. Implemented spectral distances.
Finally, 24 distance images (DIs) were generated for the two applied datasets using the 12 spectral distances. As an example, the DIs obtained from the first dataset are represented in the following. The resulting DIs from different distances are specifically different in some areas ().
The spectral DIs from Landsat images are not included here because they do not offer any additional information compared to the ones in dataset 1.
3.2. Thresholding
Thresholding is an essential step in converting DIs into binary change maps. Thresholding categorizes image pixels into two groups, one with values lower than a certain value (unchanged pixels), and the other with higher values (changed pixels). The optimal threshold is the one that maximizes the separability of the output classes based on the pixel values. Finding the optimal threshold is a crucial concern in many RS studies (Wu and Yuan Citation2022).
The simplicity and efficiency of Otsu’s thresholding algorithm (Otsu Citation1979) make it a proper choice for calculating appropriate thresholds for different distances to distinguish between changed and unchanged pixels. This algorithm typically returns a single intensity threshold that separates pixels into two classes: background (unchanged) and target (changed). In Otsu’s algorithm, the threshold value is set by minimizing the variance of the intensities within a class (intra-class), equivalent to maximizing the between-class variance (inter-classes). The objective function of Otsu’s algorithm is identical to that of the K-means method on multiple thresholding (Sharma and Sharma Citation2019). Nevertheless, it is equivalent to a globally optimal one-dimensional k-means, which is a local optimal method performed on the gray-level histogram. In other words, Otsu’s method has a more comprehensive optimization algorithm for searching the global optimum threshold, while K-means is a local optimization algorithm (Liu and Yu Citation2009).
Since preliminary information on optimal thresholds for various distances was not available, to achieve more accurate results, a special Otsu multilevel thresholding algorithm was employed to determine multiple thresholds in each DI. The number of optimal thresholds for each distance and the optimal threshold for CD were determined by trial and error. Since one of the objectives of this work is to investigate the ability of various SDs for CD in an unsupervised manner, reference data was not used in evaluating the results obtained from different thresholds. Therefore, the appropriateness of different thresholds was evaluated based on the visual comparison of the resulting change maps with the original images. Finally, the optimal threshold for each SD in each study area was selected.
In some cases, the best available threshold was changed slightly to achieve a more accurate final change map. After extracting the thresholds using Otsu’s algorithm for each distance map, pixels with a value equal to or greater than the defined threshold were labeled as changed. Finally, 12 change maps were generated by applying thresholds to the different DIs within each study area. The final change maps of urban and agricultural regions are presented in the following.
3.3. Fusion of the spectral distances
Combining features is an effective strategy in RS that has the potential to increase the accuracy of information extraction (Tullis and Jensen Citation2003; Ji Citation2010; Sheoran and Haack Citation2014). Therefore, to fully exploit the potential of SDs in RS change detection (CD), three fusion techniques were employed on DIs. These methods involved two unsupervised methods and one supervised method. The unsupervised fusion methods are linear combining and majority voting algorithms used at feature and decision levels, respectively. Also, a classification-based CD algorithm based on stacked DIs was employed as the supervised fusion method.
3.3.1. Linear combination
As the first unsupervised fusion method, a linear combination of the distance images was produced. Therefore, a new DI was generated by creating a constant and equal-weighted linear combination of the normalized DIs as follows:
(16)
(16)
(17)
(17)
Finally, a change map is generated by applying an appropriate threshold to the new DIlinear_combined using Otsu’s algorithm.
3.3.2. Majority voting
Majority voting is the most commonly used, fast, and uncomplicated unsupervised method in the field of decision-level fusion. In this algorithm, the most frequent label (change or unchanged) obtained by the change maps is considered the final label of the pixel. In practice, after generating change maps using 12 different SDs, the pixel label in each change map is a vote. Then, the pixel is assigned to the class (changed/unchanged) with the highest votes by counting the number of votes for changed/unchanged labels. Finally, the majority voting method generates a new binary change map for the two datasets.
3.3.3. Classification
Classification, as a stable method for feature fusion, can be applied to the DIs. Therefore, to accurately investigate the potential of the SDs in RS CD, the next step was a supervised fusion based on classifying the pixels using the SDs as spectral features. To this end, all 12 DIs were stacked in the form of a difference image for each study area. Then, the pixels were classified into two classes, changed and unchanged, in each region by employing three classification algorithms: Maximum Likelihood (ML), Support Vector Machine (SVM) and Artificial Neural Network (ANN). After testing various options, the SVM classifier with Radial Basis Function (RBF) kernel using the least square (LS) learning method was selected. Then, according to the presented data splitting (), three classifiers (i.e. SVM, ANN and ML) were trained on the stacked DIs using the same training dataset.
3.4. Post-classification comparison
Classification-based algorithms have performed well in many previous studies on CD (Miller et al. Citation1998; Yuan et al. Citation2005; Virk and King Citation2006; Colditz et al. Citation2012; Singh et al. Citation2018), making them a suitable benchmark for evaluating the results of all previous supervised and unsupervised algorithms. In other words, this method can be used to evaluate the added value produced by SDs for CD. To this end, the spectral bands of the original images were stacked and then classified into ‘changed’ and ‘unchanged’ classes. Given the optimal performance of the SVM classifier in previous studies (Nemmour and Chibani Citation2006; Zewdie and Csaplovies Citation2015; Kesikoglu et al. Citation2019; Toosi et al. Citation2019), and to reduce the computational burden of the CD, the SVM algorithm (with the same parameters as previously stated) was used for post-classification comparison CD.
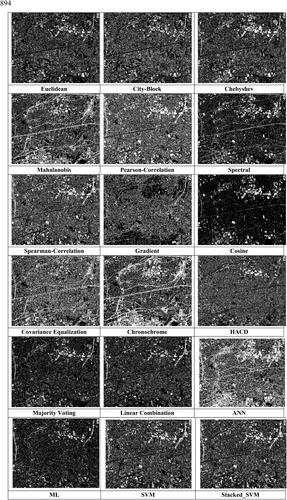
Overall, 18 binary change maps were produced for both study areas of urban and agricultural ( and ).
4. Results
The superiority of inputs, such as SDs, or algorithms, such as classifiers, in some CD methods could be confirmed by visual inspection. In the urban region, the identification of paths built between the time interval of two images () in the northeast and northwest can be considered a measure of accuracy for the change maps. False detection of the west-east crossing in the middle of the main images can be another metric for the performance of the applied CD methods, particularly thresholding SDs. On the other hand, in the agricultural region, the main changes occurred in the western and middle parts of the river basin (). Therefore, detecting false changes, especially in the eastern areas of the river path, was used as a suitable visual measure for validating the performance of the applied CD methods.
Apart from minor differences in desired regions, the change maps obtained from unsupervised CD methods based on the fusion of SDs showed great visual similarity in both regions. Thus, visual inspection indicated high accuracy of their results in both regions, especially linear combination in the urban region and majority voting in the agricultural region.
The effectiveness of SDs can be evaluated by assessing the similarity of their outputs to these methods. Meanwhile, SDs that share the same theoretical basis produced change maps that visually resemble each other. For example, this similarity was evident in the change maps generated from the SDs based on correlation coefficients (Spearman and Pearson) in both regions, particularly in the urban area. Similarly, Euclidean and Chebyshev-based SDs produced comparable change maps for both datasets. Upon visual analysis of the results, it can be concluded that the change maps resulting from different types of SDs that were more similar to the outputs of the fusion-based CD methods (supervised/unsupervised) were also more accurate from a numerical perspective.
Among the applied distances, four distances have produced suitable results in both datasets, including Pearson-Correlation, Spearman-Correlation, Spectral, and Cosine. The superiority of preferred SDs, such as Spearman-Correlation and Pearson-Correlation, can be inferred by visual comparison of original multi-temporal images in both regions. They have the most similar change maps to the results of the traditional supervised post-classification CD approaches, which are presented in the following. In contrast, the change maps produced by weaker SDs in this section have lower similarities with original images and supervised ones. The weaker distances, such as Euclidean, Chebyshev, Covariance-Equalization, City-block, Spectral Gradient, Mahalanobis and HACD, produced several spurious changes in the final change maps ( and ). ChronChrome was identified as the most sensitive to the landscape (here urban and agricultural). More detailed discussions are provided in section 5.
Among the SDs, the Pearson-Correlation and Spearman-Correlation distances had the highest accuracies in the first and second datasets, with OA values of 85.78 and 82.05%, respectively. The City-Block and HACD distances had the lowest accuracies in the first and second datasets, with OAs of 50.02 and 61.91%, respectively. The difference between the lowest and highest OAs of the change maps using the first dataset, containing Pléiades and WV-3 images, was about 24% (), while the same value in the second dataset, including ETM + and OLI images, was about 32%. Meanwhile, the standard deviation of the OA values in the first and second datasets was about 8.14 and 10.79%, respectively, which illustrates the disparate performances of SDs for unsupervised CD in different conditions.
Table 3. Accuracy assessment results of the applied CD methods in the urban (dataset 1) and agricultural (dataset 2) study areas.
Overall, the Spearman-Correlation SD provided the best general performance among the tested distances in both datasets. In contrast, the City-Block and HACD SDs had the lowest accuracy in urban and agricultural regions, respectively. In addition to City-Block, four other distances, including Euclidean, Chebyshev, and Covariance Equalization (CE), yielded poor and almost identical accuracy for both datasets. However, the ChronChrome distance performed differently for each dataset, with better results in the urban region than in the agricultural region. Further investigation is required to accurately evaluate the capability of ChronChrome SD for CD. Meanwhile, the performance of Spectral SD in both regions was good and quite similar. Although it did not have the highest accuracy in either dataset, while, its proper and balanced performance in areas with different characteristics makes it one of the most recommended distances for CD studies.
The accuracy assessment results indicate that unsupervised fusion of SDs at both the feature and decision levels improved the accuracy of change detection when using SDs (). Additionally, this approach provided stable change detection results in both datasets. Further, visual comparisons between the produced change maps ( and ) and the original multi-temporal images ( and ) support the superior performance of this approach in both datasets.
Figure 2. Landsat 7 & 8 Satellite images of Zayandeh-Rud agricultural areas for (a) 2001 and (b) 2016.
The results of the accuracy assessment showed that the traditional post-classification comparison method, which used SVM as the preferred classification algorithm, was more efficient than all previous supervised and unsupervised CD methods. However, when using stacked original images, the overall accuracy was comparable to using stacked difference images in both study areas. For urban and agricultural areas, SVM was slightly better than other methods, with a superiority of around 0.1% and 0.6%, respectively.
5. Discussion
5.1. Unsupervised RS CD: thresholding individual SDs
A general validation of the results () shows that the capabilities of different SDs in RS CD depend on the dataset’s characteristics, such as properties of RS imagery and land use/cover. A number of SDs (e.g. HACD and ChronChrome), due to their sensitivity to scene parameters and tendency to produce less accurate results, may not be suitable for CD.
On the other hand, the Pearson-Correlation and Spearman-Correlation, which achieved optimal results in both areas, are calculated based on the correlation values between the DN quantities in the images. Therefore, among the employed distances, the correlation criterion is perhaps the most consistent with the nature of the changes in RS images. Accordingly, the correlation-derived SDs showed better performance compared to other applied distances. The percentage of changes identified by each distance varies, as different distances report different OA values. In most cases, single distances tend to show more changes than the actual value ( and ). This overestimation of changes may be due to the threshold values applied or the simplicity of using distances for change detection compared to the complexity of the actual change process.
Figure 3. Spectral distance images (between Pléiades and WV-3 images of 2012 and 2016).
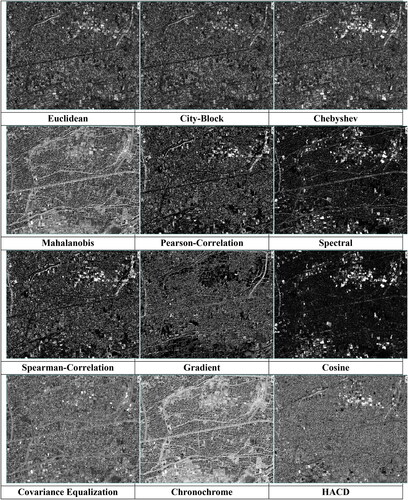
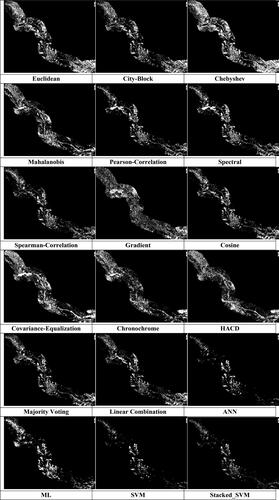
Figure 4. Binary change maps (changed: black and unchanged: white) produced by applying SCD and fusion methods using the Pléiades and WV-3 images.
The results of our tests, along with previous research, suggest that SDs have a good potential in CD. However, there is limited existing work that has evaluated the performance of SDs, especially in unsupervised CD. Previous studies have primarily focused on a few specific SDs (such as Euclidean, Mahalanobis, SAM or SCM) and extensively discussed them. Recently, SDs have primarily been used as spectral features in supervised classification-based CD methods. These studies have examined and compared the capabilities of different distances to provide change-related information. In this section, we aimed to compare our findings, such as the superiority of certain SDs over others or the similarity in performance among some of them, with the outcomes of similar studies.
Applying SDs as features for post-classification comparison (supervised) CD studies have performed well in the past (Chen et al. Citation2003; Jiang et al. Citation2012; Sun and Ongsomwang Citation2020). In most of these works, distances such as SAM and Mahalanobis have shown their superiority over distances such as Euclidean and Chebyshev (Yousefi et al. Citation2015; Gómez et al. Citation2016), just like the results we obtained by evaluating the individual SDs. However, apart from insignificant differences, spectral metrics, such as Mahalanobis distance, minimum (Euclidean) distance, SAM and SCM (based on correlation), have similarly shown suitable performance in supervised CD (Chowdhury and Dwarakish Citation2022). In some cases, the fusion of the classification results has also been used to improve the accuracy of land cover CD (Dibs et al. Citation2021).
In supervised change detection methods, using SDs, even a small number of them (one or two), has yielded very good results. However, in the present study, using the same SDs in unsupervised CD led to heterogeneous results, as discussed further. In general, spectral distances have the potential to provide efficient information for binary CD. Our study, particularly when using correlation-based distances such as Pearson and Spearman, demonstrates this high potential. Heterogeneous and sometimes inconsistent results with previous studies, especially in the case of distances such as Euclidean and Mahalanobis, may be attributed to unsupervised thresholding.
5.2. Unsupervised RS CD: fusion of SDs
When comparing the results of unsupervised fusion of distances with thresholding of individual distances, the fusion-based change maps show higher accuracy in most cases for both study areas. Additionally, the change maps produced by these fusion-based methods are more similar to those produced by the post-classification RS CD method in both regions. Therefore, the average overall accuracy (OA) achieved by applying unsupervised fusion methods on the SDs (using majority voting and linear combination with equal weights) was approximately 10% higher than the average OA of all 12 distances for both datasets. However, the average OAs of these two fusion-based CD results were slightly lower than the highest OA obtained by the individual distances in both study areas.
The slightly lower average OA of the two applied fusion methods, compared to the highest OA obtained by individual distances in both study areas may be attributed to the high number of distances with low OAs and the use of equal weights. Despite this, the fusion of distances was successful in identifying many specific and significant changes without overestimation. However, a fusion of SDs could potentially yield more consistent results than most individual SDs. This is consistence with the results of Singh and Singh (Citation2018), whose results show that the fusion of different metrics is a promising approach for change detection.
5.3. Supervised RS CD: fusion of SDs
The three supervised classifiers used in the study, namely ML, SVM and ANN, demonstrated better performance compared to the previous applied unsupervised methods () when using individual SDs and their unsupervised fusion. This can be explained by the fact that supervised methods are generally superior to unsupervised methods in extracting information.
The ANN classification of the SDs () resulted in more false detections of change than the other classification methods, leading to lower accuracy in the urban study area with high heterogeneity. The ANN classifier labeled approximately 60% of the urban area as changed, which was not supported by the other maps. In contrast, the maximum likelihood (ML) classification method produced a change map with fewer pixels identified as changed, accounting for approximately 40% of the pixels in the urban area. However, the opposite pattern is observed in the second dataset (), where the ML classification method overestimated the number of changed pixels, and the ANN classification produced a map with fewer changed pixels. These findings suggest that the landscape characteristics and heterogeneity of changes have a significant impact on the accuracy of change detection using supervised classifiers, while the same method and settings are used.
Figure 5. Change maps produced by applying SCD and fusion methods using the Landsat 7 & 8 images.
The SVM classifier has best performance and the highest OA compared to the other applied methods in both regions. However, the results of the supervised classification of the SDs are different in the two study areas, and more accurate results are obtained in the study area with urban land use. This superiority is probably due to the lower spectral dissimilarity between the ‘changed’ pixels at two times of image acquisition in the agricultural area compared to the urban area, which is likely due to the difference in the intensity of the changes in the two study areas. In the urban area, construction/deconstruction would cause more severe changes, resulting in larger values of SDs. In contrast, in the agricultural area, natural vegetation cover of the Zayandeh-Rud river basin, before turning into farms, results in lower spectral dissimilarities (smaller distances).
The theoretical basis and physical fundaments of the employed SD (separated/fused) and the appropriateness of the classification algorithms would be other sources of the differences. Other researchers have obtained good accuracies in post-classification CD through the combination of simple classification methods, as reported by El-Hattab (Citation2016). However, the impact of the classification algorithm on change detection results has also been highlighted in previous studies (Serra et al. Citation2003) such as the findings observed in the present study.
5.4. Supervised RS CD: post-classification comparison
Overall, the post-classification approaches based on the SDs have produced CD results that are comparable to the applied traditional post-classification comparison method. Visual inspection of the resulting change maps in both study areas ( and ) reveals similar performances between the methods. In comparison, SVM has the most similar performance using the stacked DIs and original images, particularly in the urban region. As the classification method becomes stronger, the resulting change maps become more similar in terms of accuracy and spatial distribution of the detected changes. Thus, stacked original bands and stacked SDs produced similar change maps (El-Hattab Citation2015). This is confirmed by the OA of the produce maps in the both study areas. Therefore, when classification can be implemented, it can be the most reliable approach for change detection compared to using SDs individually or in fused form. This is completely consistent with the results of Goswami et al. (Citation2022).
5.5. General discussion
Although the Euclidean and City-block distances have been widely used in various CD studies before (Bao and Guo Citation2004; Carvalho Júnior et al. Citation2011; Deepthy and Vasuki Citation2013; Kumar et al. Citation2018; Singh et al. Citation2018; Yan et al. Citation2018), they have not produced accurate and stable results in this study. However, four SDs, including Pearson-Correlation, Spearman-Correlation, Spectral and Cosine, yielded higher OAs in both datasets. Spearman-Correlation distance is probably considered the most efficient SD for RS CD in this study, in contrast to the common geometric distances like Euclidean and City-block. It seems that using correlation coefficients to define some distances has improved their performance in CD. Since, similar consideration has been proposed by presenting the SCM to improve the SAM performance for RS CD in Carvalho Júnior and Meneses (Citation2000). Additionally, the four mentioned SDs (especially Spearman-Correlation) had the most stable results for CD in different landscapes and sensor spatial and spectral resolutions. Carvalho Júnior et al. (Citation2011) have reported that Euclidean distance is more accurate than Mahalanobis distance in determining the magnitude of changes over an agricultural area, which is exactly similar to our results (dataset 2). Whereas our investigations show that the results in the urban area can be completely dissimilar.
According to the results, CD methods with similar accuracies, particularly those using superior distances or a fusion of distances, have produced similar change maps for both datasets of urban and agricultural datasets ( and ). However, the accuracy values calculated for various SDs differ within the same dataset, with a minimum and maximum OA difference of at least 24%. Thus, the choice of distance used for CD appears to be critical and can significantly affect the final change map accuracy (). Therefore, at first glance, the choice of the distance used for the CD is critical and can intensively affect the accuracy of the final change map (). It’s worth noting that across all CD approaches, the minimum and maximum OA difference is approximately 40%, further emphasizing the influence of the applied method on CD results and highlighting the potential of SDs for RS CD.
Although SDs have been utilized alongside other features, such as shape, area, and fragmentation, in some unsupervised fusion-based studies (Szabó et al. Citation2012; Kumar et al. Citation2018), using different SDs as dissimilarity features has received less attention in the past. Therefore, two unsupervised fusion algorithms were implemented in this study, and the results were compared using the DIs and change maps. Our findings indicate that using an efficient and relatively comprehensive set of SDs in an unsupervised fusion-based approach results in minimal differences when changing the region and data resolution. Such better performance of applying individual SDs in a fusion-based CD approach has also been demonstrated in Deepthy and Vasuki (Citation2013), despite using a much lower number and efficiency of employed distances. Moreover, Yan et al. (Citation2018) achieved more precise CD results by proposing a new fusion-derived SD (HSD). However, due to the impact of applied SDs on CD result accuracy, identifying more capable distances can help achieve more accurate CD results. Hence, subsequent RS CD studies can achieve better results by utilizing appropriate SDs and fusion algorithms.
Overall, due to the varying capabilities of various SDs for CD in different datasets (study area and RS image), determining the optimal SD requires employing all of them and comparing their accuracy by validating the corresponding change maps using reference data. When integrating the SDs, using simple and fast fusion algorithms at both decision and feature levels (such as majority voting and equal-weighted linear combining, respectively) could eliminate the effect of inefficient distances in both study areas. Additionally, the difference between the results of the applied simple unsupervised fusion and the complex supervised CD methods is minimal, particularly in the agricultural area. Therefore, using an unsupervised fusion-based CD algorithm in the cases where no reference data is available and integrating all the SDs is more reliable and can produce more stable results.
The superiority of the applied supervised classification-based CD methods is likely due to the classifiers’ greater ability to extract the changed/unchanged information content produced by SDs compared to thresholding CD methods. Although the efficiency of the supervised methods was higher in the first study area containing complex urban features compared to the second study area that included agricultural features, the higher efficiency is inevitable. Furthermore, the produced change maps with supervised methods had fewer fake changed pixels in different regions, likely due to the stable classification concept compared to simple thresholding. The differences in the characteristics of the study areas, such as the complexity of the features and the size of the changed features regarding the spatial resolution of the applied RS images, significantly affect the final results.
The simultaneous use of the SDs via a fusion method, particularly in supervised methods, has received less attention in the past. The comparable results achieved by post-classification comparison of the stacked DIs and the stacked original images (SVM classifier) demonstrate the potential of the SDs for RS CD. Nevertheless, the slightly weaker performance of SVM on the stacked DIs compared to the original images highlights the impact of using low-accuracy SDs in CD analysis. Therefore, utilizing an efficient fusion-based method with an appropriate set of SDs can yield more accurate CD results.
On the other hand, the developed CD methods are expected to exhibit different trends in the two datasets due to the varying properties of the RS images and study areas. However, the accuracy assessment results () indicated similar trends for most cases, with only five methods performed differently in the two study areas. In other words, 13 out of 18 proposed CD methods (based on SDs) showed robustness to the applied dataset (RS images and study area), highlighting the potential of SDs.
There are some spurious detected changes in the results of all applied methods in the two study areas. These errors are mostly related to the sensors’ different viewing geometry, shadow areas, and the applied threshold values and classification parameters. In the first study area (urban), most changes are due to land use, while in the second study area, some real detected changes are due to agriculture fields with different green cover in the two applied dates. These changes are related to the land cover and land use in these areas and have not actually changed. None of the applied methods were able to differentiate between the land cover and land use changes.
6. Conclusion
This research aimed to investigate the potential of 12 different SDs for unsupervised/supervised RS CD using two datasets over urban and agricultural areas. Finally, the efficiency of all 18 applied CD methods was compared by evaluating the OA values for the resulting change maps based on the reference data. The results showed that various SDs can produce unequal results in different datasets, depending on the different characteristics of the study area and RS images. In general, regardless of the study area, Spearman-Correlation distance was indicated as the best SD, while the HACD and the Covariance Equalization distances produced the weakest results compared to other distances in both study areas. The well-known City-Block and Euclidean distances did not perform well in either region and showed moderate performances.
The fusion of the SDs at the feature level (linear combination) and decision level (majority vote) improved the CD results, which were approximately the same in both study areas. In fact, fusion of distances can ensure a certain level of performance of the SD-based unsupervised CD method. Therefore, if unsure of a specific SD in the study area, a batch of SDs can be fused and employed more confidently without further investigation. Additionally, supervised classification-based methods can be highly recommended if appropriate reference data are available. This better performance is more noticeable using medium-resolution images of an agricultural area. In general, the slight superiority of using stacked original images over stacked DIs in the classification-based CD approach shows the high potential of SDs for RS CD. However, the time-consuming nature and need for training data should be considered as limitations of such supervised classification-based CD methods.
Disclosure statement
No potential conflict of interest was reported by the author(s).
References
- Alberga V. 2009. Similarity measures of remotely sensed multi-sensor images for change detection applications. Remote Sens. 1(3):122–143. doi: 10.3390/rs1030122.
- Bao Q, Guo P. 2004. Comparative studies on similarity measures for remote sensing image retrieval. 2004 IEEE International Conference on Systems, Man and Cybernetics (IEEE Cat No 04CH37583); IEEE.
- Bovolo F, Bruzzone L. 2006. A theoretical framework for unsupervised change detection based on change vector analysis in the polar domain. IEEE Trans Geosci Remote Sens. 45(1):218–236. doi: 10.1109/TGRS.2006.885408.
- Bruzzone L, Prieto DF. 2000. Automatic analysis of the difference image for unsupervised change detection. IEEE Trans Geosci Remote Sens. 38(3):1171–1182. doi: 10.1109/36.843009.
- Bruzzone L, Prieto DF. 2002. An adaptive semiparametric and context-based approach to unsupervised change detection in multitemporal remote-sensing images. IEEE Trans Image Process. 11(4):452–466. doi: 10.1109/TIP.2002.999678.
- Byun Y, Han Y, Chae T. 2015. Image fusion-based change detection for flood extent extraction using bi-temporal very high-resolution satellite images. Remote Sens. 7(8):10347–10363. doi: 10.3390/rs70810347.
- Cao CC. 2019. Exploring deep learning methods for analyzing land use change. Environment: Department of Geography.
- Carvalho Júnior OA, Guimarães RF, Gillespie AR, Silva NC, Gomes RA. 2011. A new approach to change vector analysis using distance and similarity measures. Remote Sens. 3(11):2473–2493. doi: 10.3390/rs3112473.
- Carvalho Júnior OA, Meneses PR. 2000. Spectral Correlation Mapper (SCM): an improving Spectral Angle Mapper. Annual JPL Airborne Earth Science Workshop.
- Chen J, Gong P, He C, Pu R, Shi P. 2003. Land-use/land-cover change detection using improved change-vector analysis. Photogramm Eng Remote Sens. 69(4):369–379. doi: 10.14358/PERS.69.4.369.
- Chen J, Lu M, Chen X, Chen J, Chen L. 2013. A spectral gradient difference based approach for land cover change detection. ISPRS J Photogramm Remote Sens. 85:1–12. doi: 10.1016/j.isprsjprs.2013.07.009.
- Chowdhury A, Dwarakish GS. 2022. Selection of algorithm for land use land cover classification and change detection. IJARSCT. 2(1):15–24. doi: 10.48175/IJARSCT-2610.
- Colditz RR, Acosta-Velázquez J, Díaz Gallegos JR, Vázquez Lule AD, Rodríguez-Zúñiga MT, Maeda P, Cruz López MI, Ressl R. 2012. Potential effects in multi-resolution post-classification change detection. Int J Remote Sens. 33(20):6426–6445. doi: 10.1080/01431161.2012.688148.
- Congalton RG. 1991. A review of assessing the accuracy of classifications of remotely sensed data. Remote Sens Environ. 37(1):35–46. doi: 10.1016/0034-4257(91)90048-B.
- Coppin PR, Bauer ME. 1996. Digital change detection in forest ecosystems with remote sensing imagery. Remote Sens Rev. 13(3-4):207–234. doi: 10.1080/02757259609532305.
- Coulter LL, Hope AS, Stow DA, Lippitt CD, Lathrop SJ. 2011. Time–space radiometric normalization of TM/ETM + images for land cover change detection. Int J Remote Sens. 32(22):7539–7556. doi: 10.1080/01431161.2010.524676.
- De Jong KL, Bosman AS 2019. Unsupervised change detection in satellite images using convolutional neural networks. In 2019 International Joint Conference on Neural Networks (IJCNN); IEEE.
- Deepthy R, Vasuki A 2013. Fusion of difference images for change detection. In IJCA Proc on Int Conf on Innovations in Intelligent Instrumentation, Optimization and Electrical Sciences ICIIIOES.
- Dibs H, Hasab HA, Mahmoud AS, Al-Ansari N. 2021. Fusion methods and multi-classifiers to improve land cover estimation using remote sensing analysis. Geotech Geol Eng. 39(8):5825–5842. doi: 10.1007/s10706-021-01869-x.
- Duda RO, Hart PE, Stork DG. 2012. Pattern classification. Hoboken, New Jersey, USA: John Wiley & Sons.
- Eismann M. 2012. Hyperspectral remote sensing. Bellingham, Washington DC: SPIE Press.
- El-Hattab MM. 2015. Change detection and restoration alternatives for the Egyptian Lake Maryut. Egypt J Remote Sens Space Sci. 18(1):9–16. doi: 10.1016/j.ejrs.2014.12.001.
- El-Hattab MM. 2016. Applying post classification change detection technique to monitor an Egyptian coastal zone (Abu Qir Bay). Egypt J Remote Sens Space Sci. 19(1):23–36. doi: 10.1016/j.ejrs.2016.02.002.
- Fatemi Nasrabadi SB. 2019. Questions of concern in drawing up a remote sensing change detection plan. J Indian Soc Remote Sens. 47(9):1455–1469. doi: 10.1007/s12524-019-00997-5.
- Foody GM. 2009. Classification accuracy comparison: hypothesis tests and the use of confidence intervals in evaluations of difference, equivalence and non-inferiority. Remote Sens Environ. 113(8):1658–1663. doi: 10.1016/j.rse.2009.03.014.
- Gholinejad S, Fatemi SB. 2019. Optimum indices for vegetation cover change detection in the Zayandeh-rud river basin: a fusion approach. Int J Image Data Fusion. 10(3):199–216. doi: 10.1080/19479832.2019.1601642.
- Gómez C, White JC, Wulder MA. 2016. Optical remotely sensed time series data for land cover classification: a review. ISPRS J Photogramm Remote Sens. 116:55–72. doi: 10.1016/j.isprsjprs.2016.03.008.
- Gong M, Zhou Z, Ma J. 2011. Change detection in synthetic aperture radar images based on image fusion and fuzzy clustering. IEEE Trans Image Process. 21(4):2141–2151.
- Goswami M, Khire M. 2016. Land use and land cover change detection for urban sprawl analysis of Ahmedabad city using multitemporal landsat data. IJARSG. 5(1):1670–1677. –doi: 10.23953/cloud.ijarsg.51.
- Goswami A, Sharma D, Mathuku H, Gangadharan SM, Yadav CS, Sahu SK, Pradhan MK, Singh J, Imran H. 2022. Change detection in remote sensing image data comparing algebraic and machine learning methods. Electronics. 11(3):431. doi: 10.3390/electronics11030431.
- Hussain M, Chen D, Cheng A, Wei H, Stanley D. 2013. Change detection from remotely sensed images: from pixel-based to object-based approaches. ISPRS J Photogramm Remote Sens. 80:91–106. doi: 10.1016/j.isprsjprs.2013.03.006.
- Jensen JR. 2009. Remote sensing of the environment: an earth resource perspective 2/e. Pearson Education India.
- Ji H. 2010. Challenges from information extraction to information fusion. Coling 2010: posters.
- Jiang D, Huang Y, Zhuang D, Zhu Y, Xu X, Ren H. 2012. A simple semi-automatic approach for land cover classification from multispectral remote sensing imagery.
- Kesikoglu MH, Atasever UH, Dadaser-Celik F, Ozkan C. 2019. Performance of ANN, SVM and MLH techniques for land use/cover change detection at Sultan Marshes wetland, Turkey. Water Sci Technol. 80(3):466–477. doi: 10.2166/wst.2019.290.
- Kruse FA, Lefkoff A, Boardman J, Heidebrecht K, Shapiro A, Barloon P, Goetz A. 1993. The spectral image processing system (SIPS)‐interactive visualization and analysis of imaging spectrometer data. Remote Sens Environ. 44(2–3):145–163. doi: 10.1016/0034-4257(93)90013-N.
- Kumar M, Denis DM, Singh SK, Szabó S, Suryavanshi S. 2018. Landscape metrics for assessment of land cover change and fragmentation of a heterogeneous watershed. Remote Sens Appl: Soc Environ. 10:224–233. doi: 10.1016/j.rsase.2018.04.002.
- Kusetogullari H, Yavariabdi A. 2018. Unsupervised change detection in landsat images with atmospheric artifacts: a fuzzy multiobjective approach. Math Prob Eng. 2018:1–16. doi: 10.1155/2018/7274141.
- Liu G, Chen W, Ling W. 2005. An image fusion method based on directional contrast and area-based standard deviation. Electronic Imaging and Multimedia Technology IV. International Society for Optics and Photonics.
- Liu D, Yu J. 2009. Otsu method and K-means. In 2009 Ninth International Conference on Hybrid Intelligent Systems. IEEE.
- Lu D, Mausel P, Brondizio E, Moran E. 2004. Change detection techniques. Int J Remote Sens. 25(12):2365–2401. doi: 10.1080/0143116031000139863.
- Lunetta RS, Knight JF, Ediriwickrema J, Lyon JG, Worthy LD. 2006. Land-cover change detection using multi-temporal MODIS NDVI data. Remote Sens Environ. 105(2):142–154. doi: 10.1016/j.rse.2006.06.018.
- Ma L, Li M, Blaschke T, Ma X, Tiede D, Cheng L, Chen Z, Chen D. 2016. Object-based change detection in urban areas: the effects of segmentation strategy, scale, and feature space on unsupervised methods. Remote Sens. 8(9):761. doi: 10.3390/rs8090761.
- Martinez M, Martinez ME, Martinez E, Renza D. 2017. Detection of changes in natural aquifer reservoirs based on the index of drought. IEEE Latin Am Trans. 15(11):2059–2063. doi: 10.1109/TLA.2017.8070408.
- Miller A, Bryant E, Birnie R. 1998. An analysis of land cover changes in the Northern Forest of New England using multitemporal Landsat MSS data. Int J Remote Sens. 19(2):245–265. doi: 10.1080/014311698216233.
- Mishra S, Shrivastava P, Dhurvey P. 2017. Change detection techniques in remote sensing: a review. IJWMCIS. 4(1):1–8. doi: 10.21742/ijwmcis.2017.4.1.01.
- Nemmour H, Chibani Y. 2006. Multiple support vector machines for land cover change detection: an application for mapping urban extensions. ISPRS J Photogramm Remote Sens. 61(2):125–133. doi: 10.1016/j.isprsjprs.2006.09.004.
- Otsu N. 1979. A threshold selection method from gray-level histograms. IEEE Trans Syst Man Cybern. 9(1):62–66. doi: 10.1109/TSMC.1979.4310076.
- Pacifici F, Del Frate F, Solimini C, Emery WJ. 2007. An innovative neural-net method to detect temporal changes in high-resolution optical satellite imagery. IEEE Trans Geosci Remote Sens. 45(9):2940–2952. doi: 10.1109/TGRS.2007.902824.
- Parihar SM, Sarkar S, Dutta A, Sharma S, Dutta T. 2013. Characterizing wetland dynamics: a post-classification change detection analysis of the East Kolkata Wetlands using open source satellite data. Geocarto Int. 28(3):273–287. doi: 10.1080/10106049.2012.705337.
- Petry LM, Soares A, Bogorny V, Matwin S. 2019. Unsupervised behavior change detection in multidimensional data streams for maritime traffic monitoring. arXiv preprint arXiv:190805103.
- Pillai KG, Vatsavai RR. 2013. Multi-sensor remote sensing image change detection: an evaluation of similarity measures. In 2013 IEEE 13th International Conference on Data Mining Workshops; IEEE.
- Renza D, Martinez E, Arquero A. 2013. A new approach to change detection in multispectral images by means of ERGAS index. IEEE Geosci Remote Sens Lett. 10(1):76–80. doi: 10.1109/LGRS.2012.2193372.
- Renza D, Martinez E, Molina I, Ballesteros L DM. 2017. Unsupervised change detection in a particular vegetation land cover type using spectral angle mapper. Adv Space Res. 59(8):2019–2031. doi: 10.1016/j.asr.2017.01.027.
- Richards JA, Jia X. 1999. Remote sensing digital image analysis. Vol. 3. Verlag Berlin Heidelberg: Springer.
- Ridd MK, Liu J. 1998. A comparison of four algorithms for change detection in an urban environment. Remote Sens Environ. 63(2):95–100. doi: 10.1016/S0034-4257(97)00112-0.
- Schaum A, Stocker A. 1995. Chronochrome image processing for infrared target detection. IRIS Specialty Group on Targets Backgrounds and Discrimination. 1.
- Schaum A, Stocker A. 2003. Linear chromodynamics models for hyperspectral target detection. 2003 IEEE Aerospace Conference Proceedings (Cat No 03TH8652); IEEE.
- Schreier H, Orteu J-J, Sutton MA. 2009. Image correlation for shape, motion and deformation measurements: basic concepts, theory and applications. Vol. 1. New York, USA: Springer.
- Serra P, Pons X, Saurí D. 2003. Post-classification change detection with data from different sensors: some accuracy considerations. Int J Remote Sens. 24(16):3311–3340. doi: 10.1080/0143116021000021189.
- Sharma M, Batra A. 2014. Analysis of distance measures in content based image retrieval. Global Journal of Computer Science and Technology. 14(2).
- Sharma S, Sharma B. 2019. Thresholding algorithms for image segmentation-entropy based comparison. Glob J Enterp Inf Syst. 11(4):19–23.
- Sheoran A, Haack B. 2014. Optical and radar data comparison and integration: Kenya example. Geocarto Int. 29(4):370–382. doi: 10.1080/10106049.2013.769027.
- Singh A. 1989. Review article digital change detection techniques using remotely-sensed data. Int J Remote Sens. 10(6):989–1003. doi: 10.1080/01431168908903939.
- Singh SK, Laari PB, Mustak S, Srivastava PK, Szabó S. 2018. Modelling of land use land cover change using earth observation data-sets of Tons River Basin, Madhya Pradesh, India. Geocarto International. 33(11):1202–1222. doi: 10.1080/10106049.2017.1343390.
- Singh A, Singh KK. 2018. Unsupervised change detection in remote sensing images using fusion of spectral and statistical indices. Egypt J Remote Sens Space Sci. 21(3):345–351. doi: 10.1016/j.ejrs.2018.01.006.
- Sun J, Ongsomwang S. 2020. Multitemporal land use and land cover classification from time-series landsat datasets using harmonic analysis with a minimum spectral distance algorithm. IJGI. 9(2):67. doi: 10.3390/ijgi9020067.
- Szabó S, Novák T, Elek Z. 2012. Distance models in ecological network management: a case study of patch connectivity in a grassland network. J Nat Conserv. 20(5):293–300. doi: 10.1016/j.jnc.2012.06.002.
- Theiler J. 2008. Quantitative comparison of quadratic covariance-based anomalous change detectors. Appl Opt. 47(28):F12–F26. doi: 10.1364/ao.47.000f12.
- Toosi NB, Soffianian AR, Fakheran S, Pourmanafi S, Ginzler C, Waser LT. 2019. Comparing different classification algorithms for monitoring mangrove cover changes in southern Iran. Global Ecol Conserv. 19:e00662. doi: 10.1016/j.gecco.2019.e00662.
- Touati S, Naylor M, Main I. 2016. Detection of change points in underlying earthquake rates, with application to global mega-earthquakes. Geophys J Int. 204(2):753–767.
- Tullis JA, Jensen JR. 2003. Expert system house detection in high spatial resolution imagery using size, shape, and context. Geocarto International. 18(1):5–15. doi: 10.1080/10106040308542258.
- Tung F, LeDrew E. 1988. The determination of optimal threshold levels for change detection using various accuracy indexes. Photogramm Eng Remote Sens. 54(10):1449–1454.
- Van Dongen S, Enright AJ. 2012. Metric distances derived from cosine similarity and Pearson and Spearman correlations. arXiv preprint arXiv:12083145.
- Virk R, King D. 2006. Comparison of techniques for forest change mapping using Landsat data in Karnataka, India. Geocarto Int. 21(4):49–57. doi: 10.1080/10106040608542402.
- Wu D, Yuan C. 2022. Threshold image segmentation based on improved sparrow search algorithm. Multimed Tools Appl. 81(23):33513–33546. doi: 10.1007/s11042-022-13073-x.
- Yan L, Xia W, Zhao Z, Wang Y. 2018. A novel approach to unsupervised change detection based on hybrid spectral difference. Remote Sens. 10(6):841. doi: 10.3390/rs10060841.
- Yang X, Lo C. 2002. Using a time series of satellite imagery to detect land use and land cover changes in the Atlanta, Georgia metropolitan area. Int J Remote Sens. 23(9):1775–1798. doi: 10.1080/01431160110075802.
- You Y, Cao J, Zhou W. 2020. A survey of change detection methods based on remote sensing images for multi-source and multi-objective scenarios. Remote Sens. 12(15):2460. doi: 10.3390/rs12152460.
- Yousefi S, Mirzaee S, Tazeh M, Pourghasemi H, Karimi H. 2015. Comparison of different algorithms for land use mapping in dry climate using satellite images: a case study of the Central regions of Iran. Desert. 20(1):1–10.
- Yuan F, Sawaya KE, Loeffelholz BC, Bauer ME. 2005. Land cover classification and change analysis of the Twin Cities (Minnesota) Metropolitan Area by multitemporal Landsat remote sensing. Remote Sens Environ. 98(2–3):317–328. doi: 10.1016/j.rse.2005.08.006.
- Zakeri F, Saradjian MR. 2022. Change detection in multispectral images based on fusion of change vector analysis in posterior probability space and posterior probability space angle mapper. Geocarto Int. 37(5):1450–1464. doi: 10.1080/10106049.2020.1768595.
- Zewdie W, Csaplovies E. 2015. Remote sensing based multi-temporal land cover classification and change detection in northwestern Ethiopia. Eur J Remote Sens. 48(1):121–139. doi: 10.5721/EuJRS20154808.