
 ?Mathematical formulae have been encoded as MathML and are displayed in this HTML version using MathJax in order to improve their display. Uncheck the box to turn MathJax off. This feature requires Javascript. Click on a formula to zoom.
Abstract
This study addresses a crucial gap in our understanding of flooding in the predominantly agricultural Qaa’Jahran watershed in Yemen, where urbanization, though currently limited in extent, is rapidly expanding. We aim to discern the effects of earth fissures on flood dynamics, particularly focusing on their present significance. It is noteworthy that, in the long run, these fissures are anticipated to accumulate soil and sediment, potentially heightening the risk of future flooding. To achieve this, we developed a comprehensive floodplain delineation model, incorporating field observations and rainfall data from the Integrated Multi-satellitE Retrievals for GPM (IMERG) algorithm. Additionally, advanced hydrologic and hydraulic models were integrated to accurately simulate runoff hydrographs and create flood inundation maps. Our findings underscore the considerable influence of earth fissures, effectively mitigating runoff volume, peak discharge, flood depths and inundated areas during storm events. It is imperative to emphasize that specific areas remain persistently vulnerable, with water levels surpassing one meter during historical floods. This reinforces the ongoing risk of flooding in targeted zones and emphasizes the necessity of implementing tailored flood management strategies. In conclusion, this study makes a significant contribution to the field, providing a comprehensive analysis of the intricate factors influencing flooding in the Qaa’Jahran watershed. The integration of flood inundation mapping, advanced hydrologic modelling and meticulous consideration of earth fissures offers a distinctive perspective on flood dynamics in a rapidly evolving and urbanizing environment. Furthermore, it highlights the critical implications for effective flood risk management and urban planning, not only in the Qaa’Jahran watershed but also in similar urbanizing regions worldwide.
1. Introduction
In the realm of natural disasters, few rival the devastating impact of flash floods, wreaking havoc on lives, property and infrastructure globally (Zanchetta and Coulibaly Citation2020; Al-Areeq et al. Citation2021a; Janizadeh et al. Citation2019; Ali et al. Citation2020). With an annual toll of approximately 200 million affected and a staggering 100,000 fatalities recorded between 1990 and 2000, the relentless surge of floods is poised to intensify, propelled by the inexorable forces of global climate change (Jonkman Citation2005; Salinger Citation2005; WMO Citation2011; Mu et al. Citation2021). This pressing issue is further underscored by the findings of Jha et al. (Citation2012), who reported that approximately 178 million people were impacted by floods in 2010 alone, with projected damages of about $40 billion during 1998–2010.
Several studies significantly contributed to our understanding of flood dynamics and risk assessment, providing valuable insights that resonate with the core objectives of this study. Two-dimensional hydrodynamic models are increasingly being used to develop more accurate and efficient flood forecasting systems. Sharifian et al. (Citation2023) introduce a new method for parallelized flood simulations on graphical processing units (GPUs), which can significantly speed up 2D hydrodynamic models. This allows for faster flood inundation modelling to be done for both urban and entire watersheds. David et al. (Citation2023) investigate the impact of catchment hydrological processes on flood modelling with Hydrologic Engineering Center- river analysis system (HEC-RAS), finding that integrating an event-based interflow approach can improve the accuracy of model results. This is important because catchment hydrological processes can play a significant role in flood dynamics. Barbero et al. (Citation2022) use an integrated 2D-SWEs model to study the variability of lag time in small basins, demonstrating the potential of a physically-based approach for analysing the watershed response time. This is important because lag time is a key factor in flood forecasting and early warning systems. García-Alén et al. (Citation2022) study the impact of DTM resolution and mesh size on the results and runtime of a 2D shallow water equation-based hydrological model, finding that vertical accuracy is more important than horizontal resolution and that mesh resolutions greater than 25 m can provide comparable results to higher resolutions. This is important because it can help reduce the computational cost of 2D hydrodynamic models without sacrificing too much accuracy. Overall, these studies demonstrate the potential of 2D hydrodynamic models for improving flood risk mapping and flood forecasting. These studies collectively contribute to a comprehensive body of knowledge, enriching our ability to model, predict and mitigate flood risks in regions vulnerable to inundation events.
Land subsidence and earth fissures can have a significant impact on flood dynamics. Jiang et al. (Citation2023) developed the Depression-Preserved DEM Processing (D2P) algorithm to preserve surface depressions in digital elevation models (DEMs). This is important because surface depressions can play a role in flood dynamics by storing water and routing floodwaters. CosTableile et al. (2022) evaluated the effects of DEM depression filling on the structure of simulated flow networks and hydrologic response of watersheds. They found that DEM depression filling can have a significant impact on the simulation of flood dynamics. Overall, these studies demonstrate that land subsidence and earth fissures can have a significant impact on flood dynamics and flood risk. It is important to consider these factors when modelling flood dynamics and developing flood risk management strategies.
Several works significantly contribute to our understanding of flood dynamics and risk assessment, providing valuable insights that resonate with the core objectives of this study. The work highlighted in Sharifian et al. (Citation2023) presents a novel modelling approach, offering a powerful tool to simulate and analyse flood events. Furthermore, David et al. (Citation2023) delve into the socio-economic aspects of flood impacts, shedding light on the broader implications for affected communities. Meanwhile, the studies outlined in Barbero et al. (Citation2022) and García-Alén et al. (Citation2022) delve into the hydrological intricacies of flood events, providing crucial insights into factors that influence flood behaviour. Additionally, Jiang et al. (Citation2023) delve into innovative methods for flood risk assessment, offering a fresh perspective on how to approach this complex issue. Finally, the work highlighted in CosTableile et al. (2022) explores the dynamic interplay between geological factors and flood hazards, uncovering a critical dimension in our understanding of flood risk. These studies collectively contribute to a comprehensive body of knowledge, enriching our ability to model, predict and mitigate flood risks in regions vulnerable to inundation events.
Yemen, a crucible of diverse natural hazards including tsunamis, earthquakes, volcanic eruptions, and landslides, is no stranger to the ruthless force of floods. They emerge as the preeminent, recurrent and devastating catastrophe in this region (GFDRR 2010; Guha-Sapir et al. Citation2016). Projections of increased rainfall patterns amplify the potential for future cataclysms, casting a foreboding shadow over the nation’s resilience. This volatile scenario exacts a heavy toll, with an annual average economic loss of $70 million, underscoring the exigency for comprehensive mitigation strategies (GFDRR 2010). Furthermore, Breisinger et al. (Citation2012) indicated that 19 floods or flash floods had affected Yemen over the last two decades, revealing the urgent need for robust disaster risk management.
In the heart of Yemen lies the Qaa’Jahran basin, an agricultural and water resource bastion that has borne witness to an unprecedented surge in urbanization. This transformation has ushered in a new era of flood dynamics, primarily triggered by swift thunderstorms culminating in flash floods. The basin experiences dual peaks of rainfall during the spring and summer seasons, contributing to its unique hydrological profile. Simultaneously, it grapples with its identity as a tectonically active zone, heavily reliant on groundwater for sustenance and agriculture. This intricate interplay has unleashed an ominous cascade of land subsidence and earth fissures, intensifying the region’s vulnerability (Al-Areeq et al. Citation2016; Al-Masnay et al. Citation2022). The impact of tectonic movement and groundwater depletion on the basin’s susceptibility to flooding has been highlighted in the work of Al-Areeq et al. (Citation2016) and Al-Masnay et al. (Citation2022).
Yet, conducting meticulous impact assessments and formulating flood risk mitigation strategies in arid regions such as Yemen remains a Herculean task, largely due to the dearth of in-situ data. In the face of this formidable challenge, the inexorable imperative for ongoing research and strategic planning persists. This clarion call resounds particularly in the Qaa’Jahran watershed, where anthropogenic activities, notably urban expansion and agricultural practice shifts, have wrought transformative changes to the basin’s natural drainage patterns, rendering it more susceptible to the capricious forces of flooding. Moreover, the looming specter of climate change looms large, poised to exacerbate the likelihood of inundation events in the region. Recent surges of catastrophic floods in Qaa’Jahran serve as a stark reminder of the urgent need for an astute, region-specific flood risk management blueprint.
In response to this clarion call, this study embarks on a pioneering odyssey – the development of a hydrologic, hydraulic and floodplain model for the Qaa’Jahran region. At its heart lies an unwavering focus on assimilating the impact of earth fissures as a potent yet often underestimated natural phenomenon. Harnessing the power of enhanced field survey data, our mission is to not only simulate major historical floods but also to unearth their hydrological essence. This research venture leverages the HEC-Hydrologic Modelling System (HMS) and HEC-RAS models in a ground breaking exploration of the interplay between earth fissures and flood risk maps.
2. Study area and data exploration
2.1. Study area and data
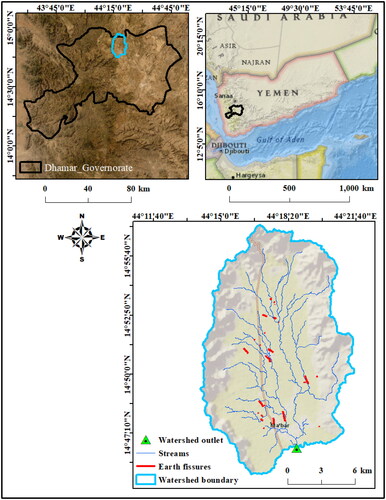
The study area is one of the important basins in Yemen that is frequently affected by flash floods. It is in the Central Highland Plains of Yemen, in the west of the country (). It belongs to the Dhamar government. The 209.68 km2 drainage area of the partially urbanized Qaa’Jahran watershed was selected for this study. It is located around 55 km from Sana’a, the country’s capital. The study region is between 2322 and 2925 m above the mean sea level. It is between latitudes 14° 40′ 00″ and 14°56′ 50″ north and longitudes 44°13′ 45″ and 44°22′ 30″ east. Lately, and during the last few years, flash floods have hit Mabar city and the surrounding villages in the northern part of Qaa’Jahran, causing severe damage to public and private facilities (Al-Areeq et al. Citation2023). The town of Mabar and the surrounding villages occupy approximately 1.3% of the study area. In 2004, the population of Qaa’Jahran was estimated to be 86,590 and reached to 117,762 in 2016, with an annual population growth rate of 3%. shows the location of Qaa’Jahran on the map of the Dhamar government and the Mabar Plain watershed. It also shows the distribution of the earth fissures within the study area.
Figure 1. The northern part of Qaa’Jahran location.
During the rainy season, the study area is affected by heavy rain, leading to flash floods and causing damage to the homes and land in the flooded areas. In addition, cutting off and blocking the main and secondary roads and streets leading to and from these areas are the results of these rainfall events. Further, large areas of agricultural land are frequently damaged, and their crops are destroyed, either by the heavy rains, which led to soil erosion, or by flooding the agricultural land.
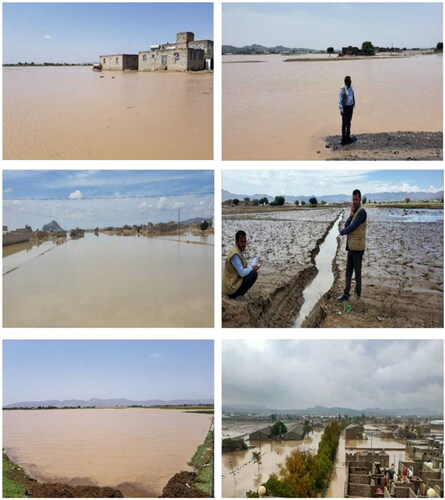
On 22 February 2006, Qaa’Jahran experienced severe flash floods from thunderstorm rains. The Yemen Red Crescent Society’s (YRCS Citation2007) evaluation report estimated that six deaths occurred due to the 2006 flood, and 692 people were affected. In addition, more than 832 homes were damaged or destroyed. Furthermore, vast agricultural land (fertile farming) was inundated by flood water, causing livestock losses, including farm animals and chickens. Recently, on 17 August 2022, Qaa’Jahran was hit by a flash flood, causing serious damage to the infrastructure (). The field visits were conducted in the study area to assess the sites affected by the flash floods. A detailed survey questionnaire assessed and collected information from 19 locations. These sites required urgent intervention to implement mitigation plans for reducing this damage. It was noted that many existing homes were built near the passage of the torrents, as in the Almajarah area. Along with other homes in the area, they were subjected to erosion from torrential rainfall events. A number of homes had cracks develop and collapsed due to water inundation from all sides and for prolonged periods.
Figure 2. A general view of the flooded area following the heavy rain in Qaa’Jahran caused by the 17 August 2022 storm, a significant portion of flood water is contained in earth fissures.
2.1.2. The basin topography
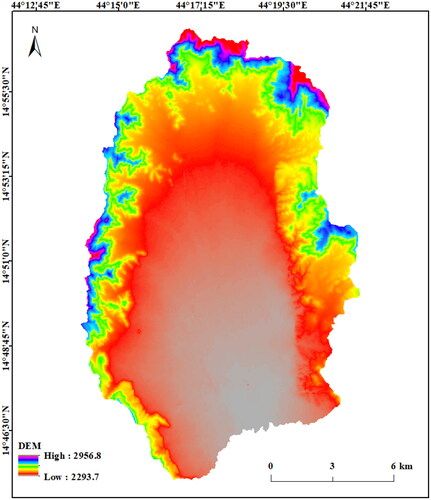
Topographic information for the study area was obtained using a 20-m-resolution DEM from the remote sensing centre in Yemen. The data was used to develop the watershed model components to find the peak discharge and runoff volume in the HEC-HMS model and the geometrical data to estimate the flood depths in the HEC-RAS model ().
Figure 3. Qaa’Jahran digital elevation model (DEM).
2.2. Soil type and land use
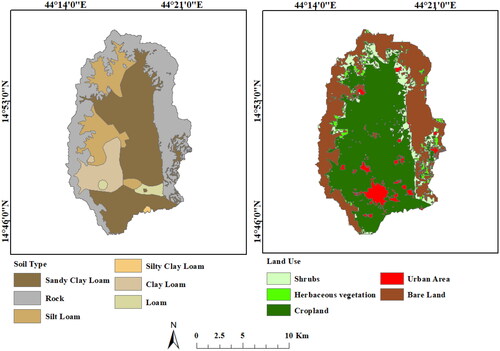
Datasets on soil type and land use were utilized to provide curve number (C.N.) values for the research area’s sub-basin. A digital soil map of Qaa’Jahran was created using the GIS interpolation technique based on the data provided by the Agriculture Research and Extension Authority (AREA), Yemen. The soil map was used to develop curve numbers for the sub-basins (). The land use/cover data () was obtained from the Copernicus Global Land Service data portal (https://land.copernicus.eu/global/content/annual-100m-global-land-cover-maps-available), and adjustments were made after comparison with aerial photographs. also represents land use and cover developed based on the satellite image and the field survey.
Figure 4. Soil type and land use.
2.3. Rainfall data
A semi-arid climate with low average rainfall and high intensity characterizes the study area. The annual average rainfall at the nearest rain gauge station to the study area is about 376 mm. Rainfall occurs during two main seasons each year. The first season extends from mid-February to mid-May and is the season with the heaviest and most voluminous rain. The second season extends from early July to mid-September and is characterized by rainfall of equal intensity to that of the first season but of lower volume. shows the effect of climatic factors on the seasonal runoff resulting from rain. The ratio of rainfall to runoff and evapotranspiration during the two main seasons ranges from 0.36 to 0.38, indicating that a significant portion of water from the light and moderate rainstorms is lost through evapotranspiration.
Table 1. The climatic factors in the study area during the two main rainfall seasons.
The model estimated rainfall events using the 24 h of the 100, 50, 25, 10, 5, and 2-year events and a cumulative precipitation time series conforming to the Soil Conservation Service (SCS) Type II dimensionless unit hydrograph (AL-Areeq et al. Citation2021). The design rainfall depths are displayed in as a function of the selected return periods. The produced IDF curves from the Gumbel approach were used to estimate these depths. Based on the Type II rainfall distribution of the Natural Resources Conservation Service (NRCS), which is suited for dry and semi-arid locations, depicts the hourly distribution of 24 h, which corresponds to a return period of 100 years for the Qaa’Jahran watershed. shows the temporal distribution of the 17 August 2022, storm event.
Figure 5. The 6-min hyetograph for the 100-year storm.
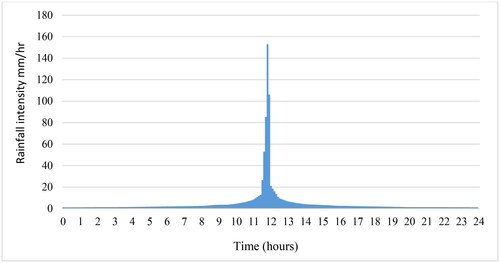
Figure 6. The temporal distribution of the 17 August 2022, storm event.
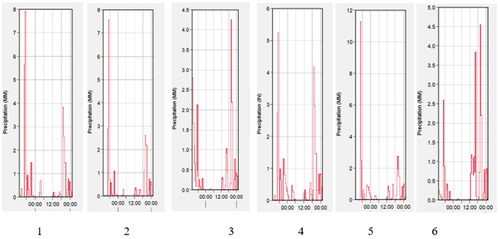
Table 2. Design storm for Qaa’Jahran Rusaba station.
3. Methodology
Determining the boundary of a floodplain for a specific return period requires interacting models and factors, which makes floodplain delineation challenging. Hydrologic, hydraulic and water surface interpolation models should be combined to delineate the floodplain.
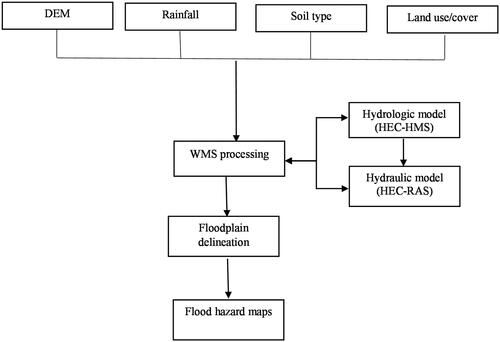
HEC-HMS and RAS tools were chosen for this study. Both the HEC-RAS (USACE Citation2010) and the HEC-HMS (Scharffenberg Citation2013) are frequently used in flood modelling. They are freely accessible tools. The watershed modelling system (WMS Citation2018) software packages and remote sensing data processing systems (HEC-GeoHMS) (USACE Citation2013) and HEC-GeoRAS (USACE Citation2010), as well as the geographic information system (GIS), were utilized to prepare the input data sets and post-process the models’ output. summarizes the steps in developing and constructing the flood model for the northern part of the Qaa’Jahran watershed. First, the hydrologic model was built to execute the hydraulic model. Next, a floodplain was delineated to generate the flood hazard maps for the investigated area.
Figure 7. A Flowchart illustrating the phases in the investigation of the floodplain.
The methodology can be divided into three main steps, which are as follows:
Hydrological modelling and simulation
Hydrodynamic modelling using HEC-RAS
Floodplain delineation and flood depth mapping
3.1. Hydrological modelling and simulation
A physically-based hydrological model that includes a set of non-linear partial differential equations was required to model the runoff process in high resolution. Since these equations cannot be solved analytically and their numerical solutions are beyond the existing GIS function, HEC-HMS was used in this study to model the runoff process. The HEC of the U.S. Army Corps of Engineers created the HEC-HMS program to model precipitation-runoff processes with various infiltration losses (Scharffenberg Citation2013). Peak flows were calculated using the USDA SCS runoff curve number technique (SCS-CN) based on the soil type, hydrologic soil group and land use (SCS Citation1986). In semi-arid and arid areas, the SCS-CN is commonly employed. It has a high degree of accuracy in watersheds without flood measurements, and it is also the widely used technique to calculate runoff quantities (Ponce and Hawkins Citation1996; Shrestha Citation2003).
To calculate the volumes of the runoff peak flows, many models employ the runoff ‘curve number’ approach developed by the USDA SCS (SCS Citation1986). The method can be expressed as follows:
where A is the drainage area (km2), Tp is the time of the rise of the flood hydrograph (hours), Δt is the duration of the excess precipitation (hours) and tlag is lag time (hours), where Qr is direct runoff (mm), P is rainfall (mm), Sr is the potential difference between direct runoff and rainfall (mm), C.N. is the curve number, Qp is the peak discharge for one unit of excess rainfall (m3/s), and A is the drainage area (km2).
WMS and HEC-GeoHMS were combined to compute the composite C.N.s for HEC-HMS based on the geometric characteristics, soil type and land use data. The NRCS created four synthetic rainfall distributions based on the recorded precipitation events, which are then used in the SCS hypothetical storm approach. Rainfall intensities are distributed in each of the four distributions to optimize peak runoff for a whole storm depth. The four distributions represent different geographical regions (SCS Citation1986).
To create a hydrologic model, which is crucial for defining the watershed and computing basin characteristics, including the watershed area, lag time, concentration time, slope and centroid, the first step is to collect elevation data. HEC-GeoHMS and WMS were integrated to compute the composite C.N.s for HEC-HMS based on the geometric parameters and information from the soil type and land use data. The following relation was used to calculate the basin lag time for each sub-basin using SCS (WMS Citation2018):
(4.4)
(4.4)
where C.N. is the runoff curve number, y is the average watershed land slope (%), L is the lag time (hour) and l is the hydraulic length of the watershed (feet).
HEC-HMS has five channel routing methods. The one used in this study was the Muskingum routing method. The Muskingum routing method uses a straightforward finite difference approximation technique to resolve the following equations (USACE Citation2013):
K and X are parameters based on the channel and flow characteristics, and O and I are the outflow and inflow, respectively.
The hydrologic model was generated using HEC-GeoHMS, which uses terrain data as a DEM. HEC-GeoHMS, an extension of GIS Arc-View, creates HEC-HMS input files in the form of a stream network, sub-basin boundaries, and connectivity of various hydrologic elements through a series of steps known as terrain pre-processing and basin processing. The HEC-HMS basin schematic and map file were imported into HEC-HMS.
HEC-HMS has three data components: the basin model, the meteorological model and the control specification. The basin model was generated within HEC-GeoHMS and was imported by HEC-HMS. The meteorological model and control specification were developed inside HEC-HMS. The 24-h design rainfall depths for return periods of 10, 25, 50, and 100 years were extracted from Rusaba station IDF curves and used in the HEC-HMS model to predict the peak rainfall intensity. The SCS Curve Number (C.N.) loss rate option in HEC-HMS was used to generate the runoff volumes for each sub-area in the catchment. The SCS Dimensionless Unit Graph was used to distribute the runoff volume to a unit hydrograph. The Muskingum Routing method was used to route runoff through the catchment. The peak runoff rate was extracted from the design storm hydrograph and utilized with the HEC-RAS hydraulic model to develop the flood inundation map of the study area.
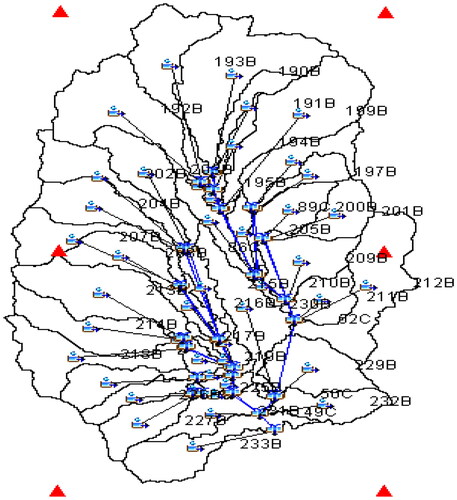
The maximum accuracy was achieved using the 6-min resolution of time intervals as rainfall input in HEC-HMS. For HEC-HMS to be executed, all necessary data must be stored in a single file. HEC-HMS imported this data to run the model, as seen in .
Figure 8. HEC-HMS basin model and GPM stations (red triangle) of the Qaa’Jahran watershed.
3.2. Hydrodynamic modelling using HEC-RAS
The water surface profile is determined using a one-dimensional numerical model called HEC-RAS, developed by the Hydrological Engineering Center of the U.S. Army Corps. HEC-RAS is a robust programme used extensively in floodplain research and hydraulic modelling (USACE Citation2010). It can mimic numerous hydraulic structures and is used to represent one-dimensional steady and unsteady river flow. In HEC-RAS, water depths and water surface heights are calculated using three primary equations (the continuity, energy and Manning equations), based on which flood mapping and floodplain delineation may be carried out. Based on an iterative energy equation solution, the water surface profile for a gradually changing flow is calculated for two neighbouring cross-sections.
where α1 and α2 are velocity weighting coefficients, V1 and V2 are longitudinal flow velocities (m/s), g is the gravitational acceleration (m/s2), Y1 and Y2 are the water depth at cross sections (in m) and Z1 and Z2 are the main channel invert elevations (m). This formula is used to get the total head loss, hl:
where ho is the small loss brought on by the channel’s expansion or contraction, and hf is the head loss from friction.
Floodplain visualization uses HEC-GeoRAS, an extension compatible with ArcView, and acts as an interface between the hydrodynamic model and the graphical software. HEC-GeoRAS can prepare geometric data for import into HEC-RAS and process simulation results exported from HEC-RAS into ArcView. The geometric data of the floodplain and stream are abstracted from the terrain elevation model to execute the hydrodynamic model. The water surface profiles for floods of three identified return periods are then computed with sub-critical flow simulation along the river reach under study. Finally, an export file was created in HEC-RAS to work with the DEM.
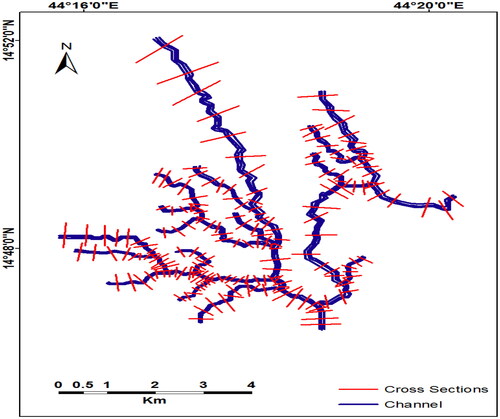
shows the hydraulic model’s geometry, including the cross sections and basin reaches. The necessary boundary conditions were then input to determine the beginning water surface at the basin channel’s ends. HEC-RAS uses this starting water surface to begin the computation. Then, using HEC-HMS, the peak discharges were created and put into HEC-RAS. The floodplain boundary was established using the extracted HEC-RAS simulation data from WMS.
Figure 9. Sections and main reaches of the study area watershed.
3.3. Floodplain delineation and flood depth mapping
The water profiles generated in HEC-RAS are exported into the ArcMap platform to visualize the inundated areas and flood depths on the terrain model. Digital data of important features such as roads, buildings, and cultivation are superimposed onto the DEM. The flood depths are then reclassified to fit the preferred classification, and the relevant details are added to the resulting map. Identifying the water depths at each section along the channel is necessary for floodplain delineation using HEC-RAS. A file containing the water depths obtained from HEC-RAS must be loaded into WMS. The scatter points containing the water surface elevations were interpolated to establish a more precise floodplain definition. The interpolated data were fed into the floodplain delineation models as input data. The inundated regions were finally represented as flood polygons on a prepared flood hazard map. To calculate the likelihood that floods will occur in the study area, the output of the flood delineation model was exported to GIS.
4. Results and discussions
We conducted a thorough analysis of flood extents for significant events in February 2006 and August 2022, as well as for recurrence intervals spanning 2, 5, 10, 25, 50 and 100 years. These selected events encapsulated a diverse range of intensities, incorporating both low-flow and high-flow scenarios, thereby enabling a comprehensive exploration of hydrological parameters. To validate our model, we leveraged post-event observations of high water marks, a crucial step in affirming the accuracy and efficacy of our approach. Typically, high-resolution terrain models were employed to scrutinize the landscape, facilitating the precise determination of the flooded area.
In line with established research (Fuentes-Andino et al., Citation2017), the scientific community acknowledges various spatial water level measurements. These encompass discernible markers such as fragments lodged in trees, residual traces of water along the floodplain, and discernible water lines etched onto building walls. While a degree of uncertainty may be inherent in these measurements, they nonetheless represent some of the most reliable indicators of past flood events.
4.1. The February 2006 storm event
We employed ground rainfall measurements from the Rusaba weather station to refine the satellite-based estimates for the February 2006 event, ensuring the accuracy of the IMERG products (Al-Areeq et al. Citation2021b). By comparing the ground gauge estimation with the Early IMERG data, we calculated a bias factor specific to the watershed. Subsequently, the Early IMERG product was fine-tuned and utilized as input for our developed model. The resulting simulated hydrograph at the study area’s outlet, as depicted in , displayed a peak discharge of 235 m3/s and a runoff volume of 1,370,100 m3. further illustrates the inundated areas and flood depth values, which are closely aligned with reports from media sources and field data collected during site visits.
Figure 10. Outlet hydrograph of the study area for the storm event of February 2006.
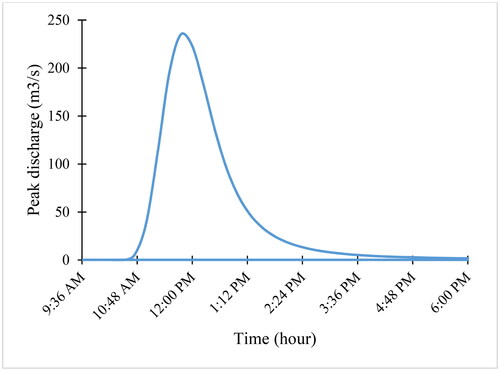
Figure 11. Flood risk map for (a) the entire watershed and (b) Mabar City.
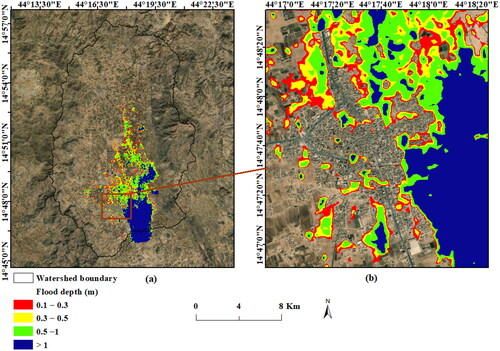
To validate the extent and depth of the inundation stemming from the rain event, we referenced limited high water marks observed on select buildings in Mabar City. Additionally, we gathered event information from newspapers, particularly concerning the extent of the inundation. A previous study in the same region corroborated the depths of inundation from this storm using specific high water marks. It was noted that depths in the critical section, where the highest level was recorded, reached up to 1.25 m, corresponding closely with the simulated depths for a 25-year return period flood (Ghanim A.A 2012).
vividly demonstrates that the maximum simulated water depths encompassed over 80% of the watershed’s inundated area. A substantial portion of Mabar City experienced water depths exceeding one meter, posing a significant threat to residents. According to the flood hazard assessment in Maba’ar City (Ghanim A.A 2012), the simulated inundated area corresponding to a flood with a return period of 25 years was estimated at approximately 3.26 km2. This aligns closely with the simulated results derived in our study, as depicted in . The floods in question, occurring on 22 February 2006, were notably more severe due to the convergence of intense precipitation and snowmelt in the peaks of the mountains during the winter.
4.2. The 17 August 2022, storm event
On 17 August 2022, a significant flood event led to extensive damage to large agricultural lands, properties, and crops. The Mabar rainfall station reported a total rainfall accumulation of 30 mm for this storm. In contrast, the early IMERG product recorded an average accumulation of 25.12 mm over the study area. This discrepancy between ground and satellite observations can be attributed to the fact that ground observations were reported for a specific point, whereas satellite data were an average of measurements from six stations.
presents the simulated flood inundation map alongside the inundated area reported by the Water Resources Authority, Dhamar-Albayda Branch. The observations from the Water Resources Authority and the simulation map for this storm exhibit good agreement, highlighting the extensive inundation and emphasizing the risk of flood events.
Figure 12. Flood inundation map developed by HEC-RAS model for 22 August 2022, storm event. The figure also shows the demarcation of the flooded areas based on the field survey conducted by the agricultural research Authority.
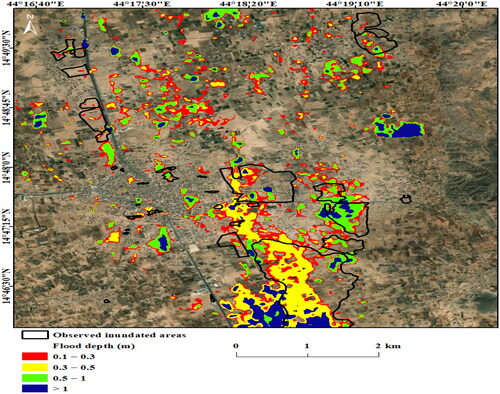
Despite the lower rainfall depth compared to the event on 22 February 2006, the storm of 17 August 2022, occurred during the peak rainfall month in the region and the second rainy season. The soil was already saturated prior to the intense storm, exacerbating the severity of the resulting flood. During this storm event, the influence of earth fissures was particularly notable, leading to a reduction in peak discharge by over 40% (). Specifically, the peak discharge and runoff volume, with the effect of earth fissures, were measured at 26.9 m3/s and 261,500 m3, respectively. In contrast, without the influence of earth fissures, these values were 40.1 m3/s and 405,100 m3, respectively, indicating differences in peak flow and runoff volume of 39.4% and 43.1%, respectively (). further illustrates how earth fissures possess the capacity to store large volumes of floodwater, significantly mitigating peak discharge and runoff volume.
Figure 13. Outlet hydrograph of the study area for the storm event of 17 August 2022.
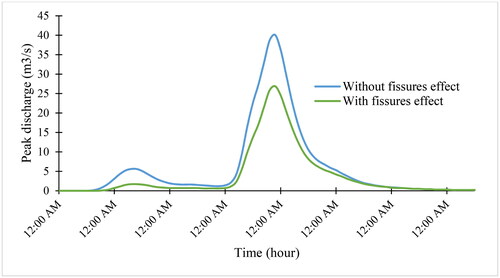
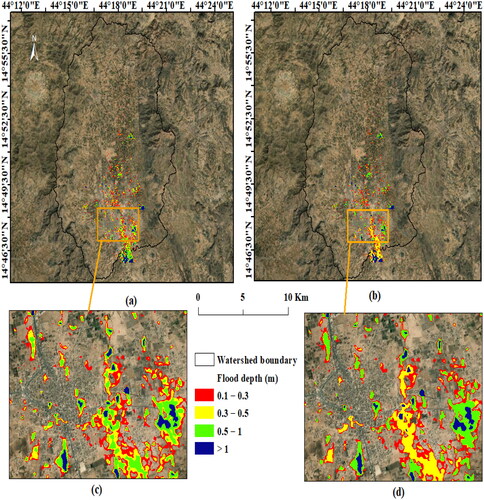
Figure 14. Flood risk map for the entire watershed (a) without the effect of earth fissures and (b) with the impact of earth fissures; (c) and (d) the same for Mabar City.
4.3. Simulations based on different design storms
provides a comprehensive overview of peak discharge values, runoff volumes and the associated differences for various return periods, both with and without the influence of earth fissures. This data is crucial for understanding the dynamic nature of flood events in the Qa’Jahran watershed.
Table 3. Runoff volume, peak discharge and the differences for different return periods.
In , the hydrographs at the outlet of the Qa’Jahran watershed are depicted for a 100-year return period, illustrating the significant impact of earth fissures on the hydrological response. This visual representation further emphasizes the role of earth fissures in mitigating flood hazards in the region. The findings of our study are in agreement with those of Navarro-Hernández et al.(Citation2023), who found that land subsidence can change the spatial patterns of flood risk by expanding and shifting flood inundation areas. This suggests that land subsidence is a significant factor that needs to be considered when designing flood risk management strategies and protection measures. This suggests that land subsidence is a factor that needs to be considered when planning for and responding to floods.
Figure 15. Outlet hydrograph of study area watershed for a return period of 100 years.
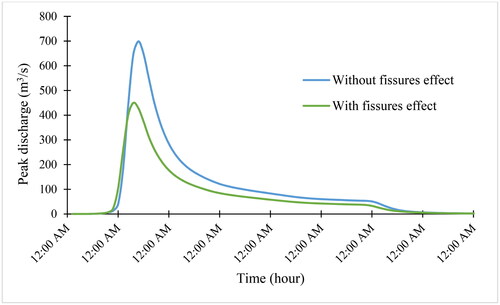
While earth fissures are commonly perceived as factors exacerbating flood hazards, it is noteworthy that in specific cases, such as in Qaa’Jahran, they can play a positive role by delaying floods and reducing associated risks. These natural fractures in the ground can extend down to the water table or aquifer below, enabling water infiltration during normal rainfall events. However, it is essential to recognize that earth fissures are not designed to accommodate the large volumes of water associated with floods. Allowing floodwater to enter these fractures is generally inadvisable, as it can lead to groundwater contamination, potentially rendering it unsafe for consumption and other purposes. Additionally, floodwater infiltration can cause erosion and destabilize the soil around the earth fissures, potentially resulting in their collapse and a subsequent loss of groundwater recharge capacity.
The inundation scenario modelling of the Qaa’Jahran basin provides crucial spatial information that underscores the imperative for relevant authorities to enhance their land-use planning programmes. Establishing a regulatory framework for sustainable planning and development and engaging various stakeholders from both the public and private sectors in consensus-building is paramount. Decision-makers in Qaa’Jahran must also consider future climate change scenarios and their potential impacts on decision-making processes. Studies conducted in Yemen suggest that low-lying areas in the Qaa’Jahran basin may face increased flood frequency under future climate change scenarios, with hotter and drier conditions potentially leading to higher rainfall-to-runoff yields and more intense rainfall events.
To effectively manage flood risks in the Qaa’Jahran Basin, it is crucial to implement a diverse range of flood management strategies. These may include constructing detention basins or retention ponds to temporarily store floodwaters and release them downstream in a controlled manner. Developing surface drainage systems, such as ditches or channels, to divert floodwaters away from vulnerable areas is also essential. Moreover, incorporating green infrastructure, like rain gardens or permeable pavement, can enhance infiltration and reduce surface runoff. Additionally, establishing flood warning systems and emergency response plans is vital for preparing residents and businesses to effectively respond to flood events.
In the Qaa’Jahran basin, expanding the number of gauges, particularly in sub-basins that are prone to flash floods in hilly regions, is imperative. Streamlining the process of recording water level data during flood events at multiple locations along the Qaa’Jahran basin is crucial for further calibration in future research endeavours. It is equally vital to conduct comprehensive studies in areas where flow alterations occur, including water extraction from floodwater during overland flow and losses from earth fissures to groundwater. Assessing the impacts of climate change and winter rainfall on flash floods is essential for informed flood risk management. Given the complex morphology of the Qaa’Jahran basin, we strongly advocate for the installation of a rainfall radar system to facilitate accurate spatial estimation of rainfall intensity. Moreover, to bolster future research efforts and serve as an integral component of the future early warning system in Qaa’Jahran, relevant authorities should ensure that real-time observations of rainfall intensity and depth are easily accessible to the public.
5. Conclusion
This study rigorously examined the influence of earth fissures on critical hydrological parameters, including runoff volume, peak discharge and flood risk mapping, in the northern region of Qaa’Jahran, Yemen. Additionally, it conducted a comprehensive assessment of flood hazards near the watershed’s outlet in Mabar and performed detailed rainfall frequency calculations for the entire study area.
Utilizing a combination of limited ground observations and rainfall data derived from the Integrated Multi-satellitE Retrievals for GPM (IMERG) algorithm, the study employed advanced simulation techniques to recreate historical and recent flood events, ultimately generating precise flood hazard maps. The widely recognized SCS-CN approach was employed for runoff estimation, with a strategic subdivision of the watershed into smaller sub-watersheds in the urban sector to refine runoff assessment. Through these simulations, hydrological and hydraulic models were employed to delineate flood inundation maps, accurately capturing the dynamics of storm events in 2006 and 2022.
The resultant inundation maps demonstrated notable congruence with data reported by the Water Resources Authority, Dhamar-Albayda Branch, based on field observations and media reports. Significantly, the findings underscored the considerable impact of earth fissures on diminishing peak discharge, runoff volume and flood inundation maps. However, it is imperative to note that we cautiously recommend against factoring in the influence of earth fissures in the proposed solution, given that these fissures are subject to soil infilling over time.
This study furnishes a robust foundation for policy-makers, emphasizing the urgency of implementing flood protection and mitigation strategies within the Qaa’Jahran basin. Such measures are paramount to safeguarding vulnerable populations in the event of a flood. Furthermore, this study highlights the potential for interdisciplinary collaboration between hydrologists, geologists, and emergency managers. Future endeavours in this domain could greatly benefit from synergies with complementary fields like remote sensing and machine learning, offering avenues to enhance the accuracy and timeliness of flood hazard mapping.
Authors’ contributions
Ahmed M. Al-Areeq: Conceptualization, methodology, resources, data curation, modelling, visualization, writing – original draft. Abdulnoor A. J. Ghanim: Conceptualization, methodology, reviewing and editing. Hatim O. Sharif: Conceptualization, methodology, reviewing and editing. Shakhawat Chowdhury: Conceptualization, methodology, reviewing and editing. Nabil M. Al-Areeq: Conceptualization, methodology, resources, reviewing and editing. Muhammad T. Rahman: Conceptualization and reviewing. Mohammed S. Al-Suwaiyan: Conceptualization, methodology, reviewing and editing. All authors reviewed and edited the drafts of the manuscript. All authors read and approved the final manuscript.
Acknowledgement
The authors would also like to acknowledge all the support provided by the Interdisciplinary Research Center for Membranes and Water Security at King Fahd University of Petroleum and Minerals.
Disclosure statement
No potential conflict of interest was reported by the authors.
Data availability statement
Not applicable.
References
- Al-Areeq NM, Albaroot M, Ahmad AHM, Alshayef MS. 2016. Tectonostratigraphy of Yemen and geological evolution: a new prospective. Int J New Technol Res. 2(2):19–33.
- Al-Areeq A, Al-Zahrani M, Chowdhury S. 2021. Rainfall Intensity–Duration–Frequency (IDF) curves: effects of uncertainty on flood protection and runoff quantification in Southwestern Saudi Arabia. Arab J Sci Eng. 46(11):10993–11007. doi: 10.1007/s13369-021-06142-0.
- Al-Areeq AM, Al-Zahrani MA, Sharif HO. 2021a. Physically-based, distributed hydrologic model for Makkah Watershed using GPM satellite rainfall and ground rainfall stations. 12(1):1234–1257.
- Al-Areeq AM, Al-Zahrani MA, Sharif HO. 2021b. The performance of physically based and conceptual hydrologic models: a case study for Makkah Watershed, Saudi Arabia. Water. 13(8):1098. doi: 10.3390/w13081098.
- Al-Areeq AM, Saleh RAA, Ghanim AAJ, Ghaleb M, Areeq NMAl, Al-Wajih E, Al E. 2023. Flood hazard assessment in Yemen using a novel hybrid approach of grey wolf and Levenberg Marquardt optimizers. Geocarto Int. 38(1):1–20. doi: 10.1080/10106049.2023.2243884.
- Ali SA, Parvin F, Pham QB, Vojtek M, Vojteková J, Costache R, Thuy Linh NT, Nguyen HQ, Ahmad A, Ali Ghorbani M. 2020. GIS-based comparative assessment of flood susceptibility mapping using hybrid multi-criteria decision-making approach, naïve bayes tree, bivariate statistics and logistic regression: a case of Topľa Basin, Slovakia. Ecol Indicat. 117:106620. doi: 10.1016/j.ecolind.2020.106620.
- Al-Masnay YA, Al-Areeq NM, Ullah K, Al-Aizari AR, Rahman M, Wang C, Zhang J, Liu X. 2022. Estimate earth fissure hazard based on machine learning in the QA’ Jahran Basin, Yemen. Sci Rep. 12(1):21936. doi: 10.1038/s41598-022-26526-y.
- Barbero G, Costabile P, Costanzo C, Ferraro D, Petaccia G. 2022. 2D hydrodynamic approach supporting evaluations of hydrological response in small watersheds: implications for lag time estimation. J Hydrol. 610:127870. doi: 10.1016/j.jhydrol.2022.127870.
- Breisinger C, Ecker O, Thiele R, Wiebelt M. 2012. The impact of the 2008 Hadramout flash flood in Yemen on economic performance and nutrition: a simulation analysis. Hindenburgufer. 66:24105.
- David A, Rodriguez ER, Schmalz B. 2023. Importance of catchment hydrological processes and calibration of hydrological-hydrodynamic rainfall-runoff models in small rural catchments. J Flood Risk Manag. 16(3):e12901. doi: 10.1111/JFR3.12901.
- Fuentes-Andino D,Beven K,Halldin S,Xu C-Y,Reynolds JE,Di Baldassarre G. 2017. Reproducing an extreme flood with uncertain post-event information. Hydrol Earth Syst Sci. 21(7):3597–3618. doi: 10.5194/hess-21-3597-2017.
- García-Alén G, González-Cao J, Fernández-Nóvoa D, Gómez-Gesteira M, Cea L, Puertas J. 2022. Analysis of two sources of variability of basin outflow hydrographs computed with the 2D shallow water model Iber: digital terrain model and unstructured mesh size. J Hydrol. 612:128182. doi: 10.1016/j.jhydrol.2022.128182.
- Global Facility for Disaster Reduction and Recovery. 2010. Probabilistic risk assessment studies in Yemen. Washington (DC): Global Facility for Disaster Reduction and Recovery.
- Guha-Sapir D, Below R, Hoyois P. 2016. EM-DAT: the CRED/OFDA international disaster database – Www.Emdat.Be– Université Catholique de Louvain – Brussels – Belgium. https://www.carismand.eu/resources/em-dat-the-credofda-international-disaster-database.html
- Janizadeh S, Avand M, Jaafari A, Phong TV, Bayat M, Ahmadisharaf E, Prakash I, Pham BT, Lee S. 2019. Prediction success of machine learning methods for flash flood susceptibility mapping in the Tafresh Watershed, Iran. Sustainability (Switzerland). 11(19):5426. doi: 10.3390/su11195426.
- Jha AK, Bloch R, Lamond J. 2012. Cities and flooding; a guide to integrated urban flood risk management for the 21st century. Electronic document. http://www.gfdrr.org/gfdrr/sites/gfdrr.org/files/urbanfloods/pdf/Cities and Flooding Guidebook.pdf.
- Jiang AL, Hsu K, Sanders BF, Sorooshian S. 2023. Topographic hydro-conditioning to resolve surface depression storage and ponding in a fully distributed hydrologic model. Adv Water Resour. 176:104449. doi: 10.1016/J.ADVWATRES.2023.104449.
- Jonkman SN. 2005. Global perspectives on loss of human life caused by floods. Nat Hazards. 34(2):151–175. doi: 10.1007/s11069-004-8891-3.
- Mu D, Luo P, Lyu J, Zhou M, Huo A, Duan W, Nover D, He B, Zhao X. 2021. Impact of temporal rainfall patterns on flash floods in Hue City, Vietnam. J Flood Risk Manag. 14(1):1–15. doi: 10.1111/jfr3.12668.
- Navarro-Hernández MI, Valdes-Abellan J, Tomás R, Tessitore S, Ezquerro P, Herrera G. 2023. Analysing the impact of land subsidence on the flooding risk: evaluation through InSAR and modelling. Water Resour Manage. 37(11):4363–4383. doi: 10.1007/s11269-023-03561-6.
- Ponce VM, Hawkins R. 1996. Runoff CN has it reached maturity? J Hydrol Eng. 1(1):11–19. doi: 10.1061/(ASCE)1084-0699(1996)1:1(11).
- Salinger M. 2005. Climate variability and change: past, present and future - an overview. Clim Change. 70(1–2):9–29. doi: 10.1007/s10584-005-5936-x.
- Scharffenberg WA. 2013. Hydrologic modeling system HEC-HMS - user’ s manual. p. 442. https://www.hec.usace.army.mil/software/hec-hms/documentation/HEC-HMS_Users_Manual_4.0.pdf
- Sharifian MK,Kesserwani G,Chowdhury AA,Neal J,Bates P. 2023. LISFLOOD-FP 8.1: new GPU-accelerated solvers for faster fluvial/pluvial flood simulations. Geosci Model Dev. 16(9):2391–2413. doi: 10.5194/gmd-16-2391-2023.
- Shrestha MN. 2003. Spatially distributed hydrological modelling considering land use changes using remote sensing and GIS. In Map Asia Conference (pp. 1–8). https://citeseerx.ist.psu.edu/document?repid=rep1&type=pdf&doi=966ebfedaf68053580a6ae38b7ac63967ac28322
- Soil Conservation Service (SCS). 1986. Urban hydrology for small watersheds (technical release 55). Washington (DC): US Department of Agriculture.
- USACE (United States Army Corps of Engineers). 2013. HEC-GeoHMS geospatial hydrologic modeling extension user’ s manual. Washington (DC): USACE.
- USACE. 2010. HEC river analysis system (HEC-RAS). User’s manual 4.1. USACE hydrologic engineering Center computer program documentation 68. Davis (CA): USACE.
- WMS. 2018. WMS user manual (V10. 1) the watershed modeling system. p. 1–738. http://wmsdocs.aquaveo.com/WMS_User_Manual_(v10.1).pdf
- World Meteorological Organization (WMO). 2011. Weather extremes in a changing climate: hindsight on foresight. Geneva, Switzerland: World Meteorological Organization.
- Yemen Red Crescent Society (YRCS). 2007. Yemen: floods. Vol. 41. Aden, Yemen: Yemen Red Crescent Society.
- Zanchetta ADL, Coulibaly P. 2020. Recent advances in real-time pluvial flash. Water. 12(2):570. doi: 10.3390/w12020570.