
 ?Mathematical formulae have been encoded as MathML and are displayed in this HTML version using MathJax in order to improve their display. Uncheck the box to turn MathJax off. This feature requires Javascript. Click on a formula to zoom.
Abstract
Aortic wall stress is the most common variable of interest in abdominal aortic aneurysm (AAA) rupture risk assessment. Computation of such stress has been dominated by finite element analysis. However, the effects of finite element (FE) formulation, element quality, and methods of FE mesh construction on the efficiency, robustness, and accuracy of such computation have attracted little attention. In this study, we fill this knowledge gap by comparing the results of the calculated aortic wall stress for ten AAA patients using tetrahedral and hexahedral meshes when varying the FE formulation (displacement-based and hybrid), FE shape functions, spatial integration scheme, and number of elements through the wall thickness.
1. Introduction
An abdominal aortic aneurysm (AAA) is an abnormal dilatation of the lower part of the aorta by 1.5 times its normal diameter (Johnston et al. Citation1991). The most severe complication of AAA, aortic rupture, is a catastrophic clinical event with a mortality rate of up to 90% (Upchurch and Schaub Citation2006). Currently, AAA clinical management is based on the maximum aortic diameter. However, 60% of AAAs with aortic diameter over 55 mm remain stable and do not rupture in the patient’s lifetime (Darling et al. Citation1977). Multiple studies have proposed that patient-specific biomechanical analysis can be potentially a more accurate and reliable solution for predicting AAA rupture than the AAA diameter measurement (Gasser et al. Citation2010; Polzer et al. Citation2013; Gasser et al. Citation2014; Joldes et al. Citation2017; Polzer et al. Citation2020).
Biomechanical analysis of AAA strongly relies on the computation of stress within the aortic wall (Fillinger et al. Citation2002). Aortic wall stress has been the main variable of interest in almost all proposed biomechanical rupture risk indicators of AAA (Fillinger et al. Citation2003; Gasser et al. Citation2010; Gasser et al. Citation2014). However, some studies found no evidence of a relationship between AAA symptoms and stress in the AAA wall (Miller et al. Citation2020). Evaluation of the extent to which AAA stress can be regarded as a reliable and robust indicator AAA rupture risk is beyond the scope of this study.
Finite Element Analysis (FEA) has been the method of choice for computing stress in AAA walls (Raghavan et al. Citation2006; Joldes et al. Citation2016; Wittek et al. Citation2022). This includes commercial and open-source software packages for AAA biomechanical analysis, such as A4Clinics VASCOPS (http://www.vascops.com/) and BioPARR (https://bioparr.mech.uwa.edu.au/). Progress in the application of FEA in computing stress in the AAA wall has been underpinned by a substantial research effort in methods for incorporating artery residual stress (Polzer et al. Citation2013; Joldes et al. Citation2018), determining and formulating material models for aortic tissue (Holzapfel et al. Citation2000), determining the relationship between the aortic wall thickness and predicted stress (Conlisk et al. Citation2016; Miller et al. Citation2019), and investigating the effects of intraluminal thrombus (ILT) on the AAA wall stress (Joldes et al. Citation2017). However, the effects of finite element (FE) formulation (displacement-based and hybrid), element topology (tetrahedra and hexahedra), order of polynomial shape functions, spatial integration scheme, and the FE mesh quality on the results of AAA stress computation have attracted little attention of the AAA biomechanics community. This is despite the fact that the accuracy of stress predicted using FEA and the computation time needed to obtain the results depend on the element topology, formulation, and quality of FE mesh used (Cifuentes and Kalbag Citation1992; Tadepalli et al. Citation2011). In particular for the peak stress, a variable often used in biomechanical indicators of the AAA rupture risk (Fillinger et al. Citation2002; Singh et al. Citation2020).
Discussion of whether tetrahedral or hexahedral elements are most suitable for continua with complex geometry has continued for more than 30 years (Cifuentes and Kalbag Citation1992; Benzley et al. Citation1995; Knupp Citation2001; Wittek et al. Citation2016). Tetrahedral elements tend to be used in AAA computational models as they allow automated mesh generation (Raut et al. Citation2015; Joldes et al. Citation2017). However, a high number of tetrahedral elements may be required to obtain a converged solution, with AAA computational biomechanics models typically consisting of 500,000 to over a million tetrahedra (Miller et al. Citation2020; Wittek et al. Citation2022). For the same element edge size and the same number of nodes, tetrahedral meshes require around seven times more elements than hexahedral meshes (Cubit Citation2021). Furthermore, for hexahedral meshes, the solution converges faster compared to tetrahedral meshes (Alkhatib et al. Citation2023). Meshes consisting of 30,000 to 50,000 hexahedral elements have been used in AAA computational biomechanical analysis (Wittek et al. Citation2022).
In this study, we compare the results of AAA wall stress computation for ten AAA patients using FEA when varying the element topology (i.e. tetrahedra and hexahedra), FE shape functions, element quality, spatial integration scheme, and number of elements across the AAA wall thickness.
2. Materials and methods
2.1. Computational biomechanical analysis of AAA
We used the method embedded in the freely-available open-source software platform BioPARR – Biomechanics-based Prediction of Aneurysm Rupture Risk (https://bioparr.mech.uwa.edu.au/) (Joldes et al. Citation2016; Joldes et al. Citation2017) to perform the biomechanical analysis of AAA in this study. BioPARR relies on the observation that as patient images show the deformed AAA geometry (due to loading by the blood pressure), the internal forces within the blood vessel wall that balance the applied pressure can be calculated from the principles of statics (Joldes et al. Citation2016; Joldes et al. Citation2017). This implies that if the computational biomechanics simulations are set-up in such a way that the deformed AAA geometry remains unchanged when loaded by blood pressure, one should obtain the stress field in the AAA wall that balances the pressure (Joldes et al. Citation2017). Such stress field is for practical purposes independent of the material properties of aortic tissue (Zelaya et al. Citation2014; Biehler et al. Citation2015).
The residual stresses are incorporated according to Fung’s Uniform Stress Hypothesis (USH) (Fung Citation1991) by averaging the stress across the vessel wall thickness (Joldes et al. Citation2018). This makes the computation of residual stress in the AAA wall a simple post-processing step during AAA biomechanical stress analysis (Joldes et al. Citation2016). We previously verified (Joldes et al. Citation2018) that for a given material model and material properties, the residual stress fields obtained using this method are very close to the ones obtained by the more complex non-linear method by Polzer et al. (Polzer et al. Citation2013).
For AAA stress computation, BioPARR can use any verified linear FE solver. Following our previous studies of AAA biomechanics (Joldes et al. Citation2016; Joldes et al. Citation2017), we used ABAQUS/Standard FE solver (Abaqus Citation2018) (https://www.3ds.com/products-services/simulia/products/abaqus/) called from within BioPARR.
2.1.1. Boundary conditions and load
The top and bottom nodes of the aneurysm were rigidly constrained. As the patients were asked to hold their breath during the image acquisition, there was no need to account for the respiration-induced aorta movement. The spine and tissues surrounding the aorta were not included in the AAA computational biomechanics models used in this study. Such an approach is frequently used in the literature (Gasser et al. Citation2010; Joldes et al. Citation2016), and its validity has been confirmed by our recent study (Liddelow et al. Citation2023).
The mean arterial blood pressure (Cywinski Citation1980), measured five minutes prior to the image acquisition, was used as patient-specific load. Following (Vorp et al. Citation1996), the pressure load was uniformly distributed over the ILT luminal surface.
2.1.2. Material models and material properties
We used a linear elastic material model for the aortic wall and ILT tissues, which is an approach used in BioPARR. Validity of application of linear material model in computing stress in AAA wall has been confirmed in our previous studies (Joldes et al. Citation2016; Joldes et al. Citation2017; Wittek et al. Citation2022).
The aorta was defined as a very stiff material with Young’s modulus of 100 MPa and Poisson’s ratio of 0.49 (Joldes et al. Citation2016; Joldes et al. Citation2017; Miller et al. Citation2020). This ensures that the deformed geometry of AAA represented by the model remains unchanged when loaded by blood pressure. The ILT was assumed to be 20 times more compliant than the AAA wall with Young’s modulus of 5 MPa and Poisson’s ratio of 0.49 (Miller et al. Citation2020).
2.2. Patient-specific AAA geometry from medical images
We used ten anonymised contrast-enhanced computed tomography angiography (CTA) image data sets of AAA patients. Patients were recruited at Fiona Stanley Hospital (Western Australia, Australia) and gave their informed consent before their participation in the study. The study was conducted in accordance with the Declaration of Helsinki, and the protocol was approved by Human Research Ethics and Governance at South Metropolitan Health Service (HREC-SMHS) (approval code RGS3501), and by Human Research Ethics Office at the University of Western Australia (approval code RA/4/20/5913).
We extracted patient-specific AAA geometries through CTA image segmentation using 3D Slicer (https://www.slicer.org/), an open-source software platform for medical image informatics, image processing, and three-dimensional visualization (Fedorov et al. Citation2012). Region of interest for the AAAs was defined as distal to the renal arteries and proximal to the common iliac bifurcations ().
Figure 1. Example of patient-specific abdominal aortic aneurysm (AAA) geometry (Patient 1): (a) AAA model segmented from CTA image – sagittal view, and (b) a cross-section of AAA geometry showing the intraluminal thrombus (ILT), lumen, and AAA external wall (blue color) created automatically using BioPARR (Joldes et al. Citation2017).
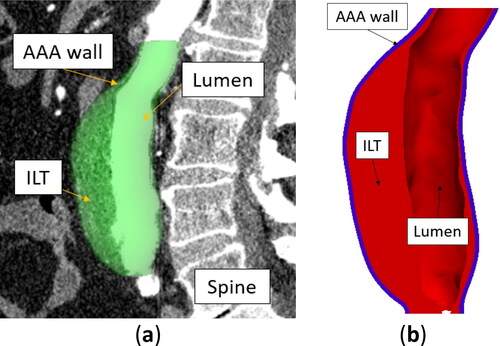
As contrast enhancement was used for all patients, we were able to segment the lumen automatically using the threshold algorithm (Lesage et al. Citation2009) in 3D Slicer. We manually segmented the external surface of the AAA wall as the AAA wall intensity in the CTA images is notably similar to that of the surrounding tissues.
Surfaces defining the AAA wall and the ILT were automatically created from the AAA segmentations using BioPARR software (). We assumed a constant AAA wall thickness of 1.5 mm (Miller et al. Citation2020; Polzer et al. Citation2020).
2.3. Patient-specific finite element meshes for biomechanical analysis of AAA
2.3.1. Generation of tetrahedral and hexahedral finite element meshes of AAA
Patient-specific tetrahedral FE meshes were created automatically from the extracted AAA geometries using the open-source Gmsh mesh generator (https://gmsh.info/) (Geuzaine and Remacle Citation2009), called from within BioPARR software. To generate hexahedral meshes of the aneurysm wall, we followed the semi-automated procedure described in detail in our previous work (Alkhatib et al. Citation2023), using the HyperMesh FE mesh generator (Altair, MI, USA; https://www.altair.com/hypermesh).
2.3.2. Finite element mesh quality measures
For tetrahedral meshes, we used two element quality measures (Parthasarathy et al. Citation1994):
The minimum/maximum allowable interior angles, which are determined between any two edges of the tetrahedron face. The acceptable interior angle ranges between 30° and 120° (Yang Citation2018).
The volumetric skew (AltairEngineering Citation2022) that determines how close a given element is to the ideal reference shape (in the sense of isoparametric FE analysis) (Ruggiero et al. Citation2019).
The volumetric skew is zero for an ideal tetrahedron, and one for a degenerated (co-planar/‘flat’) tetrahedron. Values recommended in practice vary between zero and 0.98 (recommendation from HyperMesh (AltairEngineering Citation2022) and ABAQUS (Abaqus Citation2018)). In this study, we regarded elements with volumetric skewness > 0.98 exhibiting unacceptable poor-quality (slivers).
For hexahedral meshes, we used two element quality measures (Zhang Citation2018):
Jacobian ratio (normalised Jacobian), defined as the ratio between the smallest and largest Jacobian matrix determinant for each Gauss point in all elements (Yang Citation2018). It ranges from zero to one, where one indicates an ‘ideal’ hexahedral element. We follow the recommendations by Yang (Yang Citation2018) who suggested that a Jacobian ratio should be at least 0.6.
The minimum and maximum allowable interior angles of a quadrilateral element face. The acceptable range of interior angles is between 45° and 135° (Yang Citation2018).
2.3.3. Finite element formulation and spatial integration
FEA of incompressible and nearly incompressible continua, such as aortic wall tissue, requires the application of finite elements that are not susceptible to volumetric locking (artificial stiffening for Poisson’s ratio close to 0.5). For linear 4-noded tetrahedral elements, a range of volumetric locking countermeasures, such as mixed (hybrid) FE formulation, need to be applied (Bonet and Burton Citation1998; Bathe Citation2006; Joldes et al. Citation2009). Quadratic 10-noded tetrahedral and 20-noded hexahedral elements are typically regarded as not susceptible to volumetric locking. However, accurate computation of the stress field for the Poisson’s ratio close to 0.5 may still require application of the hybrid FE formulation (Bathe Citation2006).
Reduced spatial integration has been reported in the literature to improve the accuracy of FE approximations (Zienkiewicz et al. Citation1971; Sandhu and Singh Citation1978; Bathe Citation2006) and reduce the computation cost by 30% compared to fully integrated quadratic hexahedral elements (Abaqus Citation2018). It has also been indicated that quadratic elements using reduced spatial integration provide accurate results for nearly incompressible materials (Naylor Citation1974; Malkus and Hughes Citation1978). This makes such elements particularly suitable for modelling the aorta and other soft tissues. Although quadratic tetrahedral elements with reduced integration have been described in the literature (Malkus and Hughes Citation1978), they are rarely used in practice.
We used 10-noded quadratic tetrahedral, and 8-noded linear and 20-noded quadratic hexahedral elements. We varied the FE formulation for each element between displacement-based and hybrid formulations. We also varied the spatial integration using full and reduced integration (Gauss) points, summarises the finite elements analysed in this study.
Table 1. Tetrahedral and hexahedral finite elements from ABAQUS finite element code library (Abaqus Citation2018) analysed in this study.
2.3.4. AAA mesh convergence analysis
In this study, we focused on analysing the effects of mesh refinement for linear and quadratic hexahedral elements (Babuska and Szabo Citation1982) on the results of peak maximum principal stress (MPS). For linear hexahedral elements, we used three meshes with two, four, and eight hexahedral elements through the AAA wall thickness. For quadratic hexahedral elements, we used three meshes with one, two, and four hexahedral elements through the wall thickness.
We used the Grid Convergence Index (GCI) (Roache Citation1994) to quantify how far the obtained solution is from the estimated ‘asymptotic’ value. We selected GCI as it has been used successfully in solid and structural mechanics (Schwer Citation2008; Kwaśniewski Citation2013). GCI is calculated based on Richardson’s extrapolation (Slater Citation2021):
(2)
(2)
where Fs is a safety factor based on the experience from computational fluid dynamics calculations (Fs equals one in our study), ε is the relative difference between subsequent solutions, r is a mesh refinement ratio (r equals two in our study), and p is the order of convergence given by:
(3)
(3)
where f1, f2, and f3 are the results of the variable of interest (peak MPS in this study) for three successive meshes refined by the factor r.
In-depth mesh convergence analysis was conducted for Patient 1 only. As residual stress affects the stress distribution (makes it uniform) through the AAA wall, we did not include it in the analysis of mesh convergence and effects of FE formulation on the computed AAA stress.
2.4. Analysis of the results and simulation matrix
We analysed the MPS at the nodes of the studied computational biomechanical FE models of AAA (). Stress at each node was computed by averaging the stress tensor components from all the elements with a vertex located at a given node (Abaqus Citation2018). When comparing the results, we analysed the MPS magnitude and distribution throughout the AAA and constructed MPS histograms and percentile plots with a percentile rank (in the population of all nodes in the AAA FE model of a given patient) of the MPS at a given node on the horizontal axis and MPS on the vertical axis (Wittek et al. Citation2022).
3. Results
3.1. Generation of tetrahedral and hexahedral finite element meshes of AAA
To compare the time required to generate patient-specific tetrahedral and hexahedral meshes of AAA and analyse the quality of elements in tetrahedral and hexahedral meshes, we built meshes with two elements through the AAA wall thickness (). The automated tetrahedral mesh generation (with optimisation to ensure the element quality) took between 40–50 min per patient using Intel(R) Core (TM) i7-5930K CPU @3.50 GHz with 64GB of RAM running Windows 8 operating system. The number of quadratic tetrahedral elements in the AAA wall mesh varied between around 620,000–860,000 (), and the number of nodes between 820,000 and 1,300,000.
Figure 2. Example of finite element meshes generated in this study (Patient 3). Blue color: aneurysm wall (with a constant wall thickness of 1.5 mm). Red color: intraluminal thrombus (ILT) meshed using tetrahedral elements. (a) Tetrahedral meshes of aneurysm wall, and (b) hexahedral meshes of aneurysm wall. Both meshes have two layers of elements through the wall thickness.
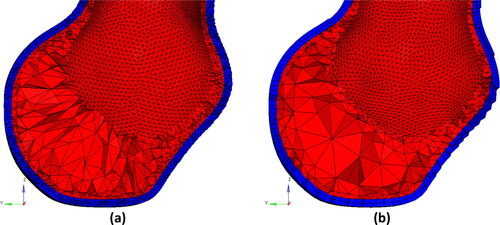
AAA hexahedral mesh generation required 20–30 min of work by the analyst (F.A., a PhD student with over five years of experience in FEA) for each patient. Hexahedral meshes of the AAA walls created in this study consisted of 21,000 to 53,000 hexahedral elements () and between 116,000 and 290,000 nodes.
For each FE mesh, the number of poor-quality elements was less than 0.5% of the total elements (). Most of the poor-quality elements were located at the top and bottom edges of the AAAs. These areas are of no interest from the perspective of stress analysis in the AAA wall.
3.2. AAA mesh convergence analysis and effects of element formulation
3.2.1. Quadratic tetrahedral elements
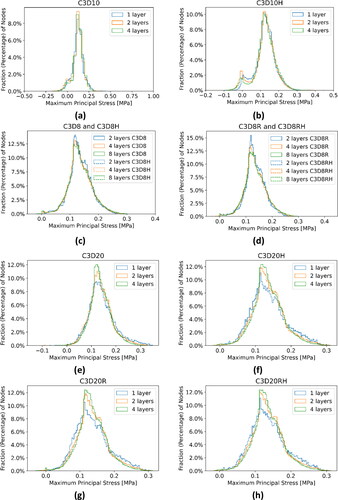
We observed differences in peak values of MPS between the displacement-based (C3D10) and hybrid (C3D10H) FE formulations ( and ). We could not calculate the convergence parameters for the element type C3D10 because of the inconsistency of the MPS results and observed clear symptoms of volumetric locking (). This indicates that the hybrid formulation is essential when using the quadratic tetrahedral elements for AAA stress calculations. From very small (practically negligible) differences between the MPS histograms for two and four quadratic tetrahedral elements through the AAA wall thickness (), we conclude that two layers of quadratic tetrahedral elements through the wall thickness are sufficient to achieve converged results.
3.2.2. Linear hexahedral elements
The differences between the peak MPS obtained using displacement-based (C3D8 and C3D8R) and hybrid (C3D8H and C3D8RH) FE formulations were negligible. This observation applies to full (C3D8 and C3D8H) and reduced (C3D8R and C3D8RH) spatial integration elements. The results show only a moderate (order of 25%) increase in the computation time due to the application of hybrid formulation and a small (order of -15%) decrease in the computation time for reduced spatial integration ().
Convergence analysis indicates virtually no difference in the grid convergence parameters and the estimated asymptotic solution (festimated) of peak MPS between linear hexahedral elements using displacement-based and hybrid formulations. This observation is consistent with the results reported when comparing the peak MPS for displacement-based and hybrid FE formulations ().
Elements with reduced spatial integration (C3D8R and C3D8RH) exhibited a lower convergence order and a higher GCI than elements with full integration (C3D8 and C3D8H).
Noticeable differences between the peak MPS obtained using the meshes constructed with two elements through the AAA wall and the festimated of peak MPS of 0.3192 MPa (), as well as the differences in the MPS magnitude obtained using the meshes with two and four hexahedral elements through the AAA wall () suggest that four layers of linear hexahedral elements through the AAA wall may be needed to achieve converged results.
Figure 3. Histograms of the maximum principal stress in the aneurysm wall (Patient 1) calculated using tetrahedral and hexahedral finite element meshes with different number of elements through the wall thickness (1 layer, 2 layers, 4 layers and 8 layers of elements) and for different element type/formulation (a) Quadratic tetrahedra with displacement formulation (C3D10); (b) Quadratic tetrahedra with hybrid formulation (C3D10H); (c) Linear hexahedra with displacement (C3D8) and hybrid (C3D8H) formulations. Only three histograms are visible as the results for C3D8 and C3D8H overlap; (d) Linear hexahedra with reduced integration, and displacement (C3D8R) and hybrid (C3D8RH) formulations. Only three histograms are visible as the results for C3D8R and C3D8RH overlap; (e) Quadratic hexahedra with displacement formulation (C3D20); (f) Quadratic hexahedra with hybrid formulation (C3D20H), (g) Quadratic hexahedra with reduced integration and displacement formulation (C3D20R), and (h) Quadratic hexahedra with reduced integration and hybrid formulation (C3D20RH).
3.2.3. Quadratic hexahedral elements
Noticeable differences between the peak MPS obtained using fully integrated displacement-based (C3D20 and C3D20R) and hybrid (C3D20H and C3D20RH) FE formulations were observed. The differences for reduced spatial integration were much smaller and can be regarded as negligible ( and ). As the constitutive behaviour of the AAA wall, tissues were described using linear elastic material with Poisson’s ratio of 0.49, the observed differences between the peak MPS for displacement-based and hybrid elements may indicate volumetric locking in very few (located at the top or bottom edges of the wall) quadratic hexahedral elements if full spatial integration and displacement-based formulation are used. This is further confirmed by the differences in the pressure (stress tensor trace) magnitude within the AAA wall obtained using such elements (peak pressure of 0.9178 kPa) and the hybrid elements (peak pressure of 0.6659 kPa).
The results for quadratic hexahedral elements using hybrid formulation indicate a higher convergence rate and lower CGI for reduced (C3D20RH) than full (C3D20H) integration. They also point to around a 10% decrease in the computation time for reduced integration ().
Negligible differences between the peak MPS obtained using the meshes constructed with two elements through the AAA wall and the festimated of the peak MPS of 0.3129 MPa (), as well as very small differences in the MPS magnitude obtained using the meshes with two and four quadratic hexahedral elements through the AAA wall, suggest that two layers of quadratic hexahedral elements through the AAA wall are sufficient to achieve converged results in terms of computation of the AAA wall stress. Detailed analysis indicates that for the discretisation using two layers of quadratic hybrid hexahedral elements through the AAA wall, the MPS magnitude and distribution obtained using full (C3D20H) and reduced (C3D20RH) spatial integration are practically indistinguishable ().
3.3. Comparison of aneurysm wall stress computed using tetrahedral and hexahedral meshes
In this section, we compare the computation time, peak values, and distribution of the MPS in the AAA walls obtained using the 10-noded quadratic tetrahedral (C3D10H) and the 20-noded quadratic reduced integration hexahedral (C3D20RH) meshes with two elements through the AAA wall thickness. The comparison was conducted for all ten patients analysed in this study. The residual stress was included when computing stress in the AAA walls according to Fung’s Uniform Stress Hypothesis (Fung Citation1991).
Distributions of the MPS in the AAA wall predicted using the quadratic tetrahedral and hexahedral elements were very similar. Contour plots of the MPS for the tetrahedral meshes were practically indistinguishable from those for hexahedral meshes (). This observation is consistent with the fact that no appreciable differences in the general behaviour of the percentile plots of the MPS () and peak MPS values () could be observed between the tetrahedral and hexahedral meshes, although differences in the stress magnitude were noticeable for some patients (Patients 3, 4, 5, and 7). The relative absolute difference between the MPS in AAA wall obtained using tetrahedral and hexahedral meshes varied between less than 1% (Patients 3, 4, and 9) to up to 4% (Patient 10) ( in Appendix A).
Figure 4. (a) Contour plots of the maximum principal stress (MPS) including residual stress (RS) obtained using C3D10H 10-noded quadratic tetrahedral hybrid elements (left-hand-side figures) and C3D20RH 20-noded quadratic hexahedral hybrid elements with reduced integration (right-hand-side figures) for the aneurysm wall; and (b) percentile plots of MPS for the studied AAA patients.
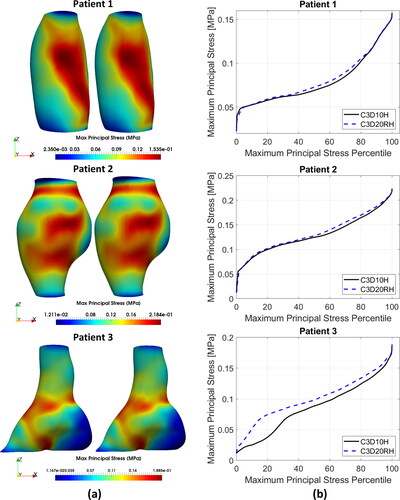
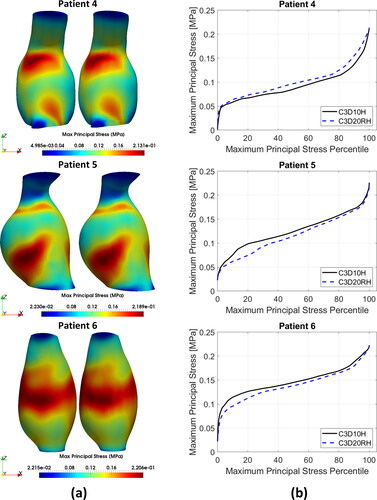
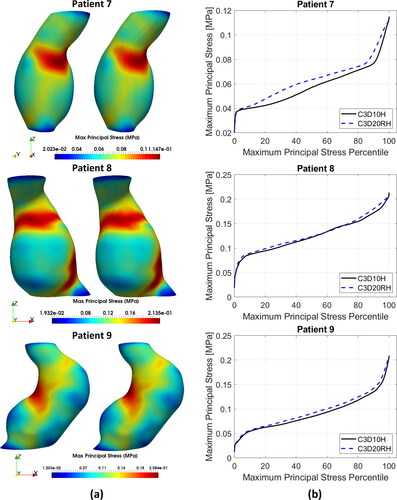
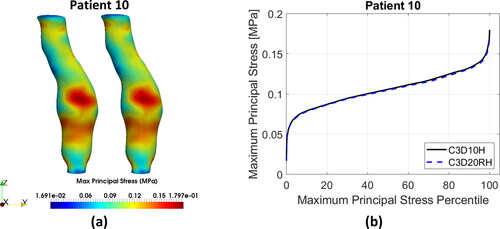
To provide quantitative measure of the differences between the results obtained using tetrahedral and hexahedral meshes, we conducted statistical analysis of the peak values of MPS in the AAA walls discretised using tetrahedral and hexahedral elements. We used the non-parametric Mann-Whitney U test (null hypothesis that the difference between the median peak MPS obtained using tetrahedral and hexahedral meshes of AAA wall equals zero) (Mann and Whitney Citation1947), and two sample t-test (null hypothesis that the difference between the mean peak MPS obtained using tetrahedral and hexahedral meshes of AAA wall equals zero) (Rice Citation2006). The application of Mann-Whitney U test gave a pvalue of 0.5708 and t-test a pvalue of 0.8334. When treating patient-specific computation of the peak value of MPS in the aneurysm wall using AAA tetrahedral and hexahedral meshes as independent observations, these results should be interpreted as an indication that the differences between the peak MPS obtained using tetrahedral and hexahedral meshes may be noticeable but are not significant.
4. Discussion
Our results indicate that FE meshes constructed using quadratic rather than linear elements are preferred for computing stress in the AAA walls. This conclusion applies to both tetrahedral and hexahedral elements. For quadratic tetrahedral and quadratic hexahedral elements, the converged solution was obtained for two elements through the AAA wall thickness. For linear hexahedral elements, four elements through the AAA wall thickness were needed, i.e. quadratic hexahedral elements facilitated the converged solution for around two times smaller number of nodes than linear hexahedral elements. Furthermore, linear tetrahedral elements are prone to volumetric and shear locking (Bonet and Burton Citation1998; Bathe Citation2006; Joldes et al. Citation2009), a challenge that needs to be addressed when analysing incompressible (or nearly incompressible) soft continua such as aortic wall tissues. The results obtained in this study suggest that even for quadratic hexahedral elements with full spatial integration, hybrid FE formulation may be needed to ensure that volumetric locking does not affect the results of stress computation in the AAA wall.
The distribution and peak value of the MPS in the AAA wall obtained using converged meshes (two elements through the AAA wall thickness) constructed from quadratic hexahedral and quadratic tetrahedral elements with hybrid FE formulation were for practical purposes the same. Hence, the key factors to consider when deciding whether to use tetrahedral or hexahedral meshes are the time and effort required to build patient-specific meshes of AAA and the computation time associated with a given mesh type.
As AAA hexahedral meshes contain substantially fewer elements and nodes (and degrees of freedom) than tetrahedral meshes, their computation time was more than five times shorter than for the tetrahedral meshes. However, it should be noted that the application of more advanced computing hardware would reduce the computation time, making the computational efficiency of hexahedral meshes less important. The need for 20–30 min of experienced FE analyst time when generating AAA hexahedral meshes can be seen as important disadvantage in clinical environment (hospitals are unlikely to hire experts in computational mechanics).
5. Conclusion
The results obtained in this study indicate that quadratic finite elements with a hybrid (displacement/pressure) formulation are needed to ensure fast (for a smaller number of elements and nodes) convergence and to prevent volumetric locking when applying finite element models in patient-specific biomechanical analysis of Abdominal Aortic Aneurysms. In contrast, automation of discretization of 3D objects with complex geometry using hexahedra remains an unsolved problem that is a subject of ongoing research effort. Therefore, we conclude that tetrahedra rather than hexahedra are the element of choice for AAA patient-specific biomechanical models.
Acknowledgements
Authors thank Fiona Stanley Hospital (Murdoch, Western Australia) for providing patient images. Author F.A. thanks Ms. Giuliana D'Aulerio of the University of Western Australia Medical School/Division of Surgery and Ms. Kiara Beinart of the University of Western Australia Intelligent System for Medicine Lab for their support in preparing the ethics approval application. Contributions of Christopher Wood and Jane Polce, radiology technicians at Medical Imaging Department, Fiona Stanley Hospital (Murdoch, Western Australia) to patient image acquisition are gratefully acknowledged.
Disclosure statement
No potential conflict of interest was reported by the authors.
Additional information
Funding
References
- Abaqus. 2018. Abaqus 6.14 Documentation. 2018. Dassault Systèmes Simulia Corp. [accessed 2022 June]. https://www.3ds.com/support/documentation/.
- Alkhatib F, Bourantas GC, Wittek A, Miller K. 2023. Generation of patient-specific structured hexahedral mesh of aortic aneurysm wall. Computational Biomechanics for Medicine - Towards Automation and Robustness of Computations in the Clinic, edited by MP Nash, A Wittek, PMF Nielsen, M Kobielarz, AR Babu and K Miller. Springer International Publishing. (In press)
- AltairEngineering. 2022. Altair HyperMesh. Altair Engineering. [accessed 2022 September]. https://2022.help.altair.com/2022.1/hwdesktop/hm/topics/chapter_heads/tutorials_r.htm.
- Babuska I, Szabo B. 1982. On the rates of convergence of the finite element method. Int J Numer Meth Eng. 18(3):323–341.
- Bathe KJ. 2006. Finite element procedures. New Jersey: Prentice Hall.
- Benzley SE, Perry E, Merkley K, Clark B, Sjaardama G. 1995. A Comparison of All Hexagonal and All Tetrahedral Finite Element Meshes for Elastic and Elasto-plastic Analysis. 4th International Meshing Roundtable; October 1995. Albuquerque, N.M. USA. Sandia National Laboratories. https://coreform.com/papers/hex_tet_comparison.pdf
- Biehler J, Gee MW, Wall WA. 2015. Towards efficient uncertainty quantification in complex and large-scale biomechanical problems based on a Bayesian multi-fidelity scheme. Biomech Model Mechanobiol. 14(3):489–513.
- Bonet J, Burton AJ. 1998. A simple average nodal pressure tetrahedral element for incompressible and nearly incompressible dynamic explicit applications. Commun Numer Meth Eng. 14(5):437–449.
- Cifuentes AO, Kalbag A. 1992. A performance study of tetrahedral and hexahedral elements in 3-D finite element structural analysis. Finite Elem Anal Des. 12(3–4):313–318.
- Conlisk N, Geers AJ, McBride OMB, Newby DE, Hoskins PR. 2016. Patient-specific modelling of abdominal aortic aneurysms: the influence of wall thickness on predicted clinical outcomes. Med Eng Phys. 38(6):526–537.
- Cubit 2021. Cubit user documentation by Sandia. [accessed 2022 July]. https://www.sandia.gov/files/cubit/15.4/help_manual/WebHelp/item/set-up.htm.
- Cywinski J. 1980. The essentials in pressure monitoring. Dordrecht: Springer. (The Tardieu Series).
- Darling R, Messina C, Brewster D, Ottinger L. 1977. Autopsy study of unoperated abdominal aortic aneurysms. The case for early resection. Circulation. 56(3 Suppl):II161–164.
- Fedorov A, Beichel R, Kalpathy-Cramer J, Finet J, Fillion-Robin J-C, Pujol S, Bauer C, Jennings D, Fennessy F, Sonka M, et al. 2012. 3D slicer as an image computing platform for the quantitative imaging network. Magn Reson Imaging. 30(9):1323–1341.
- Fillinger MF, Marra SP, Raghavan ML, Kennedy FE. 2003. Prediction of rupture risk in abdominal aortic aneurysm during observation: wall stress versus diameter. J Vasc Surg. 37(4):724–732.
- Fillinger MF, Raghavan ML, Marra SP, Cronenwett JL, Kennedy FE. 2002. In vivo analysis of mechanical wall stress and abdominal aortic aneurysm rupture risk. J Vasc Surg. 36(3):589–597.
- Fung YC. 1991. What are the residual stresses doing in our blood vessels? Ann Biomed Eng. 19(3):237–249.
- Gasser TC, Auer M, Labruto F, Swedenborg J, Roy J. 2010. Biomechanical rupture risk assessment of abdominal aortic aneurysms: model complexity versus predictability of finite element simulations. Eur J Vasc Endovasc Surg. 40(2):176–185.
- Gasser TC, Nchimi A, Swedenborg J, Roy J, Sakalihasan N, Böckler D, Hyhlik-Dürr A. 2014. A novel strategy to translate the biomechanical rupture risk of abdominal aortic aneurysms to their equivalent diameter risk: method and retrospective validation. Eur J Vasc Endovasc Surg. 47(3):288–295.
- Geuzaine C, Remacle J-F. 2009. Gmsh: a 3-D finite element mesh generator with built-in pre- and post-processing facilities. Int J Numer Meth Eng. 79(11):1309–1331.
- Holzapfel GA, Gasser TC, Ogden RW. 2000. A new constitutive framework for arterial wall mechanics and a comparative study of material models. J Elast Phys Sci Solids. 61(1):1–48.
- Johnston KW, Rutherford RB, Tilson MD, Shah DM, Hollier L, Stanley JC. 1991. Suggested standards for reporting on arterial aneurysms. J Vasc Surg. 13(3):452–458.
- Joldes GR, Miller K, Wittek A, Doyle B. 2016. A simple, effective and clinically applicable method to compute abdominal aortic aneurysm wall stress. J Mech Behav Biomed Mater. 58:139–148.
- Joldes GR, Miller K, Wittek A, Forsythe RO, Newby DE, Doyle BJ. 2017. BioPARR: a software system for estimating the rupture potential index for abdominal aortic aneurysms. Sci Rep. 7(1):4641.
- Joldes GR, Noble C, Polzer S, Taylor ZA, Wittek A, Miller K. 2018. A simple method of incorporating the effect of the uniform stress hypothesis in arterial wall stress computations. Acta Bioeng Biomech. 20(3):59–67.
- Joldes GR, Wittek A, Miller K. 2009. Non-locking tetrahedral finite element for surgical simulation. Commun Numer Methods Eng. 25(7):827–836.
- Knupp PM. 2001. Hexahedral and tetrahedral mesh untangling. Eng Comput. 17(3):261–268.
- Kwaśniewski L. 2013. Application of grid convergence index in FE computation. Bull Pol Acad Sci: Tech Sci. 61(1):123–128.
- Lesage D, Angelini ED, Bloch I, Funka-Lea G. 2009. A review of 3D vessel lumen segmentation techniques: models, features and extraction schemes. Med Image Anal. 13(6):819–845.
- Liddelow M, Alkhatib F, Wittek A, Miller K. 2023. The Effects of the Spine on the Analysis of Peak Wall Stress in Abdominal Aortic Aneurysms. Computational Biomechanics for Medicine - Towards Automation and Robustness of Computations in the Clinic, edited by MP Nash, A Wittek, PMF Nielsen, M Kobielarz, AR Babu and K Miller. Springer International Publishing. (In press)
- Malkus DS, Hughes TJR. 1978. Mixed finite element methods—reduced and selective integration techniques: a unification of concepts. Comput Methods Appl Mech Eng. 15(1):63–81.
- Mann HB, Whitney DR. 1947. On a test of whether one of two random variables is stochastically larger than the other. Ann Math Statist. 18(1):50–60.
- Miller K, Joldes GR, Qian J, Patel AP, Jung MS , Tavner ACR, Wittek A. 2019. Maximum Principal AAA Wall Stress Is Proportional to Wall Thickness. Computational Biomechanics for Medicine - Measurements, Models, and Predictions, edited by Nielsen PMF, Wittek A, Miller K, Doyle B, Joldes GR, Nash MP. Cham: Springer International Publishing.
- Miller K, Mufty H, Catlin A, Rogers C, Saunders B, Sciarrone R, Fourneau I, Meuris B, Tavner A, Joldes GR, et al. 2020. Is there a relationship between stress in walls of abdominal aortic aneurysm and symptoms? J Surg Res. 252:37–46.
- Naylor DJ. 1974. Stresses in nearly incompressible materials by finite elements with application to the calculation of excess pore pressures. Int J Numer Meth Eng. 8(3):443–460.
- Parthasarathy VN, Graichen CM, Hathaway AF. 1994. A comparison of tetrahedron quality measures. Finite Elem Anal Des. 15(3):255–261.
- Polzer S, Bursa J, Gasser TC, Staffa R, Vlachovsky R. 2013. A numerical implementation to predict residual strains from the homogeneous stress hypothesis with application to abdominal aortic aneurysms. Ann Biomed Eng. 41(7):1516–1527.
- Polzer S, Gasser TC, Vlachovský R, Kubíček L, Lambert L, Man V, Novák K, Slažanský M, Burša J, Staffa R. 2020. Biomechanical indices are more sensitive than diameter in predicting rupture of asymptomatic abdominal aortic aneurysms. J Vasc Surg. 71(2):617–626.e616.
- Raghavan ML, Ma B, Fillinger MF. 2006. Non-invasive determination of zero-pressure geometry of arterial aneurysms. Ann Biomed Eng. 34(9):1414–1419.
- Raut SS, Liu P, Finol EA. 2015. An approach for patient-specific multi-domain vascular mesh generation featuring spatially varying wall thickness modeling. J Biomech. 48(10):1972–1981.
- Rice JA. 2006. Mathematical statistics and data analysis. 3rd ed. Berkeley: University of California.
- Roache PJ. 1994. Perspective: a method for uniform reporting of grid refinement studies. ASME J Fluids Eng. 116(3):405–413.
- Ruggiero A, D’Amato R, Affatato S. 2019. Comparison of meshing strategies in THR finite element modelling. Materials (Basel). 12(14):2332.
- Sandhu RS, Singh KJ. 1978. Reduced integration for improved accuracy of finite element approximations. Comput Methods Appl Mech Eng. 14(1):23–37.
- Schwer LE. 2008. Is your mesh refined enough? Estimating discretization error using GCI. 7th LS-DYNA Anwender Forum. 1(1):45–54.
- Singh TP, Moxon JV, Iyer V, Gasser TC, Jenkins J, Golledge J. 2020. Comparison of peak wall stress and peak wall rupture index in ruptured and asymptomatic intact abdominal aortic aneurysms. BJS.
- Slater JW. 2021. Examining spatial (grid) convergence. [accessed 2022 October]. https://www.grc.nasa.gov/www/wind/valid/tutorial/spatconv.html.
- Tadepalli SC, Erdemir A, Cavanagh PR. 2011. Comparison of hexahedral and tetrahedral elements in finite element analysis of the foot and footwear. J Biomech. 44(12):2337–2343.
- Upchurch GR, Schaub TA. 2006. Abdominal aortic aneurysm. Am Acad Family Phys. 73(7):1198–1204.
- Vorp DA. 2007. Biomechanics of abdominal aortic aneurysm. J Biomech. 40(9):1887–1902.
- Vorp DA, Mandarino WA, Webster MW, Gorcsan J. 1996. Potential influence of intraluminal thrombus on abdominal aortic aneurysm as assessed by a new non-invasive method. Cardiovasc Surg. 4(6):732–739.
- Wittek A, Alkhatib F, Vitásek R, Polzer S, Miller K. 2022. On stress in abdominal aortic aneurysm: linear versus non-linear analysis and aneurysm rupture risk. Int J Numer Method Biomed Eng. 38(2):e3554.
- Wittek A, Grosland NM, Joldes GR, Magnotta V, Miller K. 2016. From finite element meshes to clouds of points: a review of methods for generation of computational biomechanics models for patient-specific applications. Ann Biomed Eng. 44(1):3–15.
- Yang KH. 2018. Chapter 3 – isoparametric formulation and mesh quality. In: Yang K-H, editor. Basic finite element method as applied to injury biomechanics. London: Academic Press; p. 111–149.
- Zelaya JE, Goenezen S, Dargon PT, Azarbal A-F, Rugonyi S. 2014. Improving the efficiency of abdominal aortic aneurysm wall stress computations. PLoS One. 9(7):e101353.
- Zhang YJ. 2018. Image-based quadrilateral and hexahedral meshing. Geometric modeling and mesh generation from scanned images. p. 193–228.
- Zienkiewicz OC, Taylor RL, Too JM. 1971. Reduced integration technique in general analysis of plates and shells. Int J Numer Meth Eng. 3(2):275–290.
Appendix A
Figure A1. AAA biomechanical analysis (the figure shows the pressure distribution in MPa) for Patient 1 using finite element mesh constructed with 10-noded quadratic displacement-based tetrahedral elements (element type C3D10 in ABAQUS finite element code). Volumetric locking, as indicated by nonphysical chess-board-like pattern of the pressure distribution, is clearly visible.
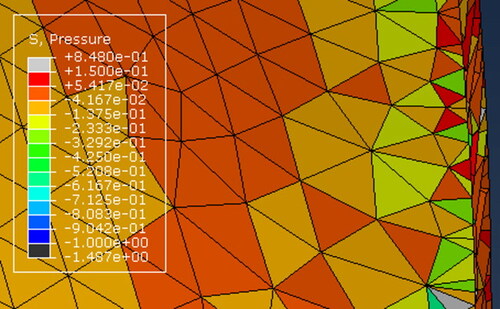
Table A1. Summary of the patient-specific computational biomechanics finite element (FE) models of AAA created and used in this study; a total of 60 models. The number of elements through the wall thickness determines the AAA mesh density. ILT is the intraluminal thrombus. The symbol ✗ indicates that ILT was not included in the model.
Table A2. Tetrahedral (tetra) and hexahedral (hexa) AAA wall mesh with two layers of elements through the wall thickness generated in this study: number of elements, percentage of poor-quality elements with respect to the total number of elements for each part, and values of mesh quality measures.
Table A3. Solution convergence and computation time for displacement-based (elements C3D10, C3D8, C3D8R, C3D20, and C3D20R) and hybrid (elements C3D10H, C3D8H, C3D8RH, C3D20H, and C3D20RH) finite element (FE) formulations. MPS = maximum principal stress, GCI=grid convergence index (Equation 2), p=order of convergence (Equation 3), and festimated= estimated asymptotic solution. Refer to Table A1 for more information about the models. For models 4, 6, 8, 12, 20, and 28, p, GCI and festimated could not be obtained due to the solution inconsistency.
Table A4. Computation time, peak maximum principal stress (MPS), relative absolute difference in the peak value of MPS between tetrahedral and hexahedral meshes for the studied AAAs. C3D10H is fully integrated quadratic tetrahedron using hybrid formulation. C3D20RH is quadratic hexahedron using hybrid formulation and reduced integration. Relative absolute difference was calculated as the absolute difference between the peak MPS obtained using C3D10H (MPSC3D10H) and C3D20RH (MPSC3D20RH) elements divided by the peak MPS obtained using C3D20RH elements: