
Abstract
Objectives: The hypothalamus lies adjacent to the third ventricle and is in close proximity with the median eminence (ME), a circumventricular organ with an incomplete blood–brain barrier (BBB) which controls direct entry of nutrients into the brain. The blood–CSF barrier of the hypothalamus shows dynamic changes upon neuroendocrine events and adjusts permeability with the tight junction (TJ) complex. It has been shown that chronic exposure to a high-fat diet (HFD) affects BBB permeability. HFD also induces leptin resistance and alters neuropeptide expression in the arcuate nucleus (Arc) of the hypothalamus starting early during overnutrition. We hypothesized altered integrity of the BBB to occur after exposing rats to a free-choice high-fat high-sugar (fcHFHS) diet for 1 week.
Methods: We measured diffusion of Evans blue dye over the ME and assessed expression of the TJ proteins ZO-1, claudin-5, and occludin in the tanycytic wall of the third ventricle. Furthermore, we assessed protein expression of glucose transporter 1 (GLUT-1), which is highly expressed in the Arc-ME complex and facilitates glucose transport over the BBB.
Results: fcHFHS-fed rats increased caloric intake compared to control, however, there was no effect of the fcHFHS diet on permeability of the BBB, nor changes in protein expression of tight TJ proteins or GLUT-1. Fasting acutely affects the BBB and we hypothesized that exposure to the fcHFHS diet affects the BBB differently compared to chow after fasting. We did not, however, find any differences in Evans blue diffusion nor protein expression between chow- and fcHFHS-fed rats when fasted overnight.
Conclusions: We conclude that short-term consumption of a fcHFHS diet does not change permeability or diffusion in the hypothalamus barrier in ad libitum fed or fasted rats.
Introduction
The delivery of blood-borne molecules like hormones and nutrients to the hypothalamus is restricted by the blood–brain barrier (BBB).Citation1,Citation2 The arcuate nucleus (Arc) of the hypothalamus lies adjacent to the third ventricle and is in close proximity with the median eminence (ME), a circumventricular organ with an incomplete BBB. Thus, the hypothalamus is in (in)direct contact with circulating molecules through the systemic circulation and through the cerebrospinal fluid (CSF). The brain–CSF barrier of the third ventricle is composed of tanycytes, specialized hypothalamic glia cells.Citation3 The tanycytes at the floor of the third ventricle (β2 type) are unique, because they have direct access to the circulation via fenestrations of the BBB found at the ME. β1 tanycytes, present on the border between the ME and the Arc, form the ME-Arc barrier and thus allow the actual entrance of substances into the hypothalamus.Citation4 Tight junction (TJ) complexes between adjacent tanycytes act as a physical barrier controlling the paracellular passage of substrates over the brain–CSF or ME–Arc barrier.Citation5 These complexes consist of occludin, claudins, and junctional adhesion molecules, groups of transmembrane proteins important for intercellular adhesion. In addition, zonula occludens (ZO) proteins are intracellular TJ proteins and proposed to be scaffolding proteins that link the extracellular TJs to the actin cytoskeleton.Citation5
Altered expression of TJs at ME-Arc level, resulting in the alignment or misalignment of the barrier is associated with altered barrier permeability.Citation6 The structural organization of TJs is a dynamic process. TJ proteins have the ability to remodel by altering protein expression upon certain (physiological) challenges, including immune cell infiltration,Citation7 traumatic brain injury,Citation8 but also upon metabolic changes such as fasting and refeeding.Citation6 Fasting has been shown to rapidly increase protein expression of subtypes ZO-1 and claudin-1, resulting in improved access of metabolic substrates to the hypothalamus, increasing access of circulating macromolecules and metabolic signaling molecules such as leptin, to this area.Citation6 On the other hand, refeeding or a glucose bolus after fasting normalized protein expression of ZO-1 and claudin-1, resulting in decreased diffusion of substrates into the brain.Citation6 This suggests that the main role of the dynamic structure of TJs in metabolic homeostasis is regulation of the entry of nutrients/substrates into the brain. Glucose diffuses into the brain by the GLUT-1 transporter expressed on the endothelium, an integral membrane protein which facilitates diffusion with the concentration gradient of glucose.Citation9 Fasting has been shown to time-dependently increase GLUT-1 protein expression in the hypothalamus, thus facilitating glucose transport to maintain normoglycemia in the brain.Citation10 It has been shown recently that a high-fat diet (HFD, not enriched in sugar) exposure of 3 days in mice downregulated GLUT-1 protein expression and brain glucose uptake as measured in BBB isolated vascular endothelial cells. Strikingly, prolonged HFD (28 days) restored GLUT-1, facilitated by an increase in vascular endothelial growth factor (VEGF) in macrophages, suggesting a compensatory mechanism.Citation11 Hormones involved in energy metabolism, like insulin and leptin, are actively transported over the BBB through saturable transporters.Citation12–15
In obesity, which is associated with hyperleptinemia and leptin resistance, the transport of leptin over the BBB is disrupted.Citation16 However, this is not explained by reduced access of leptin to the brain, since leptin transporters are not fully saturated and expression of leptin transporters is not reduced after an HFD.Citation17,Citation18 In rats, exposure to an HFD enriched in n-3 polyunsaturated fatty acids (PUFA) for 1 week, caused leptin resistance and increased hypothalamic occludin expression while claudin-5 and ZO-1 was not affected. Reducing occludin expression by antisense oligonucleotides restored leptin’s anorexigenic effects.Citation17 A chronic HFD increased passage of molecules over the BBBCitation19–21 and recently it was shown that ZO-1 and occludin protein are downregulated in isolated microvessels of mice after 8 weeks HFD.Citation22 Chang et al. (2014) showed similar effects in mice brain slides, however, observed an increase in whole brain ZO-1 protein without changes in occludin at this level.Citation19 Since leptin transporter expression seems not altered in obesity or after an HFD, but transport of leptin over the BBB is reduced, this suggests a change in the complex interplay between TJs.
Rats on a free-choice high-fat high-sucrose (fcHFHS) diet developed hyperphagia and leptin resistance within a week.Citation23 The hyperphagia was accompanied by alterations in mRNA expression of the orexigenic Neuropeptide Y (NPY) and anorexigenic pro-opiomelanocortin (POMC) expression within the Arc.Citation24 These changes further drive hyperphagia. Since the Arc is located adjacent to the ME and has a leaky BBB, we hypothesized that high amounts of fat and sugar intake, induces alterations of the BBB. We hypothesized that an 1-week exposure to a fcHFHS diet reduces diffusion through the ME into the Arc driven by altered protein expression of the TJ proteins claudin-5, occludin, and ZO-1 within the wall of the third ventricle. Furthermore, we hypothesized that GLUT-1 expression is decreased as a consequence of increased systemic glucose and free fatty acid levels after exposure to a fcHFHS diet. The decreased possibility of nutrients to cross the BBB and enter the Arc might underlie the altered neuropeptide expression that resembles a fasting state. Since fasting state is important in the dynamic changes of the BBB, we also investigated whether rats on a fcHFHS diet have an altered BBB response compared to chow animals, when fasted. As hypothalamic changes already occurred shortly after fcHFHS diet exposure,Citation25 we here studied effects of a 1-week fcHFHS diet exposure on BBB integrity.
Material and methods
Animals
Male Wistar rats (9–11 weeks, Charles River, Germany) were housed five per cage in a temperature and light controlled room (lights on: 0700–1900). All animals had ad libitum access to laboratory chow (Special Diet Service (SDS), England, UK) and tap water prior to testing. Rats received 1 week for acclimatization in which they were adapted to handling. The experiment was approved by the Committee for Animal Experimentation of the Academic Medical Center of the University of Amsterdam, the Netherlands.
Surgery for Evans blue infusions and dietary intervention
Rats underwent surgery under anesthesia induced with an intraperitoneal (i.p.) injection of 80 mg/kg Ketamin (Eurovet Animal Health, Bladel, the Netherlands), 8 mg/kg Xylazin (Bayer Health Care, Mijdrecht, the Netherlands) and 0.1 mg/kg Atropin (Pharmachemie B.V.) for catheterization of the right jugular vein. The catheter was exteriorized at the vertex of the head and fixed using four anchor screws and dental cement. Immediately after surgery, rats received an analgesic subcutaneously (Carprofen, 0.5 mg/100 g bodyweight (BW)). The animals were individually housed after surgery and allowed to recover for 7 days.
The fcHFHS diet consisted of a dish of saturated fat (Beef tallow (Ossewit/Blanc de Boeuf), Vandemoortele, Gent, Belgium) and a bottle of 30% sugar water (1.0 M sucrose mixed from commercial grade sugar and tap water) in addition to the normal standard chow diet and tap water. Food intake was measured five times a week.
Experiment 1: Effect of fcHFHS diet on BBB permeability and TJ expression in fed rats
Evans blue injections
To assess the permeability of the BBB, Evans blue (Sigma-Aldrich, Zwijndrecht, the Netherlands, 4 ml/kg (1% diluted in saline 0.9%)) was injected in the jugular vein, which is a dye with high affinity for serum albumin. Since serum albumin cannot cross the BBB, albumin-bound Evans blue would not reach the neural tissue.Citation26 Since the ME is leaky, albumin-bound Evans blue can enter the ME milieu, and subsequent diffusion into the Arc can be a measure for the permeability of the β1 tanycytes that make up the barrier between the ME and the Arc.Citation4
After recovery from surgery (n = 10, BW 332.0 ± 2.8 g), half of the rats were switched from their normal chow to the fcHFHS diet for 1 week, whereas the other half remained on chow (groups matched for BW). At 10 AM all rats received Evans blue via the jugular vein catheter. After 1 hour, animals received a single shot of pentobarbital (100–150 mg/kg BW, Nembutal) and were perfused with ice-cold saline for 1 minute. Afterwards, brains were dissected and quickly frozen on dry ice, where after they were stored at –80°C. Epididymal white adipose tissue (eWAT) was dissected and weighted prior to saline perfusion.
Brain sections
Thirty micrometer brain sections were cut using a cryostat. For Evans blue analyses, sections were collected on Superfrost Plus Plus slides and stored dry at −20°C. The Evans blue signal was visualized and imaged with a fluorescent microscope using 10× objective magnification and 540 nm filter. For quantification, an area outside the ME/third ventricle area was outlined in which background optical density was measured. Next, Evans blue signal in the ME/third ventricle area was masked using a threshold of two times background density, resulting in a surface area of Evans Blue staining for each section. Fourteen to sixteen sections were used per rat, capturing the whole area containing the ME (bregma –1.8 to –3.36 according to the Paxinos rat brain atlas, Paxinos, 2006). The surface area of Evans blue signal multiplied by average optical density within this area was plotted against ME level from rostral to caudal. The area under the curve was then calculated as a measure of integrated optical density (IOD). One animal was excluded from the analysis because it was considered an outlier using the Grubbs test (Graphpad software).
Protein expression of TJ proteins
For Western blots, 16 rats (BW 310.4 ± 2.4 g) were subjected to the fcHFHS diet or chow control diet (n = 8 per group, matched on BW) for 1 week. Thereafter, at 10 AM rats were anaesthetized with a CO2/O2 mixture (6:4) and killed by decapitation. Brains were then rapidly removed, frozen on dry ice and stored at –80°C. eWAT was dissected and weighted.
Western blots
To collect tissue of the ME and around the third ventricle, 200–250 µm coronal slices were cut with a cryostat (starting at bregma –0.96 until –3.60 according to the Paxinos rat brain atlas, Paxinos, 2006). Tissue was put down in RNA later (Ambion, Cambridgeshire, UK) after which the ME and lining of the 3 V was isolated with a razor blade/sharp needle, the dorsal border being top of 3 V and the lateral border ½ width of hypothalamus. Tissue was isolated using a sharp needle and homogenized in lysis buffer. RIPA (50 mM Tris–HCl (pH 7.6), 150 mM NaCl, 1% triton x-100, 0.5% sodium desoxycholate, 0,1% SDS, 2 mM EDTA, 1× phosphostop and 1× protease inhibitor (Roche, Almere, the Netherlands)) or suspension buffer (0.1 M NaCl, 0.01 M Tris–HCl (pH 7.6), 1 mM EDTA and 1× protease inhibitor) was used depending on the protein of interest. Protein concentration was measured with the Bio-Rad DC protein assay following the manufacturer’s instructions (Bio-Rad Laboratories, Veenendaal, the Netherlands).
A total of 15–30 µg protein was loaded onto SDS-PAGE gels and electrotransferred onto a PVDF membrane (Millipore, Amsterdam, the Netherlands pore size 0.45 µm). A pre-stained protein marker (Precision plus, Bio-Rad Laboratories, Veenendaal, the Netherlands 5 µL) was loaded on every gel. The membrane was incubated with blocking solution (5% w/v milk in Tris-buffered saline (73 mM NaCl, 200 mM Tris HCl, pH = 7.6) containing 0.2% v/v Tween-20), for 1 hour at room temperature. Subsequently, blots were incubated with antibodies for ZO-1 (Invitrogen, Landsmeer, the Netherlands), claudin-5 (LSBio, Seattle, WA, USA), occludin (Proteintech, Manchester, UK), GLUT-1 (Invitrogen, Landsmeer, the Netherlands) and β-actin (Santa Cruz, Heidelberg, Germany) diluted in blocking solution for 1 hour at room temperature, followed by overnight incubation at 4°C on a rocking table. Antibody characteristics are provided in .
Table 1 Antibody characteristics for western blots
Protein expression was detected using an horseradish peroxidase (HRP)-linked rabbit-specific secondary antibody (DAKO P0448) (diluted 1:1000 in blocking solution) for Claudin-5, ZO-1 and occludin, HRP-linked goat-specific antibody (DAKO P0449) 1:10 000, for β-actin or HRP-linked mouse-specific antibody (DAKO P0447) 1:1000, for GLUT1 and an enhanced chemiluminescence commercial kit (GE health care, Eindhoven, the Netherlands). The protein expression was quantified by densitometry with the ImageJ software and protein expressions were normalized for β-actin expression. Two animals from the fcHFHS diet group were excluded from the analysis because β-actin expression was too low.
Immunofluorescent staining for ZO-1
A part of the sections from brains that were injected with Evans blue were used to immunocytochemically stain for ZO-1 protein. Sections were post-fixed for 10–20 minutes in freshly prepared 4% Paraformaldehyde, rinsed in TBS and incubated in first antibody for ZO-1 (1:500, Invitrogen), diluted in TBS with 1% v/v normal goat serum and 0.3% v/v Triton X-100 for 1 hour at room temperature followed by overnight incubation at 4°C. The next day, after washing with TBS, slides were incubated with biotinylated anti-rabbit second antibody (1:400, Vector laboratories, Burlingame, CA, USA) for 60 minutes. Following two washes in TBS, sections were incubated in Streptavidine-Alexa 488 (1:500, Invitrogen) in blocking solution for 3 hours at room temperature in the dark. A nuclear counterstaining was performed by incubating the sections for 1 minute in Hoechst 33342 (1:1000, BioRad) diluted in 0.1 M PBS. Slides were coverslipped using mowiol (10% w/v Mowiol and 25% v/v glycerol in 0.1 M Tris–HCl pH 8.5). Representative (z-stack) images were made with a confocal microscope (Leica axioscope) using a 40×/1.3 oil objective using a CS2 UV filter, and a fluorescent microscope (Zeiss) with an 20× objective. Z-stacks were merged using imageJ software.Citation27
Experiment 2: Effect of fcHFHS diet on BBB permeability and TJ expression in fasted rats
Evans blue injections
To study whether fasting exerted differences between fcHFHS diet and chow animals in Evans blue diffusion over the BBB, we subjected a group of 15 animals to a fcHFHS or chow diet with overnight fast and compared this group to fed and fasted chow animals. After recovery from jugular vein cannulation (BW 336.1 ± 3.7), five animals were switched to the fcHFHS diet for one week while the rest remained on chow diet. The night before the Evans blue injections, five of the chow animals and all fcHFHS diet animals were fasted. The next morning Evans blue was injected via the jugular vein and animals were perfused with ice-cold saline for 1 minute. eWAT was dissected and weighted prior to saline perfusion. Total time of fasting was 16–18 hours. Brain sections and analysis of diffusion was the same as in experiment 1. One brain had to be excluded because of poor quality of the material, with incomplete ME.
Protein expression of TJ proteins
To study whether fasting induces changes in protein expression in animals on a fcHFHS diet, 16 rats (BW 289.7 ± 1.6) were subjected to fcHFHS diet or remained on chow (n = 8 per group) for 1 week, and were then fasted overnight before deeply anaesthetized and killed in the morning as described in experiment 1. eWAT was dissected and weighted. Total time of fasting was 16–18 hours.
Statistics
All data are expressed as mean ± SEM. Animal numbers were based on a power analysis using earlier detected effects of feeding status on Evans blue diffusionCitation6 and protein expression of TJs.Citation28 Animal characteristics were compared using a Student’s t-test or one-way ANOVA when there were more than two groups. eWAT was normalized for BW. For Evans blue injections, IOD was calculated per rat and a Student’s t-test was conducted to compare chow to fcHFHS diet for experiment 1 and a one-way ANOVA to compare the three conditions in experiment 2. Western blot bands were quantified with ImageJ and tested for differences using a Student’s t-test. P < 0.05 was considered significant.
Results
Experiment 1: Effect of fcHFHS diet on BBB permeability and TJ expression in fed rats
Evans blue injections
One week of fcHFHS diet exposure led to significant more caloric intake compared to chow-fed controls, and resulted in a strong trend for more eWAT in rats fed the fcHFHS diet compared to chow-fed controls (P = 0.053). BW and BW gain did not differ between groups ().
Table 2 Animal characteristics experiment 1
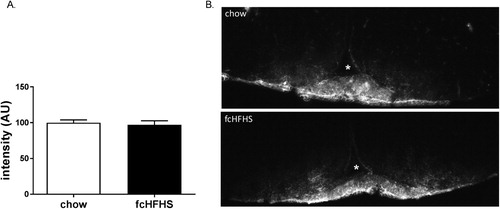
To assess BBB permeability after consuming a fcHFHS diet, Evans blue was injected into the jugular vein and the IOD was used as a measure for total Evans blue staining per area of interest. There was no difference between groups (P = 0.67) (). Also, there were no differences in surface area (0.72 ± 0.04 vs. 0.74 ± 0.03 mm2, P = 0.67) or density (33.6 ± 1.3 vs.31.8 ± 0.3, P = 0.26) of Evans blue dye diffusion in the ME area between groups.
Figure 1 IOD of Evans blue dye in the ME after chow (n = 5, white bar) and 1-week fcHFHS diet (n = 4, black bar) (A) and representative images of Evans blue dye in the ME and Arc of the hypothalamus of a chow and fcHFHS diet animal. White asterix depicts third ventricle (B). Data are expressed as mean ± SEM.
Protein expression of TJ proteins
Rats on the fcHFHS diet consumed significantly more calories and had significantly more eWAT compared to chow animals, whereas there were no differences in BW and BW gain ().
Table 3 Animal characteristics experiment 2
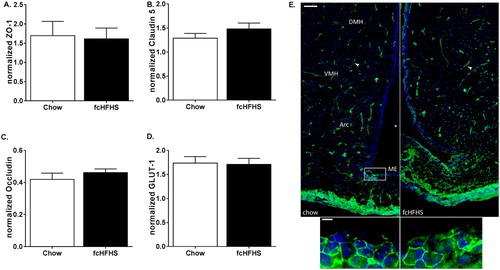
To determine differences in TJ proteins, western blot assays were performed for ZO-1, claudin-5, occludin, and GLUT-1. Bands were detected at the expected heights (ZO-1, 225 kDa; claudin-5, 23 kDa; occludin, 53 kDa). GLUT-1 is detected in the brain as two forms with different molecular weights, the 55 kDa form, responsible for the passage of glucose over the BBB; and the 45 kDa form, primarily located in astrocytes and responsible for glucose transport into glia cells.Citation29 In our lysates, we only detected the 45 kDa form with the used GLUT-1 antibody. Representative bands for all proteins and β-actin are shown in . Protein expression of neither ZO-1, claudin-5, occludin nor GLUT-1 was different between the fcHFHS compared to chow group (A–D).
Figure 2 Representative western blots on hypothalamic tissue lysates of two fcHFHS diet-fed (left bands) and two chow-fed animals (right bands) for ZO-1, occludin, and GLUT-1 protein, with β-actin protein as control for amount of protein loaded. Claudin-5 bands are shown of lysates of two fcHFHS diet animals on the left and right, and three chow-fed animals in the middle. Molecular weight is depicted next to blots.
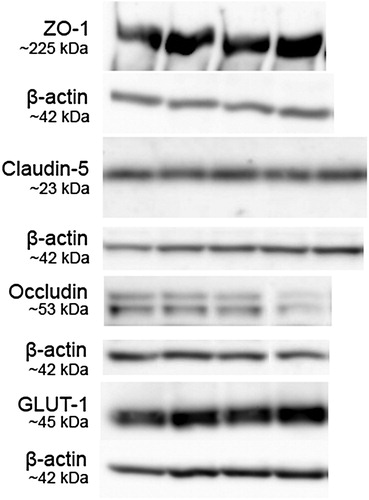
Figure 3 Effects of 1 week fcHFHS (n = 6, black bars) compared to chow (n = 8, white bars), on ME-Arc area protein expression of ZO-1 (A), claudin-5 (B), occludin (C), and GLUT-1 (D). Data are expressed as mean ± SEM. Right: ZO-1 immunoreactivity in coronal sections of the ME and third ventricle of a representative chow-fed and fcHFHS-fed rat. Arrowheads indicate immunopositive staining for ZO-1 (scale bar 100 µm). Lower two images are a magnification of the border of the ME with the honeycomb pattern of ZO-1 (green, scale bar 10 µm) and. Cells where counterstained with Hoechst 33342 (blue).
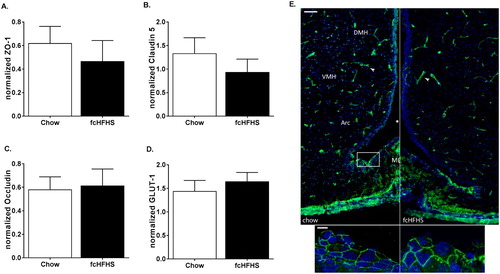
Qualitative images of ZO-1 protein show immunoreactivity in the hypothalamus in capillaries, which are known to display well-differentiated TJ complexesCitation3 (E, top). The honeycomb pattern of ZO-1 expression in the ME is shown in E, bottom.
Experiment 2: Effect of fcHFHS diet on BBB permeability and TJ expression in fasted rats
Evans blue injections
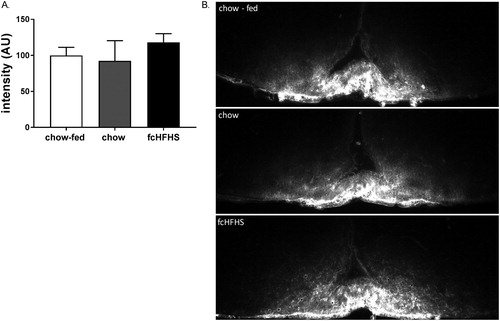
Animal characteristics for experiment 2 are summarized in . Rats on fcHFHS diet consumed significantly more calories compared to chow-fed controls, BW, BW gain, and eWAT was not significantly different between groups. W calculated the IOD for Evans blue diffusion over the ME but found no effect of fasting on diffusion comparing chow-fed to chow-fasted (P = 0.63) nor an overall difference between groups (one-way ANOVA, P = 0.14) ().
Figure 4 IOD of Evans blue dye in the ME in chow-fed (n = 4, white bar) and fasted chow (n = 5, gray bar) and fcHFHS animals (n = 5, black bar) (A) and representative images of Evans blue dye in the ME and Arc of the hypothalamus of a chow-fed, fasted chow and fcHFHS diet animal. White asterix depicts third ventricle (B). Data are expressed as mean ± SEM.
Protein expression of TJ proteins
fcHFHS-fed animals consumed more calories and had significantly more eWAT weight compared to chow controls (). Western blot analysis of ZO-1, claudin-5, occludin, and GLUT-1 did not differ between groups after an overnight fast (A–D). Qualitative images of ZO-1 protein staining are shown in E.
Figure 5 Effects of 1 week fcHFHS (black bars) diet compared to chow (white bars) (n = 8, per group), after overnight fast, on ME-Arc area protein expression of ZO-1 (A), claudin-5 (B), occludin (C), and GLUT-1 (D). Data are expressed as mean ± SEM. Right: ZO-1 immunoreactivity in coronal sections of the ME and third ventricle of a representative fasted chow and fcHFHS diet rat. Arrowheads indicate immunopositive staining for ZO-1 (scale bar 100 µm). Lower two images are a magnification of the border of the ME with the honeycomb pattern of ZO-1 (green, scale bar 10 µm) and. Cells where counterstained with Hoechst 33342 (blue).
Discussion
The permeability of the BBB determines the influx of solutes into the brain and might be important for hypothalamic responses in when animals are exposed to an obesogenic diet.Citation12,Citation17,Citation24 We therefore assessed diffusion of Evans blue through the ME, the circumventricular organ at the floor of the hypothalamus, which has a leaky BBB, as well as protein expression of TJs claudin-5, occludin and ZO-1 and the glucose transporter GLUT-1 in hypothalamic blocks of the wall of the third ventricle in rats on a fcHFHS diet. Our results show that a one-week fcHFHS diet exposure, known to induce hyperphagia, leptin resistance and alterations in neuropeptide expression in the Arc of rats,Citation24 did not affect BBB permeability. In addition, fasting did not reveal differences between chow and fcHFHS diet in BBB diffusion or protein expression levels.
The use of Evans blue as a marker for BBB permeability is currently under debate.Citation30 One important argument against the use of Evans blue is that not all of it is bound to albumin, raising the possibility that the diffusion is an underestimation of BBB permeability. For future experiments, it would be interesting to add an additional marker like sodium fluorescin.Citation30
Our data are not in line with others that report an effect of HFD on BBB integrity. However, the changes in the BBB might occur only after a more chronic state of high-fat feeding and/or obesity since most studies used exposure times of 8 weeks.Citation1,Citation5,Citation22 Longer exposure of the BBB to the macronutrients, i.e. lipids and sugar, from the fcHFHS diet might be necessary to induce altered expression of ZO, claudins, and occludin. Furthermore, BBB permeability increases with age and it has been shown that this aging effect is exacerbated with chronic exposure to an HFD.Citation31 For instance, it has been shown that diet enriched with n-3 PUFAs increased occludin protein already after 3 days, although it did not affect ZO-1 and claudin-5 protein expression.Citation17 Of note, the fat component in the fcHFHS diet predominantly consists of palmitic, oleic and stearic acid, but does not contain n-3 PUFAs, therefore the specific fatty acid composition of a diet might also be an important determinant of the alteration in BBB integrity. Others that studied the effect of a HFD on BBB integrity also used diets with a different fat composition compared to the fcHFHS diet.Citation19,Citation22 Regarding the lack of GLUT-1 differences after fcHFHS diet, it has been shown that a three-day HFD decreased GLUT-1 protein expression in brain endothelial cells, which is normalized after prolonged diet (28 days).Citation11 This again underscores the time-dependent effects of a diet on the dynamic alterations of TJ proteins. Rapid changes occurring already after several days, might already have been compensated for after 7 days of diet. We specifically chose to expose rats to an one-week fcHFHS diet because we previously showed that this time period and the specific combination of fat and sugar-induced leptin resistance and altered brain peptide expression.Citation24 Moreover, due to the short time-period of the diet our results are not expected to be biased by an extremely obese phenotype. Importantly, we detected only the 45 kDa isoform of GLUT-1, which is primarily expressed by astrocytes.Citation29 It therefore would be interesting to look specifically at the 55 kDa isoform of GLUT-1.
Feeding status is an important determinant of TJ protein expression with fasting rapidly increasing protein expression of TJ proteins,Citation6 suggesting that experimental conditions with regard to fasting duration might impact the results. Since leptin sensitivity, in previous experiments, was also assessed after overnight fast, we decided to add another experimental group in which animals were fasted for 16–18 hours, after which the same read-outs were measured as in the fed animals. We, however, did not observe effects of fasting per se in Evans blue diffusion or differences between chow-fed and fcHFHS-fed animals in diffusion and protein expression. The absence of a fasting effect on diffusion was not expected, since Langlet et al.Citation6 show, in mice, rapid effects of fasting on diffusion over the Arc. The discrepancies might be explained by the use of a different animal (mice vs. rats) and the longer fasting period that was used (24 hour vs. 16–18 hour).
Importantly, due to the assessment of total protein expression in the whole area of the ME and lining of the third ventricle we might have missed subtle changes in TJ expression. It has been shown that ZO-1 and occludin protein are downregulated in microvessels isolated from mice after 8 weeks HFD.Citation22 Chang et al. (2014) showed similar though non-significant effects in mice brain slides, however, observed an increase in whole brain ZO-1 protein without changes in occludin.Citation19 These discrepancies might be explained by the differences in the investigated tissue type (microvessels vs. whole brain) and it would therefore be valuable to discriminate between type of tissue type and/or specific brain area. Indeed, localization and also posttranslational modification of TJs and GLUT-1 can play an important role in BBB function and integrity. For instance, occludin undergoes extensive phosphorylation which can attenuate its interaction with ZO-1.Citation32 GLUT-1 protein conformation is different between the luminal and abluminal membranes due to differential phosphorylation.Citation33 Furthermore, GLUT-1 expression is absent in β2 tanycytes, which are in direct contact with the perivascular circulation of the ME, presumably because the ME is leaky and thus does not require glucose transporters.Citation34 GLUT-1 is, however, present in β1 tanycytes, that form the ME-Arc barrier. In addition, TJ protein expression also differs within the ME-Arc area, for instance, claudin-5 has been shown to be expressed in the Arc but not in the ME.Citation4,Citation35 These complex expression patterns and posttranslational modifications demands a more detailed approach in future experiments. Assessing phosphorylation of the proteins and conducting localization studies using an immunofluorescent approach, or in vitro BBB modelsCitation36 are necessary to fully exclude effects of the fcHFHS diet on the BBB.
We showed earlier that an 1-week fcHFHS diet exposure rapidly altered hypothalamic neuropeptide expression but also induced leptin resistance.Citation23 The current results, however, do not provide evidence for short-term changes in BBB structure or BBB permeability during fcHFHS diet exposure. Therefore, direct effects of the diet on the leptin signaling pathway or neuropeptide expression seems currently a more plausible conclusion. In line with this, we recently found increased suppressor of cytokine signaling 3 (SOCS3) mRNA expression in the hypothalamus after 1 week of fcHFHS diet exposure (Belegri et al., unpublished data). SOCS3 inhibits the phosphorylation of the leptin receptor and thus reduces leptin signaling.
In conclusion, we here show that short-term exposure to a fcHFHS diet-induced hyperphagia and increased adipose tissue weight but did not alter the expression of TJ proteins in the wall of the third ventricle, GLUT-1 expression or the permeability through the ME, neither in fed nor fasted rats. Future experiments are needed to specifically study protein expression patterns in the ME and different cell types to thoroughly understand the effects of nutrients on the dynamic BBB.
Disclaimer statements
Contributors None.
Funding This research was supported by Netherlands Organization for Scientific Research (ZonMw VIDI 917.96.331).
Conflict of interest None.
Ethics approval None.
Acknowledgements
The authors acknowledge Joop van Heerikhuize of The Netherlands Institute for Neuroscience and Alwin Kamermans of the Molecular Cell Biology and Immunology department of the VU medical center, Amsterdam for excellent technical support. We thank Prof. Dr. Elga de Vries for the use of antibodies and lab facility for immunofluorescent stainings. We thank Prof. Dr. Andries Kalsbeek and Prof. Dr. Eric Fliers for critical reading of the manuscript.
ORCID
M. J. Serlie http://orcid.org/0000-0002-8666-3379
References
- Neuwelt EA, Bauer B, Fahlke C, Fricker G, Iadecola C, Janigro D, et al. Engaging neuroscience to advance translational research in brain barrier biology. Nat Rev Neurosci 2011;12(3):169–82.
- Neuwelt EA. Mechanisms of disease: the blood-brain barrier. Neurosurgery 2004;54(1):131–40; discussion 141–2.
- Mullier A, Bouret SG, Prevot V, Dehouck B. Differential distribution of tight junction proteins suggests a role for tanycytes in blood-hypothalamus barrier regulation in the adult mouse brain. J Comp Neurol 2010;518(7):943–62.
- Rodriguez EM, Blazquez JL, Guerra M, The design of barriers in the hypothalamus allows the median eminence and the arcuate nucleus to enjoy private milieus: the former opens to the portal blood and the latter to the cerebrospinal fluid. Peptides 2010;31(4):757–76.
- Gonzalez-Mariscal L. Tight junction proteins. Prog Biophys Mol Biol 2003;81(1):1–44.
- Langlet F, Levin BE, Luquet S, Mazzone M, Messina A, Dunn-Meynell AA, et al. Tanycytic VEGF-A boosts blood-hypothalamus barrier plasticity and access of metabolic signals to the arcuate nucleus in response to fasting. Cell Metab 2013;17(4):607–17.
- Winger RC, Koblinski JE, Kanda T, Ransohoff RM, Muller WA. Rapid remodeling of tight junctions during paracellular diapedesis in a human model of the blood-brain barrier. J Immunol 2014;193(5):2427–37.
- Nag S, Venugopalan R, Stewart DJ. Increased caveolin-1 expression precedes decreased expression of occludin and claudin-5 during blood-brain barrier breakdown. Acta Neuropathol 2007;114(5):459–69.
- Keaney J, Campbell M. The dynamic blood-brain barrier. FEBS J 2015;282(21):4067–79.
- Fuente-Martin E, García-Cáceres C, Granado M, de Ceballos ML, Sánchez-Garrido MÁ, Sarman B, et al. Leptin regulates glutamate and glucose transporters in hypothalamic astrocytes. J Clin Invest 2012;122(11):3900–13.
- Jais A, Solas M, Backes H, Chaurasia B, Kleinridders A, Theurich S, et al. Myeloid-Cell-Derived VEGF maintains brain glucose uptake and limits cognitive impairment in obesity. Cell 2016;165(4):882–95.
- Banks WA, Coon AB, Robinson SM, Moinuddin A, Shultz JM, Nakaoke R, et al. Triglycerides induce leptin resistance at the blood-brain barrier. Diabetes 2004;53(5):1253–60.
- Banks, WA, Jaspan JB, Huang W, Kastin AJ. Transport of insulin across the blood-brain barrier: saturability at euglycemic doses of insulin. Peptides 1997;18(9):1423–9.
- Baura GD, Foster DM, Porte D, Kahn SE, Bergman RN, Cobelli C, et al. Saturable transport of insulin from plasma into the central nervous system of dogs in vivo. A mechanism for regulated insulin delivery to the brain. J Clin Invest 1993;92(4):1824–30.
- Kastin AJ, Pan W. Dynamic regulation of leptin entry into brain by the blood-brain barrier. Regul Pept 2000;92(1–3):37–43.
- Van Heek M, Compton DS, France CF, Tedesco RP, Fawzi AB, Graziano MP, et al. Diet-induced obese mice develop peripheral, but not central, resistance to leptin. J Clin Invest 1997;99(3):385–90.
- Oh IS, Shimizu H, Sato T, Uehara Y, Okada S, Mori M. Molecular mechanisms associated with leptin resistance: n-3 polyunsaturated fatty acids induce alterations in the tight junction of the brain. Cell Metab 2005;1(5):331–41.
- Gonzalez-Carter D, et al. Inhibition of leptin-ObR interaction does not prevent leptin translocation across a human blood-brain barrier model. J Neuroendocrinol 2016. Available from: http://dx.doi.org/10.1111/jne.12392.
- Chang HC, Tai YT, Cherng YG, Lin JW, Liu SH, Chen TL, et al. Resveratrol attenuates high-fat diet-induced disruption of the blood-brain barrier and protects brain neurons from apoptotic insults. J Agric Food Chem 2014;62(15):3466–75.
- Elahy M, Lam V, Pallebage-Gamarallage MM, Giles C, Mamo JCL, Takechi R. Nicotine attenuates disruption of blood-brain barrier induced by saturated-Fat feeding in wild-type mice. Nicotine Tob Res 2015;17(12):1436–41.
- Davidson TL, Monnot A, Neal AU, Martin AA, Horton JJ, Zheng W. The effects of a high-energy diet on hippocampal-dependent discrimination performance and blood-brain barrier integrity differ for diet-induced obese and diet-resistant rats. Physiol Behav 2012;107(1):26–33.
- Ouyang S, Hsuchou H, Kastin AJ, Wang Y, Yu C, Pan W. Diet-induced obesity suppresses expression of many proteins at the blood-brain barrier. J Cereb Blood Flow Metab 2014;34(1):43–51.
- van den Heuvel JK, Eggels L, van Rozen AJ, Luijendijk MCM, Fliers E, Kalsbeek A. Neuropeptide Y and leptin sensitivity is dependent on diet composition. J. Neuroendocrinol 2014;26(6):377–85.
- la Fleur SE, van Rozen AJ, Luijendijk MCM, Groeneweg F, Adan RAH. A free-choice high-fat high-sugar diet induces changes in arcuate neuropeptide expression that support hyperphagia. Int J Obes (Lond) 2010;34(3):537–46.
- van den Heuvel JK, Eggels L, Fliers E, Kalsbeek A, Adan RAH, la Fleur SE, et al. Differential modulation of arcuate nucleus and mesolimbic gene expression levels by central leptin in rats on short-term high-fat high-sugar diet. PLoS ONE 2014;9(1):e87729.
- Hawkins BT, Egleton RD. Fluorescence imaging of blood-brain barrier disruption. J Neurosci Methods 2006;151(2):262–7.
- Schneider CA, Rasband WS, Eliceiri KW. Nih Image to ImageJ: 25 years of image analysis. Nat Methods 2012;9(7):671–5.
- Sun YN, Liu LB, Xue YX, Wang P. Effects of insulin combined with idebenone on blood-brain barrier permeability in diabetic Rats. J Neurosci Res 2015;93(4):666–677.
- Maher F, Vannucci SJ, Simpson IA. Glucose transporter proteins in brain. FASEB J 1994;8(13):1003–11.
- Saunders NR, Dziegielewska KM, Møllgård K, Habgood MD. Markers for blood-brain barrier integrity: how appropriate is Evans blue in the twenty-first century and what are the alternatives? Front Neurosci 2015;9:385.
- Tucsek Z, Toth P, Tarantini S, Sosnowska D, Gautam T, Warrington JP, et al. Aging exacerbates obesity-induced cerebromicrovascular rarefaction, neurovascular uncoupling, and cognitive decline in mice. J Gerontol A Biol Sci Med Sci 2014;69(11):1339–52.
- Rao R. Occludin phosphorylation in regulation of epithelial tight junctions. Ann N Y Acad Sci 2009;1165:62–8.
- Devraj K, Klinger ME, Myers RL, Mokashi A, Hawkins RA, Simpson IA. GLUT-1 glucose transporters in the blood-brain barrier: differential phosphorylation. J Neurosci Res 2011;89(12):1913–25.
- Peruzzo B, Pastor FE, Blázquez JL, Schöbitz K, Peláez B, Amat P, et al. A second look at the barriers of the medial basal hypothalamus. Exp Brain Res 2000;132(1):10–26.
- Norsted E, Gomuc B, Meister B. Protein components of the blood-brain barrier (BBB) in the mediobasal hypothalamus. J Chem Neuroanat 2008;36(2):107–21.
- Ito S, Yanai M, Yamaguchi S, Couraud PO, Ohtsuki S. Regulation of tight-junction integrity by insulin in an in vitro model of human blood-brain barrier. J Pharm Sci 2017;106(9):2599–2605.