
Abstract
Objectives: The regulatory role of the brain in directing eating behavior becomes increasingly recognized. Although many areas in the brain have been found to respond to food cues, very little data is available after actual caloric intake. The aim of this study was to determine normal whole brain functional responses to ingestion of glucose after an overnight fast.
Methods: Twenty-five normal weight, adult males underwent functional MRI on two separate visits. In a single-blind randomized study setup, participants received either glucose solution (50 g/300 ml of water) or plain water. We studied changes in Blood Oxygen Level Dependent (BOLD) signal, voxel-based connectivity by Eigenvector Centrality Mapping, and functional network connectivity.
Results: Ingestion of glucose led to increased centrality in the thalamus and to decreases in BOLD signal in various brain areas. Decreases in connectivity in the sensory-motor and dorsal visual stream networks were found. Ingestion of water resulted in increased centrality across the brain, and increases in connectivity in the medial and lateral visual cortex network. Increased BOLD intensity was found in the intracalcarine and cingulate cortex.
Discussion: Our data show that ingestion of glucose leads to decreased activity and connectivity in brain areas and networks linked to energy seeking and satiation. In contrast, drinking plain water leads to increased connectivity probably associated with continued food seeking and unfulfilled reward.
Trail registration: This study combines data of two studies registered at clinicaltrails.gov under numbers NCT03202342 and NCT03247114.
Introduction
The regulatory role of the brain in directing glucose homeostasis, energy homeostasis, and thus eating behavior, is increasingly being recognized.Citation1,Citation2 Glucose is the primary source of energy for the brain, and its metabolism is kept under tight regulation to maintain optimal brain physiology. The brain consumes about 20% of glucose derived energy in the human body.Citation3 However, energy consumption is not only regulated by homeostatic processes, but it also has hedonic aspects in which the brain has an important role.Citation1 Next to maintaining energy balance, the hedonic features of food and executive control by the brain are important in driving energy seeking behavior, and may be involved in overconsumption of energy. In the regulation of energy intake, many parts of the brain have been found to be involved. Brain areas such as the ventrolateral prefrontal cortex (executive and inhibitory control), hypothalamus (energy homeostasis), insula (taste response), and Ventral Tegmental Area (reward) have been found to respond to food cues in the form of taste, smell, and visual cues.Citation4,Citation5
Up until now, only a few studies have investigated the direct brain response to actual nutrient ingestion, by studying changes in functional connectivity throughout the brain and specific Blood Oxygen Level Dependent (BOLD) response in the hypothalamus.Citation6–8 These studies revealed that hypothalamic activity was suppressed within minutes after consumption, suggesting a relation with alterations in energy homeostasis combined with decreased feelings of hunger. In addition to homeostatic effects, hedonic aspects of energy ingestion are also important.Citation9–11 It is to be expected that, in addition to the hypothalamus, other parts of the brain that are involved in reward, motivation or inhibition and decision-making, also show functional responses after glucose ingestion. Understanding of these functional brain responses yields insights into satiety signaling, nutrient sensing, energy seeking, and feeding behavior. Moreover, it may aid in the development of neurophysiological markers for (dys-)regulation of these systems in obesity, eating disorders and type 2 diabetes.
Beyond measurements of local BOLD changes, which has been shown to be a measure of neuronal activity,Citation12 analysis of changes in functional connectivity would provide further insights into functional responses after food ingestion. Network analysis is a proven measure to analyze functional brain networks at rest, reflecting basal cerebral functions,Citation13 for instance in context of feeding behavior.Citation14 A newer method to determine functional brain connectivity is Eigenvector Centrality Mapping (ECM). ECM is an assumption and parameter-free method to determine the level and quality of connectivity on a voxel-wise level.Citation15,Citation16 Eigenvector centrality has been shown to be modulated by the physiological state of the subject and ECM has successfully been used to investigate voxel-wise connectivity in states of hunger and satiety.Citation16
The main aim of this study was to determine normal whole brain functional responses to the ingestion of water and glucose by investigating changes in BOLD activity, voxel-based Eigenvector centrality and functional network connectivity. We used functional MRI to investigate these effects in normal weight, adult male persons through the ingestion of plain water and glucose dissolved in water after an overnight fast.
Methods
Subject characteristics
Twenty-five nonsmoking, Caucasian men, aged 18–25 years were recruited through local advertising for two studies on functional brain responses to nutrient ingestion. Exclusion criteria for both studies were: a history of disturbances in glucose metabolism (e.g. diabetes mellitus), any significant chronic disease, psychiatric disease, BMI below 20 or above 23 kg/m2, body height below 170 or above 190 cm, recent weight changes (>3 kg gain or loss) within the last 3 months, having smoked within the last 6 months, recent blood donation, alcohol consumption of more than 21 standard servings per week, recent use of recreational drugs, and contra-indications to MRI scanning. The present study combines data of two studies which were approved by the local Medical Ethical Committee and registered at clinicaltrails.gov under numbers NCT03202342 and NCT03247114. All volunteers gave written informed consent before participation.
Study design
Study design for both studies was a randomized crossover observational design, consisting of four or five study occasions, respectively. Both studies included glucose and water ingestion, data from these sessions were combined for the current study. For all sessions, subjects were asked to refrain from strenuous physical activity and/or alcohol consumption the day before scanning and were admitted to the research site after having fasted overnight (12 hours). To minimize circadian influence, all subjects were examined in the morning between 9:00 and 11:00 AM. The test solution for the study consisted of either 50 g of glucose (in the form of dextrose powder) dissolved in 300 ml of tap water or 300 ml of plain tap water. This glucose dose is comparable to sugar amounts found in several high energy beverages and was chosen to provide a strong blood glucose and insulin response. Both solutions were consumed at room temperature. The protocol consisted of a 30-minute acclimatization period in the MRI-facilities prior to data acquisition. Functional MRI was performed before and after glucose/water administration. The test drink was delivered through a per-oral tube while the subject was still in supine position in the MRI scanner. The pre-ingestion fMRI scan was performed 10 minutes before, and the post-ingestion scan was started 16 minutes after administration of the test drink. The total MRI procedure lasted 50 minutes.
Blood sampling
Blood samples were taken before and after the entire scanning session by venipuncture. Plasma insulin was measured using a radioimmunoassay kit (Medgenix, Fleurus, Belgium) and plasma glucose was measured using a fully automated Hitachi 704/911 system (Hitachi Medical Systems Europe, Reeuwijk, the Netherlands). Changes in blood levels were statistically analyzed using paired samples t-tests.
Hunger rating
Subjective feelings of hunger were indicated on a Visual Analogue Scale (VAS) which consisted of a 10 cm line, with ‘not hungry’ and ‘extremely hungry’ as anchors. Subjects were asked to indicate their score on the line, higher scores indicating a more hungry feeling. Changes in VAS scores were statistically analyzed using the non-parametric Wilcoxon signed-rank test.
MRI data acquisition
MRI scanning was performed on a Philips Achieva 3.0 T scanner using a 32-channel SENSE head coil (Philips Healthcare, Best, The Netherlands). Anatomical high-resolution 3D T1-weighted images of the whole brain were acquired (TR 9.8 ms, TE 4.6 ms, flip angle 8, 140 transverse slices, FOV 224 mm × 177 mm × 168 mm, reconstructed in-plane resolution 0.88 mm × 0.87 mm, slice thickness 1.2 mm) along with a high-resolution T2*-weighted EPI scan (EPI factor 35, TR 2200 ms, TE 30 ms, flip angle 80, 84 axial slices, FOV 220 mm × 220 mm, in-plane resolution 1.96 mm × 1.96 mm, slice thickness 2.0 mm) for registration purposes. Resting state scans were acquired with T2*-weighted gradient echo-planar imaging (EPI factor 35, 160 dynamics, 37 transverse slices scanned in ascending order, TR 2200 ms, TE 30 ms, flip angle 80, FOV 220 mm × 220 mm, voxel size 2.75 × 2.75 × 2.50 mm with a 0.25 mm slice gap, total acquisition time: 6 minutes).
MRI data preprocessing
MRI data were preprocessed and analyzed using Functional Magnetic Resonance Imaging of the Brain Software Library (FSL) version 5.0.8,Citation17 Matlab and Phyton. Of all data sets, structural and functional, non-brain structures were removed using Brain Extraction Tool tool as implemented in FSL. The T1-weighted images were registered to the 2 mm isotropic MNI-152 standard space image (Montreal Neurological Institute, Montreal, QC, Canada) using non-linear registration with a warp resolution of 10 mm. The FMRI Expert Analysis Tool was used for motion correction with MCFLIRT, spatial smoothing with a full width at half maximum of 3 mm, and high pass temporal filtering with a cutoff frequency of 0.01 Hz. The functional resting state images were registered to the corresponding T1-weighted images using Boundary-Based Registration affine registration, using the high-resolution echo-planar images as an additional registration step.
MRI data analysis whole brain BOLD changes
Whole brain BOLD intensities were compared before and after ingestion of glucose and water according to Rombouts et al.Citation18 In short, a single volume BOLD signal map was calculated by averaging the time series data. Average cerebrospinal fluid (CSF) signal of the BOLD image was determined by averaging all voxels within the masked CSF. This CSF mask was determined by selecting voxels located in the lateral ventricles on the segmented structural images. This approach decreases the possibility of including the unwanted signal of other compartments than CSF. Next, in each subject, a normalized BOLD signal map was calculated by dividing each voxel’s signal by the average CSF signal. Voxel-wise comparisons of pre- and post-ingestion normalized BOLD signal maps were done using the Randomize tool of FSL with a paired samples approach and using Threshold-Free Cluster Enhancement (TFCE).Citation19 All data were family-wise error (FWE) corrected at a level of P < 0.05.
MRI data analysis Eigenvector centrality changes
For the connectivity analysis, the data-driven ICA-based Automatic Removal of Motion Artifacts (ICA-AROMA) was used to identify components in the data related to head motion and to remove these using linear regression.Citation20,Citation21 Voxel-based connectivity Eigenvector centrality maps were calculated on the ICA-AROMA preprocessed data for each participant using fast-ECM software, which estimates voxel-wise eigenvector centralities from fMRI time series (github.com/amwink/bias/tree/master/matlab/fastECM).Citation15 Pre- and post-ingestion Eigenvector centrality maps were compared in a voxel-wise approach in the masked gray matter using the Randomize tool with a paired samples approach and using TFCE.Citation19 Pre- and post-ingestion scans were compared per condition with paired two-sided contrasts. The same FWE correction at P < 0.05 as for the whole brain BOLD analysis was used.
MRI data analysis network functional connectivity changes
Functional network analysis was performed on the same ICA-AROMA preprocessed data using the Beckmann resting-state functional networks templates.Citation13 The Beckmann auditory network was used as a template for the salience network as this standard template encompasses largely the same brain areas.Citation22 To account for noise, white matter, and CSF templates were included in the analyses. Functional connectivity of each network of interest was calculated using the dual regression approach. This results in 3D images for each individual, with voxel-wise Z-scores representing the functional connectivity to each network. The average Z-scores per network were calculated for the pre- and post- ingestion time point. Differences in Z-scores between pre- and post-ingestion were analyzed using paired samples t-tests per functional network. Correction for multiple comparisons for eight networks per statistical analysis was done with False Discovery Rate (FDR) correction, FDR corrected P < 0.05 was deemed significant.
Results
Subject characteristics, blood levels, and VAS scores
Subject characteristics for the study group (n = 25) are shown in , all participants successfully completed all study visits. Blood levels of glucose, insulin, and VAS scores for feelings of hunger are shown in . As expected, ingestion of glucose solution led to a significant increase in glucose and insulin levels in the blood, whereas water ingestion had no significant effect on blood levels. VAS scores for the feelings of hunger significantly increased after ingestion of water, while glucose ingestion resulted in a minor, non-significant decrease.
Table 1 Subject characteristics
Table 2 Blood values and VAS scores
Whole brain BOLD signal changes
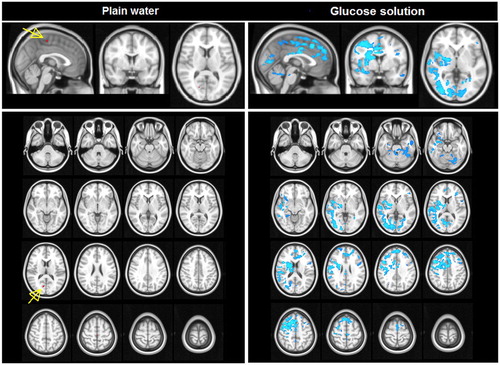
shows the changes in BOLD intensity after ingestion of plain water and glucose solution. After ingestion of plain water (, left panel), increased BOLD intensity was found in a small cluster in the intracalcarine sulcus and cingulate cortex. No decreases in BOLD intensities were found. After ingestion of glucose solution (, right panel), the BOLD intensity was significantly decreased in large clusters containing the insula, thalamus, anterior cingulate gyrus, orbitofrontal cortex, amygdala, hippocampus, and the occipital cortex (intracalcarine cortex, lingual gyrus, and lateral occipital cortex). Additionally, decreases in BOLD intensity were also found in the brainstem and cerebellum.
Figure 1 BOLD intensity changes after ingestion of plain water and glucose solution (FWE corrected). Left panel: plain water ingestion, right panel: glucose solution ingestion. Decrease in BOLD signal are shown in blue scale, increases are shown in red–yellow scale (indicate by yellow arows).
Eigenvector centrality changes
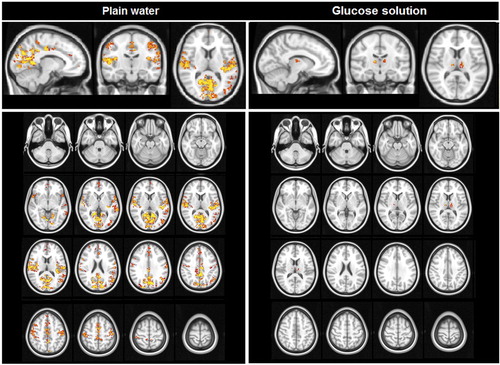
shows the changes in eigenvector centrality after ingestion of water and glucose solution. After ingestion of plain water (, left panel), large clusters of significant bi-lateral increases in eigenvector centrality were found in the post-central gyrus, transverse temporal gyrus, the precuneus and throughout the cingulate gyrus, both in the anterior and posterior division. These increases in Eigenvector centrality after drinking water indicate an increased level and quality of voxel-wise connectivity in these brain areas. After ingestion of glucose solution (, right panel), a small significant bi-lateral increase in eigenvector centrality in the thalamus was observed. Neither of the study conditions led to significant decreases in eigenvector centrality.
Figure 2 Eigenvector centrality mapping after ingestion of plain water and glucose solution (FWE corrected). Changes in centrality after ingestion of plain water and glucose solution. Increases in ECM are shown in red–yellow scale.
Network connectivity changes
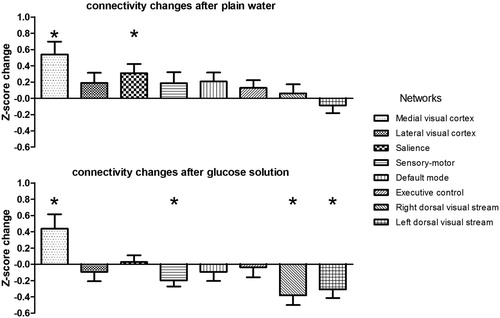
shows the change in Z-score for the eight functional connectivity networks when comparing pre- and post-ingestion after plain water (, top panel) and after glucose solution (, bottom panel). Ingestion of plain water led to increased functional connectivity in the medial visual (FDR corrected P = 0.016) and salience network (FDR corrected P = 0.048). After ingestion of glucose solution, functional connectivity increased in the medial visual network (FDR corrected P = 0.042), whereas functional connectivity was decreased in the sensory-motor network (FDR corrected P = 0.042), and left (FDR corrected P = 0.032) and right (FDR corrected P = 0.032) dorsal visual stream network.
Figure 3 Changes in network functional connectivity before and after ingestion of plain water and glucose solution. Network connectivity changes (mean Z-score per network) are shown for plain water (top panel) and glucose solution (bottom panel). *FDR corrected P < 0.05.
Discussion
Our data show that after an overnight fast, ingestion of glucose solution and plain water led to very different brain fMRI responses compared to the pre-ingestion condition. After ingestion of glucose solution, large areas of the brain showed decreased BOLD activity and several functional networks showed decreased connectivity. In contrast, ingestion of plain water led to an increased voxel based and network connectivity.
Effects of glucose ingestion on brain activity and connectivity
Ingestion of glucose solution resulted in a decrease in BOLD signal, indicating decreased neuronal activity in many areas of the brain which are known to be associated with reward, reward learning, and feeding behavior.Citation1,Citation23–25 The occipital clusters that show a decrease in BOLD signal are likely all involved in visual processing of food cues.Citation24 Our findings combined with earlier studies suggest that brain activity is diminished after receiving energy, whereas in a fasted state these brain regions were active in seeking reward or seeking energy.Citation6,Citation7,Citation26
On the network level, a decreased connectivity was found in the sensory-motor and right and left dorsal visual stream networks after ingestion of glucose. These decreases in network connectivity are probably correlated with the results of BOLD analyses showing a decreased BOLD signal throughout clusters that overlap with the functional networks. The sensory-motor network is involved in visceral perception and reward-based learning.Citation27 Changes in connectivity in this network in response to glucose could reflect the taste perception of the sweetness of glucose and could influence subsequent ingestion because of reward learning. In addition, the sensory-motor network is involved in visceral perception. Therefore, changes in connectivity could be caused by increases in blood glucose levels after ingestion of glucose,Citation27 which could reflect energy sensing. Indeed, we found a significant correlation between blood glucose levels and Z-scores in the sensory-motor network in our study population (data not shown). Furthermore, a recent study has shown disruptions within the sensory-motor network connectivity in patients with type 2 diabetes that were associated with blood glucose levels.Citation28 Taken together this suggest that the response of sensory-motor network found in our study could be important in maintaining glucose homeostasis. Finally, the difference in changes in connectivity found in the dorsal visual stream network could indicate effects on food seeking behavior, since visual processes are involved in determining salience,Citation29 and approach behavior associated with food stimuli has been found to influence visual attention.Citation30 Additionally, visual food cues, that are processed by these visual networks, have been shown to influence the response in neural circuits involved in energy homeostasis and reward processing.Citation24 Taken together, the changes in activity and connectivity in visual areas and networks is likely involved in reward processing and decreases in energy seeking.
The effects of drinking glucose solution on the results of ECM was less pronounced. A small increase in level and quality of voxel-wise connectivity was only seen in a small part of the thalamus. This could be explained by the fact that the thalamus relays signals between the sub-cortical and cortical structures in response to glucose ingestion, leading to a higher connectivity strength even though the average activity of the areas might be decreased. Still, the observed effects are relatively small.
Effects of plain water ingestion on brain activity and connectivity
Ingestion of plain water resulted in reversed effects compared with ingestion of glucose solution. In contrast to the ingestion of glucose solution, drinking plain water did not result in any decreases in BOLD signal and led to an increased BOLD signal in small areas within the intracalcarine sulcus and cingulate cortex.
When investigating changes in brain connectivity, both with network analysis and Eigenvector centrality mapping, our data show that on both the voxel-wise and network level connectivity is generally increased after ingestion of plain water. Regions in which increased level and quality of voxel-wise connectivity was found were largely overlapping with functional networks that showed increased connectivity after drinking plain water. The transverse temporal gyrus is a part of the salience network,Citation13 the precuneus and cingulate gyrus are part of the default mode network and the post-central gyrus falls within the sensory-motor functional network.Citation13 The salience network, which also includes the insular and anterior cingulate cortex,Citation22 is generally considered to be involved in emotional arousal, reward sensitivity, and decision-making.Citation31 Connectivity changes in this network after plain water ingestion could therefore indicate an increased or continued energy and reward seeking. Indeed, several studies have shown an increased connectivity in the salience network in obesity that was linked to aberrant reward processing and overconsumption of energy.Citation32,Citation33 In general, ingestion of water after an overnight fast results in an increased BOLD signal and increased functional connectivity on both a voxel-wise and network level. It seems that where glucose decreases brain activity after an overnight fast, ingestion of plain water enhances brain activity, possibly associated with increased or continued reward and energy seeking.
Study limitations and strengths
A limitation of our study is that it was performed only in a very homogenous group of male volunteers and it can be expected that sex differences are present, since it is known that there are several sex-specific differences in responses to satiationCitation34 and energy metabolism,Citation35 which decreases the generalizability of our findings. A further limitation is that because our participants were fasted during the experiment extrapolation of our results to a non-fasted state might be limited, especially because we did not take into account the normal eating behavior of the participants when not asked to remain fasted. Furthermore, as the brain consumes large amounts of glucose by default, oral consumption of a glucose dose may have general and nonspecific effects on brain activity that are not specifically related to hedonic or energy regulating aspects of glucose intake. Additionally, because we used only a glucose stimulus, to be able to generalize our results to everyday sugar consumption future studies would have to be done using other (more complex) sugars and sweeteners that are commonly used in food and beverages. A strength of our study was our crossover study design, which allowed for a reliable within-subject comparison between interventions as participants were their own controls. A further strength was the hypothesis-free approach taking into account the whole brain changes versus a region of interest approach that makes assumptions beforehand.
Conclusions
In conclusion, our data show that the ingestion of both water and glucose led to changes in BOLD activity and functional connectivity on both a voxel-wise and network level throughout the brain. Our results show that after an overnight fast, drinking of plain water leads to activation and increased centrality of several brain areas, as well as concerted increased connectivity in brain networks that are associated with energy and reward seeking and expectation. On the contrary, ingestion of glucose in a fasted state leads to deactivation and decreased connectivity, which can be associated with satiation and reward effects in the brain and a decrease in energy seeking. Which in turn can stimulate future re-consumption of glucose due to the rewarding effects.
A possible driving factor for the functional brain responses found in our study could be circulating blood insulin levels, increased insulin is generally regarded as a satiety signal and low or decreased insulin as a hunger signal for the brain.Citation36 This is in line with our findings that glucose ingestion, associated with an increase in blood insulin, leads to changes in activity and connectivity that can be associated with satiation and reward effects. And that water ingestion, with continued low blood insulin, leads to increased activity and connectivity in that can be associated with energy and reward seeking.
Interestingly, the brain areas and networks that show functional responses to consumption of water and glucose in our study have also been implied to function differently in obesityCitation8,Citation14,Citation32,Citation33,Citation37–41 and type 2 diabetes.Citation28,Citation42–44 This suggests that maintaining the functional responses found in our study could be important for maintaining energy and glucose homeostasis.
Disclaimer statements
Contributors AMvO is PhD student at the Department of Radiology of the LUMC. JvdG, AAvdB, and AH are senior researchers at the Department of Radiology of the LUMC. MH and CB are both researchers employed by Unilever R&D. HP is professor at Department of Internal Medicine, Section Endocrinology of the LUMC. SARRB is professor at the Department of Radiology of the LUMC and the Institute of Psychology, Department of Methodology and Statistics of the Leiden University. AMvO collected the data, did the literature search, wrote the report and made part of the figures. AMvO, AAvdB, and AH analyzed the data. AMvO, AAvdB, AH, and JvdG interpreted the data. AH prepared part of the figures. JvdG, AAvdB, MH, CB, SARRB, and AMvO designed the study. All authors critically appraised and edited the report, and approved the manuscript before submission.
Funding The collection of the datasets used in this study was funded by Unilever Research and Development Vlaardingen B.V. The Netherlands.
Conflicts of interest MH and CB are both employees of Unilever Research and Development Vlaardingen B.V. The Netherlands. The other authors declare no competing interests.
References
- Morton GJ, Cummings DE, Baskin DG, Barsh GS, Schwartz MW. Central nervous system control of food intake and body weight. Nature 2006;443(7109):289–95. doi: 10.1038/nature05026
- Deem JD, Muta K, Scarlett JM, Morton GJ, Schwartz MW. How should we think about the role of the brain in glucose homeostasis and diabetes? Diabetes 2017;66(7):1758–65. doi: 10.2337/dbi16-0067
- Mergenthaler P, Lindauer U, Dienel GA, Meisel A. Sugar for the brain: the role of glucose in physiological and pathological brain function. Trends Neurosci 2013;36(10):587–97. doi: 10.1016/j.tins.2013.07.001
- Haase L, Cerf-Ducastel B, Murphy C. Cortical activation in response to pure taste stimuli during the physiological states of hunger and satiety. Neuroimage 2009;44(3):1008–21. doi: 10.1016/j.neuroimage.2008.09.044
- Ulrich M, Endres F, Kolle M, Adolph O, Widenhorn-Muller K, Gron G. Glucose modulates food-related salience coding of midbrain neurons in humans. Hum Brain Mapp 2016;37(12):4376–84. doi: 10.1002/hbm.23316
- Smeets PA, de Graaf C, Stafleu A, van Osch MJ, van der Grond J. Functional MRI of human hypothalamic responses following glucose ingestion. Neuroimage 2005;24(2):363–8. doi: 10.1016/j.neuroimage.2004.07.073
- Smeets PA, Vidarsdottir S, de Graaf C, Stafleu A, van Osch MJ, Viergever MA, et al. Oral glucose intake inhibits hypothalamic neuronal activity more effectively than glucose infusion. Am J Physiol Endocrinol Metab 2007;293(3):E754–E758. doi: 10.1152/ajpendo.00231.2007
- Jastreboff AM, Sinha R, Arora J, Giannini C, Kubat J, Malik S, et al. Altered brain response to drinking glucose and fructose in obese adolescents. Diabetes 2016;65(7):1929–39. doi: 10.2337/db15-1216
- Avena NM, Rada P, Hoebel BG. Evidence for sugar addiction: behavioral and neurochemical effects of intermittent, excessive sugar intake. Neurosci Biobehav Rev 2008;32(1):20–39. doi: 10.1016/j.neubiorev.2007.04.019
- Colantuoni C, Rada P, McCarthy J, Patten C, Avena NM, Chadeayne A, et al. Evidence that intermittent, excessive sugar intake causes endogenous opioid dependence. Obes Res 2002;10(6):478–88. doi: 10.1038/oby.2002.66
- Rada P, Avena NM, Hoebel BG. Daily bingeing on sugar repeatedly releases dopamine in the accumbens shell. Neuroscience 2005;134(3):737–44. doi: 10.1016/j.neuroscience.2005.04.043
- Forster BB, MacKay AL, Whittall KP, Kiehl KA, Smith AM, Hare RD, et al. Functional magnetic resonance imaging: the basics of blood-oxygen-level dependent (BOLD) imaging. Can Assoc Radiol J 1998;49(5):320–9.
- Beckmann CF, DeLuca M, Devlin JT, Smith SM. Investigations into resting-state connectivity using independent component analysis. Philos Trans R Soc Lond B Biol Sci 2005;360(1457):1001–13. doi: 10.1098/rstb.2005.1634
- Kullmann S, Heni M, Veit R, Ketterer C, Schick F, Haring HU, et al. The obese brain: association of body mass index and insulin sensitivity with resting state network functional connectivity. Hum Brain Mapp 2012;33(5):1052–61. doi: 10.1002/hbm.21268
- Wink AM, de Munck JC, van der Werf YD, van den Heuvel OA, Barkhof F. Fast eigenvector centrality mapping of voxel-wise connectivity in functional magnetic resonance imaging: implementation, validation, and interpretation. Brain Connect 2012;2(5):265–74. doi: 10.1089/brain.2012.0087
- Lohmann G, Margulies DS, Horstmann A, Pleger B, Lepsien J, Goldhahn D, et al. Eigenvector centrality mapping for analyzing connectivity patterns in fMRI data of the human brain. PLoS One 2010;5(4):e10232. doi: 10.1371/journal.pone.0010232
- Jenkinson M, Beckmann CF, Behrens TE, Woolrich MW, Smith SM. FSL. Neuroimage 2012;62(2):782–90. doi: 10.1016/j.neuroimage.2011.09.015
- Rombouts SA, Scheltens P, Kuijer JP, Barkhof F. Whole brain analysis of T2* weighted baseline FMRI signal in dementia. Hum Brain Mapp 2007;28(12):1313–7. doi: 10.1002/hbm.20349
- Smith SM, Nichols TE. Threshold-free cluster enhancement: addressing problems of smoothing, threshold dependence and localisation in cluster inference. Neuroimage 2009;44(1):83–98. doi: 10.1016/j.neuroimage.2008.03.061
- Pruim RH, Mennes M, van Rooij D, Llera A, Buitelaar JK, Beckmann CF. ICA-AROMA: a robust ICA-based strategy for removing motion artifacts from fMRI data. Neuroimage 2015;112:267–77. doi: 10.1016/j.neuroimage.2015.02.064
- Pruim RH, Mennes M, Buitelaar JK, Beckmann CF. Evaluation of ICA-AROMA and alternative strategies for motion artifact removal in resting state fMRI. Neuroimage 2015;112:278–87. doi: 10.1016/j.neuroimage.2015.02.063
- Seeley WW, Menon V, Schatzberg AF, Keller J, Glover GH, Kenna H, et al. Dissociable intrinsic connectivity networks for salience processing and executive control. J Neurosci 2007;27(9):2349–56. doi: 10.1523/JNEUROSCI.5587-06.2007
- Gibson CD, Carnell S, Ochner CN, Geliebter A. Neuroimaging, gut peptides and obesity: novel studies of the neurobiology of appetite. J Neuroendocrinol 2010;22(8):833–45.
- Schur EA, Kleinhans NM, Goldberg J, Buchwald D, Schwartz MW, Maravilla K. Activation in brain energy regulation and reward centers by food cues varies with choice of visual stimulus. Int J Obes (Lond) 2009;33(6):653–61. doi: 10.1038/ijo.2009.56
- Park BY, Seo J, Park H. Functional brain networks associated with eating behaviors in obesity. Sci Rep 2016;6:23891. doi: 10.1038/srep23891
- Trivedi BP. Neuroscience: dissecting appetite. Nature 2014;508(7496):S64–5. doi: 10.1038/508S64a
- Bolo NR, Musen G, Simonson DC, Nickerson LD, Flores VL, Siracusa T, et al. Functional connectivity of insula, basal ganglia, and prefrontal executive control networks during hypoglycemia in type 1 diabetes. J Neurosci 2015;35(31):11012–23. doi: 10.1523/JNEUROSCI.0319-15.2015
- Chen Y, Liu Z, Zhang J, Tian G, Li L, Zhang S, et al. Selectively disrupted functional connectivity networks in type 2 diabetes mellitus. Front Aging Neurosci 2015;7:233.
- Treue S. Visual attention: the where, what, how and why of saliency. Curr Opin Neurobiol 2003;13(4):428–32. doi: 10.1016/S0959-4388(03)00105-3
- Gable PA, Harmon-Jones E. Approach-motivated positive affect reduces breadth of attention. Psychol Sci 2008;19(5):476–82. doi: 10.1111/j.1467-9280.2008.02112.x
- Uddin LQ. Salience processing and insular cortical function and dysfunction. Nat Rev Neurosci 2015;16(1):55–61. doi: 10.1038/nrn3857
- Garcia-Garcia I, Jurado MA, Garolera M, Segura B, Sala-Llonch R, Marques-Iturria I, et al. Alterations of the salience network in obesity: a resting-state fMRI study. Hum Brain Mapp 2013;34(11):2786–97. doi: 10.1002/hbm.22104
- Kullmann S, Pape AA, Heni M, Ketterer C, Schick F, Haring HU, et al. Functional network connectivity underlying food processing: disturbed salience and visual processing in overweight and obese adults. Cereb Cortex 2013;23(5):1247–56. doi: 10.1093/cercor/bhs124
- Smeets PA, de Graaf C, Stafleu A, van Osch MJ, Nievelstein RA, van der Grond J. Effect of satiety on brain activation during chocolate tasting in men and women. Am J Clin Nutr 2006;83(6):1297–305. doi: 10.1093/ajcn/83.6.1297
- Varlamov O, Bethea CL, Roberts CT, Jr. Sex-specific differences in lipid and glucose metabolism. Front Endocrinol (Lausanne) 2014;5:241.
- Woods SC, Seeley RJ, Porte D, Jr, Schwartz MW. Signals that regulate food intake and energy homeostasis. Science 1998;280(5368):1378–83. doi: 10.1126/science.280.5368.1378
- Garcia-Garcia I, Jurado MA, Garolera M, Marques-Iturria I, Horstmann A, Segura B, et al. Functional network centrality in obesity: a resting-state and task fMRI study. Psychiatry Res 2015;233(3):331–8. doi: 10.1016/j.pscychresns.2015.05.017
- Lips MA, Wijngaarden MA, van der Grond J, van Buchem MA, de Groot GH, Rombouts SA, et al. Resting-state functional connectivity of brain regions involved in cognitive control, motivation, and reward is enhanced in obese females. Am J Clin Nutr 2014;100(2):524–31. doi: 10.3945/ajcn.113.080671
- Marques-Iturria I, Scholtens LH, Garolera M, Pueyo R, Garcia-Garcia I, Gonzalez-Tartiere P, et al. Affected connectivity organization of the reward system structure in obesity. Neuroimage 2015;111:100–6. doi: 10.1016/j.neuroimage.2015.02.012
- Stoeckel LE, Weller RE, Cook EW III, Twieg DB, Knowlton RC, Cox JE. Widespread reward-system activation in obese women in response to pictures of high-calorie foods. Neuroimage 2008;41(2):636–47. doi: 10.1016/j.neuroimage.2008.02.031
- Wijngaarden MA, Veer IM, Rombouts SA, van Buchem MA, Willems van Dijk K, Pijl H, et al. Obesity is marked by distinct functional connectivity in brain networks involved in food reward and salience. Behav Brain Res 2015;287:127–34. doi: 10.1016/j.bbr.2015.03.016
- Cui Y, Jiao Y, Chen YC, Wang K, Gao B, Wen S, et al. Altered spontaneous brain activity in type 2 diabetes: a resting-state functional MRI study. Diabetes 2014;63(2):749–60. doi: 10.2337/db13-0519
- Cui Y, Jiao Y, Chen HJ, Ding J, Luo B, Peng CY, et al. Aberrant functional connectivity of default-mode network in type 2 diabetes patients. Eur Radiol 2015;25(11):3238–46. doi: 10.1007/s00330-015-3746-8
- Cui Y, Li SF, Gu H, Hu YZ, Liang X, Lu CQ, et al. Disrupted brain connectivity patterns in patients with type 2 diabetes. AJNR Am J Neuroradiol 2016;37(11):2115–22. doi: 10.3174/ajnr.A4858