
 ?Mathematical formulae have been encoded as MathML and are displayed in this HTML version using MathJax in order to improve their display. Uncheck the box to turn MathJax off. This feature requires Javascript. Click on a formula to zoom.
Abstract
This study investigates and characterizes, via thermodynamic laws, a widely employed standard for measuring oxidation-thermal stability of lubricating greases—ASTM 5483—based on first-order chemical kinetics, using pressure differential scanning calorimetry (PDSC). Steps and active mechanisms in the controlled test are analyzed and modeled using energy and entropy transformations. Applying the degradation-entropy generation (DEG) theorem, oxidation induction time is related to accumulated oxidation entropy and entropy transfer by mass flow to obtain characteristic degradation coefficients. These DEG coefficients are calibrated using available measured data from the literature and subsequently used to predict induction times at various temperatures. DEG elements—trajectories, planes, and domain—presented here consistently characterized all greases studied. Results show that the high-pressure entropy transfer by oxygen mass flow in the final step of the ASTM 5483 procedure is the primary contributor to oxidation induction time, verifying the significance of this process in accelerating antioxidant depletion, which would otherwise take months to years under atmospheric conditions. DEG-predicted induction times at various temperatures are compared to induction times predicted by the first-order chemical kinetics model, revealing a close match. The new DEG model is also herein used to predict induction times at atmospheric pressure, whereas the first-order kinetics model is independent of pressure and limited to the specific conditions in ASTM 5483. The DEG approach has useful implications for the accelerated and unaccelerated evaluation of grease oxidation stability and grease useful life.
Introduction
Grease, a semipermanent semisolid lubricant, commonly lubricates bearings in machinery, vehicles, and other industrial equipment. Grease degrades mechanically, thermally, and chemically, eventually causing bearing failure if unchecked. Degradation is faster and more severe under certain high-load, high-temperature conditions. Oxidation and thermal stability of greases in bearing lubrication is crucial. Mechanical degradation from shear leads to a change in the grease microstructure that holds base oil. Mild shear only reorients the thickener material (usually fibers), whereas higher shear can break down the thickener. In most greases, this happens at relatively mild conditions due to molecules in the structure being physically (and not chemically) bonded. Chemical degradation requires more energy and in practice only occurs at high temperatures in the presence of oxygen. Usually, the grease base oil oxidizes, not the thickener.
Grease life is almost always tested at high temperatures to accelerate tests. Under these conditions, oxidation, usually the primary degradation mechanism, strongly determines grease life. Extrapolating test results to lower/practical temperatures requires a model, and the most commonly used method applies the Arrhenius equation. Grease life testing with full bearings is expensive and time-consuming. A model allows a more effective evaluation of greases.
Oil lubricants often consist of many types of molecules that chemically interact, especially mineral oils. Lubricating greases are even more complex. For example, the metal ions in many soap-based greases catalyze the oxidation of the grease base oils. To extend life, antioxidants are added during grease manufacturing. Oxidation—a series of chemical reaction steps that starts with highly reactive free radicals formed by broken chemical bonds—can be delayed or neutralized by antioxidants. This neutralizing reaction “consumes” antioxidants, and lubricant oxidation begins when the antioxidant concentration falls below a certain level. At high temperatures, this abrupt change (see, e.g., Ito et al. (Citation1)) corresponds to the moment when antioxidants deplete and grease life quickly ends. Thus, a grease oxidation model does not need to describe the full oxidative process but only needs to predict the so-called “induction time” when antioxidant protection ends. Tests and measurements can oxidize grease in an oven (high temperature) or a heated pressure chamber (further accelerated by high pressure and high oxygen concentration). The latter, standardized in ASTM 5483 (2), is widely used to qualify grease oxidation–thermal stability (or resistance to oxidation). The result of the test is often a part of grease specifications (Citation3). Extrapolating these severe test results to “real-world” conditions requires a model. A test performed at high temperatures only needs a simple Arrhenius equation. However, when grease is aged under high temperature, high pressure, and high oxygen concentration—the latter being most relevant (Citation4)—interpreting test results is nontrivial. This article introduces a thermodynamical approach based on the work of Osara and Bryant (Citation5) to properly characterize the oxidation behavior of grease.
Grease antioxidant decomposition and oxidation induction—first-order kinetics
Oxidation is a multistep process consisting of an auto-oxidation-initiation phase, a propagation phase, a chain branching phase, and a termination phase. In the initiation phase, antioxidants added to the grease react with free radicals to form inactive compounds (radical scavengers, primary antioxidants) or compose reaction products in less reactive material. The topic was reviewed by Reyes-Gavilan and Odorisio (Citation6). The oxidation–thermal stability of greases is commonly assessed using ASTM 5483 based on first-order reaction kinetics. This procedure at high temperature and pressure accelerates the decomposition of antioxidants to induce oxidation initiation. Via first-order kinetics, the rate of decomposition is (Citation7)
[1]
[1]
The instantaneous number of moles of antioxidants in the grease N is obtained by integrating EquationEq. [1][1]
[1] to obtain the exponential decay,
[2]
[2]
where N0 is the number of moles before the commencement of reaction, k is the temperature-dependent reaction rate constant given by the Arrhenius equation
[3]
[3]
k0 is the pre-exponential or frequency factor, E is the activation energy, R is the universal gas constant (8.314 J/kmol K), and T is the temperature in K. Rearrange EquationEq. [2][2]
[2] to obtain the time to decompose a fraction of the antioxidants as
[4]
[4]
Rewriting EquationEq. [4][4]
[4] in terms of fractional conversion
gives
[5]
[5]
When the antioxidant concentration is too low to be effective, oxidation begins. Rhee (Citation8) defined “induction time” tind when the fractional conversion X = 0.99.
Oxidation induction time measurement—The PDSC method (ASTM 5483)
EquationEquation [5][5]
[5] can estimate induction times at various temperatures after calibrating the rate constant k using measurements at two or more temperatures, per ASTM 5483.
ASTM 5483 describes a laboratory-controlled method to measure the oxidation induction time of greases under high pressure (3.5 MPa) and temperature (a constant test value chosen between 155 and 210 °C) using a pressure differential scanning calorimeter (PDSC). As demonstrated by Rhee, grease-specific parameters on the right side of EquationEq. [3][3]
[3] are determined from measurements of induction time tind at two or more temperatures. Substituting tind for t into EquationEq. [5]
[5]
[5] yields rate constant k. The slope of ln k versus 1/T yields the ratio E/R (via a rearranged EquationEq. [3]
[3]
[3] , similar to the van’t Hoff equation (Citation7)), which has been shown to be constant for a particular grease. The frequency factor k0, also a constant, is evaluated by rearranging EquationEq. [3]
[3]
[3] with known k (via tind), prescribed temperature T, and the estimated E/R. Step-by-step depiction of the ASTM 5483 method is given next, along with the thermodynamic characterization of each step.
Thermodynamics
Fundamental irreversible thermodynamics concepts are applied to the ASTM 5483 procedural steps, based on the laws of thermodynamics.
First and second laws of thermodynamics
Describing energy conservation in a thermodynamic system, the first law (Citation7)
[6]
[6]
equates the internal energy change dU in a system to the sum of the heat transferred δQ to the system, the work done δW by the system, and the compositional changes
in the system, including mass flow in and out of the control volume. For convenience, indices were dropped from the summation and its terms.
Describing the irreversible loss of energy during a transformation, the second law (Citation7) for a closed system
[7]
[7]
states that the entropy change dS in a system is the sum of the entropy transfer
(which can be positive or negative) and entropy generation
(which is always positive).
Combining the first and second laws, EquationEqs. [6][6]
[6] and Equation[7]
[7]
[7] , yields
[8]
[8]
which is the irreversible form of the “TdS” equation where heat transfer δQ was replaced by thermal energy change TdS and irreversible energy dissipation TδS’, and where the work
on the system is assumed to be compression PdV.
The PDSC steps (active mechanisms: thermal, open, chemical)
The pressure differential scanning calorimeter (PDSC) prescribed by ASTM 5483 for testing grease oxidation–thermal stability has a chamber in which a grease sample is heated and oxygen is added until a pressure of 3.5 MPa is reached. See idealized temperature and pressure profiles in (when available, actual measurements should be used).
Figure 1. Assumed temperature and pressure profiles in ASTM 5483’s pressure differential scanning calorimetry for testing oxidation–thermal stability of greases: t0 = 0 min, t1 = 2 min, t2 = 4 min, t3 = tinduction. (Equilibration periods between steps have been omitted.)
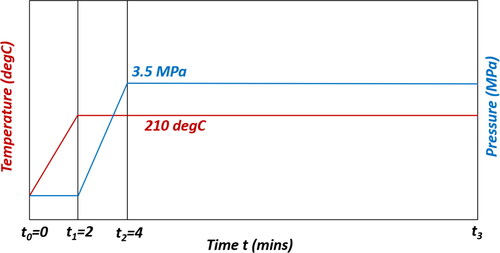
The steps of the test are:
Step I, from time t0 to t1 (about 2 min duration): Heat grease sample from ambient temperature (e.g., 22 °C) to test temperature (e.g., 210 °C) at 100 °C/min.
Step II, from time t1 to t2 (2 min duration): Add oxygen to the chamber at a rate of 1.75 MPa/min until the pressure P is 3.5 MPa, while holding temperature T at the test temperature.
Step III, from time t2 to t3 (until induction): Continue to add oxygen to the chamber, holding the chamber pressure at 3.5 MPa with a purge rate of 100 mL/min, and at the test temperature T until oxidation occurs.
ASTM 5483 also includes equilibration periods between steps. These periods, irrelevant to the current study, have been omitted.
For constant-volume, open-system heating with chemical reaction, enthalpy, via a Legendre transform of internal energy (i.e., H = U + PV), is a convenient potential for describing active energy changes. Differentiating H and substituting EquationEq. [8][8]
[8] into the resulting equation yields the change in enthalpy,
[9]
[9]
where
indicates that the enthalpy change dH between thermodynamic states is the same, whether the process follows an irreversible path or a reversible path (i.e., a change of state variables from one thermodynamic state to another is path-independent). Rearrange EquationEq. [9]
[9]
[9] to obtain entropy generation,
[10]
[10]
The last numerator term, dHrev, the reversible change in enthalpy—constant under specified conditions (e.g., standard enthalpy of formation, enthalpy of reaction, heating values, etc.)— replaced of the irreversible path traversed by EquationEq. [10]
[10]
[10] . Osara and Bryant defined the first three terms as phenomenological entropy (Citation5),
[11]
[11]
which measures entropy contributions from active dissipative processes. In the preceding formulations,
that is, the change in energy due to internal composition
is the sum of all chemical reactions
and changes due to mass flow across the system boundary
Now apply EquationEq. [11][11]
[11] to each step in ASTM 5483 for grease oxidation induction.
Step I, from time t0 to t1 (heat grease for 2 min): Assuming constant-volume, constant-pressure heating, phenomenological entropy accumulated from t0 to t1, in rate form, is
[12]
[12]
Via the thermal energy balance, in the absence of internal heat generation and with the applied heat raising the thermal energy of the grease and air in the pressure chamber, EquationEq. [12][12]
[12] can be rewritten in terms of more measurable properties,
[13]
[13]
where m is composite (grease and air) system mass, c is composite system heat capacity, and
is instantaneous temperature change rate. With test-specified 2 mg of grease and
100 °C/min,
varies primarily as grease heat capacity, which may be assumed constant for practical purposes.
Step II, from time t1 to t2 (add oxygen for 2 min at constant temperature): Constant-volume, constant-temperature heating of a semi-open system yields
[14]
[14]
According to ASTM 5483, induction time measurement starts at the beginning of step II.
Step III, from time t2 to t3 (add oxygen at constant temperature and pressure until induction): Active consumption of antioxidants occurs during this step. Constant-volume, constant-temperature heat addition and chemical reaction in an open system yield
[15]
[15]
Oxidation occurs at the incident of an exotherm, which involves a sudden release of heat. Recall that oxidation induction (or instability) is the point at which antioxidant depletion is 99%. Since entropy changes cannot be directly measured, the first right-hand-side term in EquationEqs. [14][14]
[14] and Equation[15]
[15]
[15] can be replaced with the measurable heat transfer into the system; that is, in both steps II and III during which temperature is held constant,
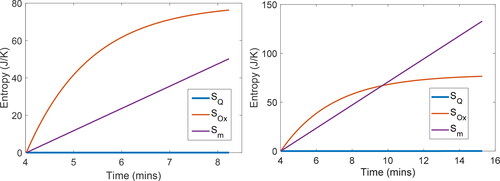
The total entropy accumulated from test start to induction point (traversing the steps above, ends of which demarcate the boundaries in the integrals) is
[16]
[16]
which, via substitution, becomes
[17]
[17]
Defining a variable for each term in EquationEq. [17][17]
[17] and separating the terms in the second and third steps, the total phenomenological entropy is
[18]
[18]
where
is thermal entropy,
is entropy flow due to heat transfer (which moves heat),
is the pressure change entropy,
is the entropy flow due to mass transfer in/out of the control volume, and
is the oxidation entropy;
and
are the three sequential steps of the PDSC process.
The degradation-entropy generation (DEG) methodology
The degradation-entropy generation (DEG) theorem, proposed by Bryant, Khonsari, and Ling (Citation10), directly relates a system’s observable (or measureable) degradation measure to its active entropy generations
from individual dissipative processes indexed by i. Mathematically,
[19]
[19]
where
are degradation coefficients (partial slopes of w vs.
and the summation anticipates various dissipative processes (characterized by energies pi that depend on the phenomenological variables that control the process) that may be active. Proof, generalized procedure, and application of the DEG theorem to adhesive wear can be found in (Citation10). Note that Eq. Equation[19]
[19]
[19] is expressed in the integrated form of the DEG theorem. Since w can be any conveniently measured, typically existing parameter, the DEG theorem can be and has been applied to multidisciplinary, multicomponent systems undergoing transient and nonlinear loads (Citation5, Citation11–16). The entropies
generated (which cannot be observed, only calculated), depend on the energies
(also calculated), which depend on the measurable phenomenological variables. Application of the DEG theorem to characterize how grease mechanically degrades via shearing action alone, can be found (Citation17, Citation18).
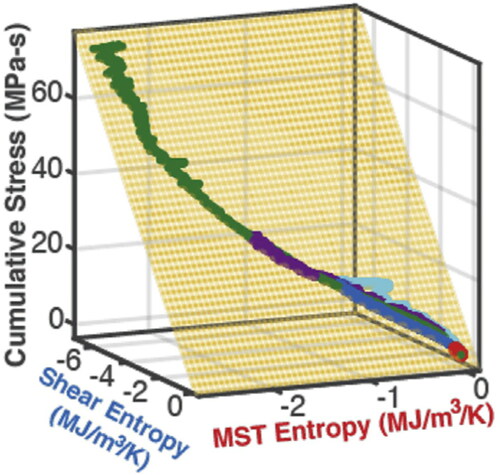
Osara and Bryant (Citation5, Citation11–16) extended the original DEG approach as i, identify the active dissipative mechanisms; ii, formulate phenomenological entropy generation consisting of entropy terms, one for each active mechanism; iii, measure or estimate the transformation/degradation parameter; iv, plot degradation versus entropy generations; and v, obtain the DEG coefficients from the orthogonal slopes of the planes on which the degradation-entropy generation plot lays. The authors demonstrated the new DEG methodology involving multiple simultaneous dissipative mechanisms contributing to degradation, and derived characteristic geometric elements that consistently model the transformation and evolution of real systems: the multidimensional plot of degradation measure versus entropy generation terms, named the DEG trajectory, which lays on a planar surface, named the DEG plane, enclosed in a multidimensional space, the DEG domain. Choosing cumulative stress as degradation measure w, Osara and Bryant (Citation5) characterized the simultaneous mechanical and thermal degradation of grease. Their model is
Here
is the mechanical shear entropy generated by the mechanical shear work on the grease,
is the microstructurothermal (MST) entropy generated by the thermal energy stored and dissipated in the grease from the mechanically produced heat (or externally transferred heat), and
and
are the corresponding degradation coefficients. This DEG model yielded the DEG elements in for an aviation grease (NLGI 4) under repeated mechanical shear. The different length trajectories, all laying on the same DEG plane in the DEG domain, signify different test durations. Similar DEG elements were published for general fatigue, batteries (lithium-ion and lead–acid) (Citation12, Citation14), and other electrochemical power sources (Citation11).
Figure 2. The degradation-entropy generation (DEG) trajectories, plane and domain, characteristic elements of the new DEG methodology. Reproduced from (Citation5).
The oxidation induction DEG model
DEG methods allow the use of convenient or existing transformation measures. Pressure differential scanning calorimetry (PDSC) measures induction time as characteristic of the oxidation stability of greases at different temperatures. For compatibility with existing data and to be consistent with industry practice, we use time as a transformation measure, yielding the DEG governing equation for the entire PDSC test as
[20]
[20]
Substituting EquationEq. [18][18]
[18] for
into EquationEq. [20]
[20]
[20] gives
[21]
[21]
where
is the composite time for the entire PDSC process. A breakdown of EquationEq. [20]
[20]
[20] is given in Appendix A. Considerable antioxidant depletion does not start until step III, as outlined above, and entropy transfer by heat
contributes minimally to total entropy; see (shown later) and the “Results analysis and discussion” section for an order-of-magnitude analysis. Neglecting steps I and II terms, and step III’s
we correlate entropy transfer by mass flow
and oxidation entropy
to the measured oxidation induction time to obtain the oxidation induction DEG model,
[22]
[22]
Partial derivatives of induction time with respect to the individual entropies yield the degradation coefficients: and
Since induction time tind is a function of temperature, the DEG coefficients are functions of temperature (temperature and pressure are usually taken as independent thermodynamic states). Subsequent sections obtain DEG coefficients from measured induction times at various temperatures, and use these coefficients to predict induction times under conditions for which measurements are not available. Other features of the model are deduced and discussed.
Oxygen as active and reactive species
The stoichiometry of the chemical reaction in which antioxidant AO and oxygen O2 are the reactants and oxidation induction radicals IR are the products indicates (Citation7, Citation19)
[23]
[23]
where
is each species’ stoichiometric coefficient, and the “|” indicates that the subscripts apply to the quantities. In a control volume (e.g., a pressurized chamber), conveniently measureable oxygen O2 depletion is a direct quantifier of antioxidant consumption and eventual initiation/induction of grease oxidation. This study uses oxygen as the active/reactive species in the thermodynamic analysis.
The ideal gas model
For convenience and simplicity, this study models the control volume’s oxygen composition as an ideal gas (notably more accurate at high pressures). This approach can be extended to other gas models and measurements of model variables. The ideal gas equation of state
[24]
[24]
relates the number of moles N of a gas in a chamber of volume V to pressure P and temperature T, where R is the gas constant. The number of initial moles of oxygen N0 in the chamber at t = t2 (start of step 3) is obtained using pressure P0 = 3.5 MPa and T0 = constant test temperature selected between 155 °C and 210 °C, as recommended by ASTM 5483. With measurements of pressure and temperature, the rates of inflow and/or outflow are
For an ideal gas, the chemical potential
is linear in temperature and logarithmic in pressure. Values of
for oxygen can be obtained from published standard properties at temperature T0 and pressure P0.
Entropy transfer by mass flow
Steps II and III involve the flow of oxygen into and out of the chamber (the control volume). The specific entropy of an ideal gas at a given temperature and pressure, relative to a reference state, is (Citation20)
[25]
[25]
where
and
are the reference temperature and pressure, respectively. Typical standard values are
K and
101.325 kPa, at which
Step II has only inflow. Combining EquationEq. [25]
[25]
[25] with mass flow rate
gives entropy transfer by mass flow into the pressure chamber as
[26]
[26]
where
is molar mass and
Similarly, in step III involving inflow and outflow, entropy transfer by mass is
[27]
[27]
where i and o are subscripts representing inflow and outflow, respectively.
Oxidation entropy
The entropy due to the chemical reaction only—during step III when consumption of antioxidant takes place until induction point—is defined in EquationEq. [18][18]
[18] as oxidation entropy,
When possible, oxygen consumption rate
should be determined experimentally. Without such measurements, an available model such as the first-order reaction kinetics, EquationEqs. [1]
[1]
[1] and Equation[2]
[2]
[2] , can be employed. With the pressure-dependent chemical potential
, the oxidation entropy (based on first-order reaction kinetics) becomes
[28]
[28]
where the negative sign indicates decomposition.
Substituting EquationEqs. [27][27]
[27] and Equation[28]
[28]
[28] into the DEG model, EquationEq. [22]
[22]
[22] , yields
[29]
[29]
Based on typically recorded and published data in PDSC experiments, EquationEq. [29][29]
[29] is a convenient and practical form of the DEG model using the ideal gas and first-order kinetics. When used consistently, EquationEq. [29]
[29]
[29] meets the robust requirement of characterizing oxidation–thermal stability of greases under various conditions specified by values of the model variables. Other suitable models (e.g., real gas and second-order kinetics) can be used.
Experimental
Data from ASTM 5483 tests published by Rhee (Citation8) and Rezasoltani and Khonsari (Citation21) are used to verify the formulations. Rhee tested automotive grease (Grease A in and ) and aviation grease (Grease B in and ) with different base oils and thickeners of the same consistency.
Table 1. Constitutional and physical properties of Rhee's greases, A and B.
Table 2. Measured induction times from PDSC at various temperatures.
presents measured induction times tind (in minutes) at various temperatures for both greases. and are reproduced from an appendix in reference (Citation8).
presents the properties of greases C and D, with different base oils and consistencies but the same thickener, tested by Rezasoltani and Khonsari (Citation21), and presents the measured induction times tind. The authors also measured exotherm profiles during step III for greases C and D; see .
Figure 3. Exotherm measured during step III of the PDSC test procedure for grease C at 220°C. Reproduced from (Citation21).
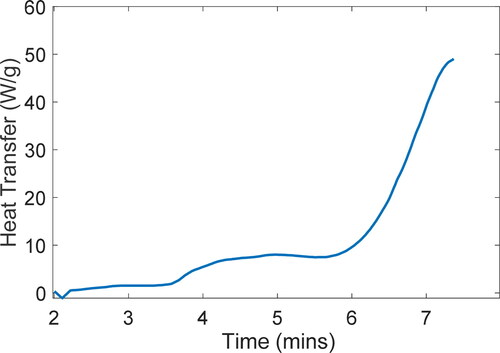
Table 3. Constitutional and physical properties of Rezasoltani and Khonsari’s greases, C and D.
Table 4. Measured induction times from PDSC at various temperatures.
Each temperature data set in and is an entire experiment; hence, 15 experiments are analyzed.
Results analysis and discussion
Published property values and the aforementioned experimental data are substituted into the formulations to estimate entropy accumulation during the PDSC process, and quantify/calibrate the DEG model to obtain degradation coefficients. The coefficients are then used to predict induction times under conditions that were either not measured or measurable. Trends discussed in this section apply to all four greases tested at the various temperatures, in different laboratories and at different times.
Phenomenological entropy during the PDSC test
Recall EquationEq. [13][13]
[13] , for the characteristic of step I of the PDSC process, where phenomenological entropy
depends on mass, specific heat capacity, and temperature. With test-specified mass (mgrease = 2 mg) and temperature change, and similar heat capacities (∼2 J/g K) for most greases,
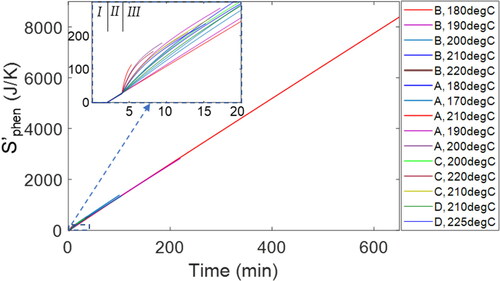
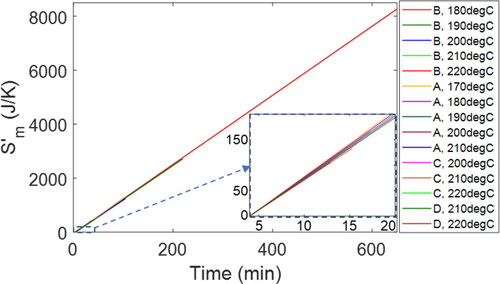
is nearly constant for all greases. Recall that grease oxidation is less common at temperatures below 100 °C. Hence, step I accelerates the onset of antioxidant decomposition by increasing grease sample temperature to the specified test temperature. Step I, not included in the measured induction time, contributes negligible entropy generation (about 0.08% of total entropy generation). This is visualized by the approximately horizontal profile during the first 2 min of the phenomenological entropy trajectories plotted in for all greases (A–D) studied.
Step II involves a significant increase in pressure (35 times the initial value) and the compositional change due to mass inflow produces substantial entropy. Due to the universal use of oxygen in place of each specific grease tested, the specified pressure change, the constant volume, and the specified duration of 2 min, step II’s phenomenological entropy is nearly the same for all greases, with
likely to contribute the minimal variation present. Similar to step I, shows the overlap of all entropy profiles during step II. However, unlike step I with minimal entropy contribution, step II contributes 2% to 25% of the total PDSC entropy production; the actual percentage depends on oxidation induction time, which determines step III’s duration, and varies for the different greases.
Figure 4. Total phenomenological entropy generation accumulated during the PDSC test, ASTM 5483, for greases A–D at various temperatures. See inset for the first 20 min of
a closeup of steps I and II.
In step III, consumption of antioxidants (approximately 99%) occurs in addition to mass flow (in and out) and heat transfer; see EquationEq. [15][15]
[15] . Varying values of induction time for different greases and different temperatures impact step III’s phenomenological entropy,
Entropy profiles during step III differ considerably for the different greases, and the effect of temperature on oxidation (of the same grease) can be observed. The insert in shows the branching of step III entropy profiles. In addition, step III contributes most (about 75 to 98%) of the total entropy accumulation during the entire test (supporting the neglect of the entropies produced during steps I and II; see earlier description). Step III is the grease characterization step. Values of phenomenological entropies and other important model parameters are presented in for all greases studied. The highest
is observed in grease B at 180 °C, and the lowest
is found in grease A at 210 °C.
Table 5. Entropy and DEG analysis results for all the greases studied (A–D).
Order of magnitude analysis—neglecting heat transfer
Most ASTM 5483 studies do not publish heat transfer profiles during the PDSC test, needed in EquationEq. [17]
[17]
[17] . To verify the significance (or lack of significance) of the heat transfer entropy
to total entropy generation, plots the various components of phenomenological entropy
during step III for greases C and D. Note the small
In (grease C at 220 °C), final values are
= 0.011 J/K,
= 76.3 J/K, and
= 50.2 J/K. In (grease D at 225 °C),
is 0.079 J/K,
is 76.5 J/K, and
is 132.9 J/K. Total phenomenological entropy
(column 6 of ) values show that step III’s
(column 4) and
(column 5) contribute between 75% and 98% of total entropy accumulated for all greases studied (with step II’s high-pressure inflow
making up most of the remainder). Hence, entropy transfer by heat
is deemed negligible in the PDSC process, justifying the neglect of
in the second section and EquationEq. [22]
[22]
[22] .
Figure 5. Time-based profiles of each active entropy term in step III of the PDSC process showing that heat transfer contribution to entropy is negligible. (a) Grease C at 220°C and (b) grease D at 225°C.
Proceeding at comparable initial rates, linear with time, and
exponential with time, dominate phenomenological entropy generation. In , in which induction time is about 6 min,
<
In , with induction time of about 10 min,
>
Entropy transfer by mass flow 
ASTM 5483 specifies inlet (155—210 °C and 3.5 MPa) and exit (100 mL/min flow rate, ambient temperature and pressure) conditions of oxygen flow through the pressure chamber, from which specific entropy, EquationEq. [25][25]
[25] , can be evaluated to obtain entropy transfer by mass flow
EquationEq. [27]
[27]
[27] . plots
versus time. The rate of entropy transfer by mass flow
nearly the same for all greases, as shown in slopes, varies minimally with temperature. The final value of
depends on each grease’s oxidation induction time. plots of
for all greases show similar slopes (temperature-dependent rates) but varying lengths (induction time-dependent accumulation). Grease B at 180 °C, with the longest oxidation induction time (648 min) of all the greases studied, has the largest
value of 8271 J/K. Grease A at 210 °C, with the shortest induction time (3.3 min), has the lowest
value of 16 J/K.
Figure 6. (a) Time-based profiles of entropy transfer by mass flow vs. time for all the greases studied. See inset for the first 20 min of all the trajectories, a closeup of the shorter-duration greases.
The rate of entropy transfer by mass flow is determined primarily by the high-pressure condition at the chamber inlet, given by the test temperature. In EquationEq. [25]
[25]
[25] , the temperature ratio Tinlet/Texit during step III for test temperatures between 170 and 225 °C—defining Tinlet—and with Texit of 22 °C is between 1.5 and 1.7 (after conversion to K), while the pressure ratio Pinlet/Pexit is 35. Hence,
is predominantly linear in temperature (with a slight curvature anticipated by the logarithmic relationship in EquationEq. [25]
[25]
[25] ). Upon integration from t2 to induction time t3, the accumulated value
inherits the induction time’s exponential relationship with temperature. plots the temperature dependence of
for greases A–D, which can be used to predict
when only temperature is known.
Figure 7. Entropy transfer by mass flow vs. temperature for all the greases studied (total of 15 tests). See inset for a closeup of the greases with low values of . R2
0.998.
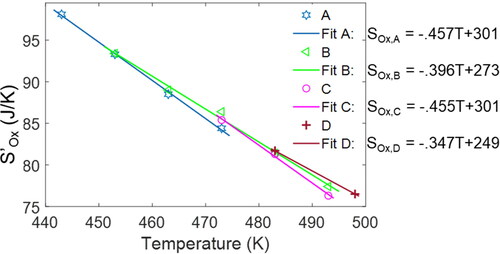
Oxidation entropy
Via the exponential decay in first-order kinetics, see EquationEq. [28][28]
[28] , all greases show similar oxidation entropy
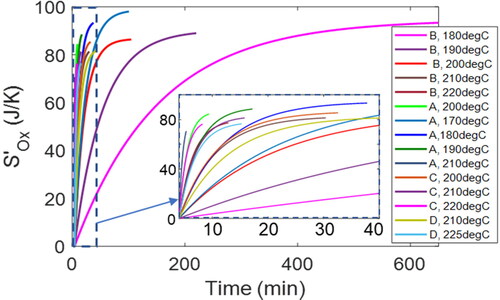
profiles. Overall values indicate “weak” dependencies on temperature and time. plots oxidation entropy (vs. time) profiles at various temperatures for greases A–D, showing values that range from 71 J/K (grease A at 210 °C) to 99 J/K (grease A at 170 °C). The first 40 min of all oxidation entropy
trajectories are plotted in the inset for a closeup of the shorter duration greases.
Figure 8. Time-based profiles of oxidation entropy for all the greases studied. See inset for the first 40 min of all the oxidation entropy trajectories, a closeup of the shorter duration greases.
The rate of oxidation entropy is an exponential function of the reciprocal of temperature via the reaction rate constant k, notwithstanding the linearity introduced by the chemical potential; see EquationEq. [28]
[28]
[28] . Upon integration with respect to induction time (from t2 to t3), which has a similar exponential relationship with temperature, the accumulated values
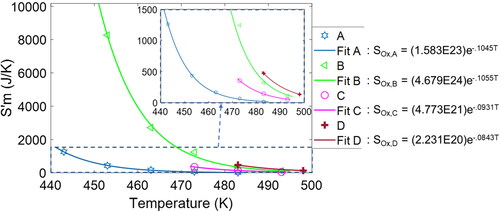
become more linear in temperature; see , which plots
versus temperature, where slopes vary slightly for different greases. This relationship can be used to estimate oxidation entropy
given temperature only, and combined with
estimated from the relationship in for induction-time predictions.
Figure 9. Oxidation entropy vs temperature for all the greases studied including the accompanying linear fits, with R299.
Oxidation induction time characterization—calibration using experimental data
With values for parameters in EquationEq. [5][5]
[5] , the first-order kinetics model, and the DEG model of EquationEq. [29]
[29]
[29] , obtained from measured induction times, a grease’s oxidation-thermal stability can be characterized. From the Introduction section, a PDSC test is limited to specific test conditions that accelerate oxidation–- induction (T = 155–220 °C and P = 3.5 MPa). However, most greases operate at significantly lower temperatures and pressures, necessitating induction time predictions at these conditions. After calibrating the models using measured data at different test temperatures, induction times at other conditions can be predicted. We next demonstrate the first-order kinetics approach, present the new DEG elements, and compare results from both methods.
First-order kinetics characterization
The ASTM 5483 procedure calibrates the first-order kinetics model using data from two or more test temperatures. Combining EquationEqs. [3][3]
[3] and Equation[5]
[5]
[5] and substituting X = 0.99 gives
[30]
[30]
Substituting the test temperatures T and measured induction times tind from into EquationEq. [30][30]
[30] evaluates E and k0, which are grease-dependent but temperature-independent. Substituting these E and k0 values back into EquationEq. [30]
[30]
[30] allows the prediction of induction times at other temperatures. The values of E and k0 for all greases studied have been published (Citation8, Citation21).
Degradation-entropy generation (DEG) characterization
To calibrate the DEG model of EquationEq. [29][29]
[29] , Equation1
[1]
[1] ) obtain entropy profiles
and
2) linearly correlate these with induction time
and 3) obtain degradation coefficients
and
A three-dimensional (3-D) plot () of values of a transformation measure (induction time tind) versus values of entropy generation components (oxidation entropy
and entropy transfer by mass flow
) has DEG trajectories on DEG planes with orientations (partial, orthogonal slopes) that define and quantify the degradation coefficients (
and
). In , all DEG trajectories for all greases and all 15 tests lie on the same single DEG plane (grease B’s DEG plane at 180 °C) within the DEG domain, and all have goodness of fit R2 = 1.
Figure 10. (a) DEG domain enclosing all 15 DEG trajectories traced by all four greases (A–D) at all temperatures tested, and the DEG plane obtained from grease B at 180°C. The different paths traced visualize the varying values of BOx recorded in . (b) End view of the DEG domain, showing that all greases approximately lie on the same DEG plane, visualizing the near-constant universal value of about Bm 0.08 min K/J for all greases at all temperatures; see . R2 = 1 for all 15 test cases.
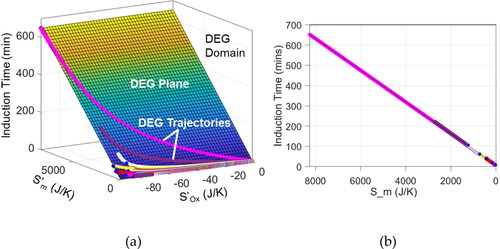
Values of the degradation coefficients obtained from data measured for all greases tested at various temperatures are presented in columns 7 and 8 of . In , the diverse lengths and paths of the DEG trajectories show the dependence of induction time and oxidation coefficient on grease type and temperature, verifying the values in . , an end view of , shows the coincidence of all trajectories with a single DEG plane and a near-constant mass flow coefficient
0.08 min K/J (the partial slope of the plane) given in .
Since the degradation coefficients are influence functions denoting the contributions of the entropy generation terms to induction time, the much larger values of verify that the high-pressure oxygen flow significantly accelerates antioxidant depletion, and hence induction time.
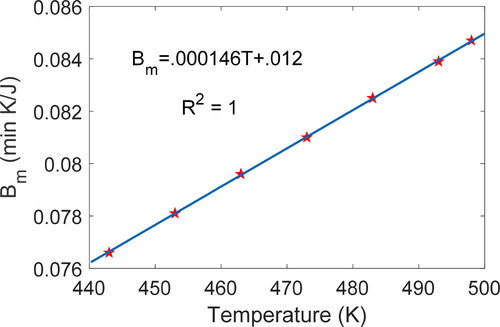
Temperature dependence of the DEG coefficients
Via the thermodynamic state and DEG EquationEq. [29][29]
[29] , the degradation coefficients depend on the independent thermodynamic state variables, temperature and pressure. Since the rate of entropy transfer by mass flow
=
/dt is comparable to the inverse of the DEG mass flow coefficient
via the properties of
discussed in the fourth section, Bm is nearly linear in temperature. The partial differential
reverses the exponential profile introduced to
via induction time integration of
and isolates the nonlinearities in
due to the logarithmic function in Eq. [25], yielding near-perfect linearity with temperature. shows the mass flow coefficient
values independent of grease type but increasing with temperature T. , which plots
versus temperature T, constructed from the data, shows a linear universal relationship between
and T for all greases under the ASTM 5483 test conditions:
(31)
(31)
Figure 11. Mass flow coefficients (column 8 of ) vs. test temperatures and accompanying linear curve fit. One linear function of temperature is obtained for all greases. Some test points overlap.
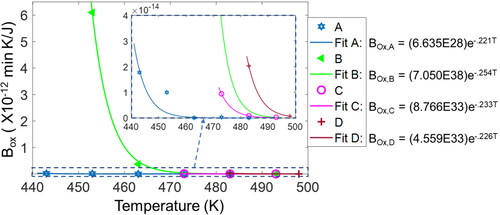
With oxidation entropy varying minimally and linearly with temperature T as discussed in the fourth section, oxidation coefficient
inherits induction time’s exponential temperature dependence.
is directly comparable to the inverse of oxidation entropy rate
which was shown to vary exponentially with temperature reciprocal via the reaction rate constant. , constructed from the data, plots
versus T; the accompanying curve fits show an exponential decay of the general form
(32)
(32)
where a and b are experimentally determined grease-dependent parameters. Empirically calibrated degradation coefficients are used in subsequent sections, predicting induction times that match the kinetics model predictions.
Figure 12. Plots and curve fits of oxidation coefficients obtained from measured induction times vs test temperatures. Each grease has a characteristic dependence of BOx on temperature.
Induction time predictions at other temperatures
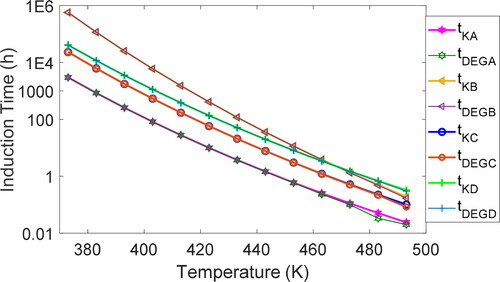
After calibrating the kinetics model using data from two different test temperatures, Rhee (Citation8) published predicted induction times for grease A at temperatures outside the test range, down to 100 °C. plots the oxidation induction times (vs. temperature) predicted by Rhee’s kinetics model and the DEG model for greases A–D for the temperature range of 100 to 220 °C. Kinetics and DEG predictions closely match: Data points overlap. Detailed tables of values are given in Appendix B.
Figure 13. Oxidation induction time predictions at 3.5 MPa using both the first-order kinetics and the DEG models for all four greases. Induction time axis scale is logarithmic.
Induction time predictions at other temperatures and pressures
The first-order kinetics model is independent of pressure. Hence, the calibrated PDSC kinetics model cannot be adapted to predict induction times at atmospheric and other pressures. In contradistinction, the DEG model has a logarithmic dependence on pressure via the chemical potential in EquationEq. [29][29]
[29] . As anticipated, entropy values computed at atmospheric pressure are significantly less than from the ASTM 5483 test at 3.5 MPa:
is reduced by a factor of about 36 at atmospheric pressure Patm, evidently due to the drop in pressure. Mathematically,
[33]
[33]
where, for atmospheric air, the partial pressure of oxygen—0.21Patm—is used in computing the entropies at atmospheric conditions. As discussed in the fourth section, both
and
vary linearly with temperature.
showed a drop an order of magnitude higher than the
drop. In addition, the drop in
due to the lower pressure shows the same exponential dependence on temperature for all greases:
decreases with increasing temperature, from about 550 times at 100 °C to 200 times at 220 °C. Mathematically,
[34]
[34]
for all greases. Recalling the fourth section’s discussion, both
and
vary exponentially with temperature, albeit at different rates, as indicated by EquationEq. [34]
[34]
[34] . Applying dimensional analysis and scaling, the test degradation coefficients are related to the atmospheric degradation coefficients via the inverse relationships
[35]
[35]
To predict induction times at atmospheric pressure and various temperatures, cross multiply and substitute for the DEG coefficients in the DEG model to yield
[36]
[36]
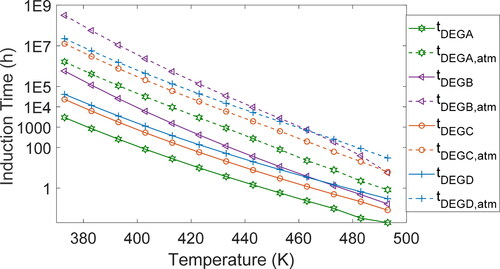
, which plots oxidation induction times versus temperature, presents DEG-predicted induction times at atmospheric pressure (0.1 MPa). As anticipated, atmospheric pressure induction times are significantly longer than induction times at the elevated test pressure of 3.5 MPa: Grease A oxidizes in 4 h at 3.5 MPa and in 900 h at atmospheric pressure. Tables of values for all the greases are given in Appendix B.
Figure 14. Oxidation induction time predictions at atmospheric pressure (0.1 MPa) and at PDSC pressure (3.5 MPa), from 100°C to 220°C, using the DEG model for all four greases. Induction time axis scale is logarithmic.
Summary and conclusion
Irreversible macroscopic thermodynamics was applied to a widely used standardized grease oxidation–thermal stability test, ASTM 5483. The first-order kinetics decomposition of antioxidants from the ASTM 5483 standard was discussed. Then each step of an enthalpy-based phenomenological entropy-DEG model, which combines the effects of all active mechanisms, was analyzed with oxygen treated as an ideal gas. The insignificance of entropy transfer by heat to total entropy was demonstrated, with entropy transfer by mass flow and oxidation entropy dominating the oxidation induction process. Several features of the DEG model parameters were discussed, including temperature dependence of entropies and degradation coefficients. The newly introduced DEG oxidation induction model predicted induction times similar to the existing first-order kinetics induction time model at the test pressure (3.5 MPa). The DEG model predicted oxidation induction at atmospheric pressure and other typical operating conditions, a capability not present in the first-order kinetics model.
References
- Ito, H., Tomaru, M., and Suzuki., T. (1988), "Physical and Chemical Aspects of Grease Deterioration in Sealed Ball Bearings," Lubr. Eng. 44, pp 872–879.
- ASTM (1998), "Standard Test Method for Oxidation Induction Time of Lubricating Oils by Pressure Differential Scanning Calorimetry (PDSC)," 1(65), pp 1–5. W. Conshohocken, PA.
- Shah, R., Jiang, J., and Kaperick, J. (n.d.), "Next-Generation NLGI Grease Specifications," NLGI Spokesm.
- Shetty, P., Meijer, R. J., and Lugt, P. M. (2021), "An Evaporation Model for Base Oil From Grease Lubricated Rolling Bearings Including Breathing," Tribol. Trans. pp 5–24.
- Osara, J. A., and Bryant, M. D. (2019), "Thermodynamics of Grease Degradation, Tribol. Int. 137, pp 433–445. doi:https://doi.org/10.1016/j.triboint.2019.05.020
- Reyes-Gavilan, J. L., and Odorisio, P. (2001), "A Review of the Mechanisms of Action of Antioxidants, Metal Deactivators, and Corrosion Inhibitors," NLGI Spokesm., 64, pp 22–33.
- Kondepudi, D., and Prigogine, I. (1998), Modern Thermodynamics, John Wiley & Sons: Hoboken, NJ.
- Rhee, I.-S. (n.d.), "Decomposition Kinetics of Greases by Thermal Analysis." Presented at 74th NLGI Annu. Meet., Scottsdale, AZ.
- Rohatgi, A. (2021), WebPlotDigitizer, https://automeris.io/WebPlotDigitizer.
- Bryant, M. D., Khonsari, M. M., and Ling, F. F. (2008), "On the Thermodynamics of Degradation LK," Proc. Math. Phys. Eng. Sci. TA TT, 464, pp 2001–2014, https://ut.on.worldcat.org/oclc/5554366074.
- Osara, J. A., and Bryant, M. D. (2021), "Performance and Degradation Characterization of Electrochemical Power Sources Using Thermodynamics, Electrochim. Acta, 365, pp 137337. doi:https://doi.org/10.1016/j.electacta.2020.137337
- Osara, J., and Bryant, M. (2019), "A Thermodynamic Model for Lithium-Ion Battery Degradation: Application of the Degradation-Entropy Generation Theorem," Inventions, 4, pp 23. doi:https://doi.org/10.3390/inventions4020023
- Osara, J. A. (2017), "Thermodynamics of Degradation," The University of Texas at Austin. https://doi.org/10.15781/T2Z892W3V.
- Osara, J. A., and Bryant, M. D. (2019), "Thermodynamics of Lead-Acid Battery Degradation: Application of the Degradation-Entropy Generation Methodology," J. Electrochem. Soc., 166. doi:https://doi.org/10.1149/2.0651916jes
- Osara, J. A., and Bryant, M. D. (2019), "Thermodynamics of Fatigue: Degradation-Entropy Generation Methodology for System and Process Characterization and Failure Analysis," Entropy, 21. doi:https://doi.org/10.3390/e21070685
- Osara, J. A., and Bryant, M. D. (2020), "A Temperature-Only System Degradation Analysis Based on Thermal Entropy and the Degradation-Entropy Generation Methodology," Int. J. Heat Mass Transf., 158. doi:https://doi.org/10.1016/j.ijheatmasstransfer.2020.120051
- Rezasoltani, A., and Khonsari, M. M. (2014), "On the Correlation Between Mechanical Degradation of Lubricating Grease and Entropy," Tribol. Lett. 56, pp 197–204. doi:https://doi.org/10.1007/s11249-014-0399-8
- Lijesh, K. P., and Khonsari, M. M. (2019), "On the Assessment of Mechanical Degradation of Grease Using Entropy Generation Rate," Tribol. Lett., 67, pp 1–13. https://doi.org/10.1007/s11249-019-1165-8.
- Callen, H. B. (1985), Thermodynamics and an Introduction to Thermostatistics, John Wiley & Sons: Hoboken, NJ.
- Moran, M. J., Shapiro, H. N., Boettner, D. D., and Bailey, M. B. (2014), Fundamentals of Engineering Thermodynamics, 8th ed., Wiley: Hoboken, NJ. https://doi.org/10.7227/ijmee.29.1.2.
- Rezasoltani, A., and Khonsari, M. M. (2019), "Experimental Investigation of the Chemical Degradation of Lubricating Grease From an Energy Point of View," Tribol. Int., 137, pp 289–302. doi:https://doi.org/10.1016/j.triboint.2019.05.006
Appendix A:
DEG model breakdown
With induction time as transformation measure, the DEG governing equation for each time step is
[37]
[37]
[38]
[38]
and
[39]
[39]
where
and
are durations of steps I, II and III. For the entire PDSC procedure, combine EquationEqs. [37]
[37]
[37] , Equation[38]
[38]
[38] , and Equation[39]
[39]
[39] to obtain the DEG governing equation for the ASTM 5483 PDSC, EquationEq. [21]
[21]
[21] , restated here:
[40]
[40]
Appendix B:
Tables of predicted values of oxidation induction time tind
Measured and predicted induction times as functions of temperature, plotted in and , are presented in . In these tables,
tind = measured via ASTM 5483;
tind,k = first-order kinetics prediction at ASTM 5483 conditions;
tind,DEG = DEG prediction at ASTM 5483 conditions,
tind,DEG,atm = DEG prediction at atmospheric pressure.
Table B1. Grease A induction times (measured and predicted).
Table B2. Grease B induction times (measured and predicted).
Table B3. Grease C induction times (measured and predicted).
Table B4. Grease D induction times (measured and predicted).