
Abstract
Soybean has developed a reputation as a superfood due to its nutrient profile, health benefits, and versatility. Since 1960, its demand has increased dramatically, going from a mere 17 MMT to almost 358 MMT in the production year 2021/22. These extremely high production rates have led to lower-than-expected product quality, adulteration, illegal trade, deforestation, and other concerns. This necessitates the development of an effective technology to confirm soybean’s provenance. This is the first review that investigates current analytical techniques coupled with multivariate analysis for origin traceability of soybeans. The fundamentals of several analytical techniques are presented, assessed, compared, and discussed in terms of their operating specifics, advantages, and shortcomings. Additionally, significance of multivariate analysis in analyzing complex data has also been discussed.
Introduction
Soy, popularly known as soyabean/soybean (Glycine max (L.) Merr.), is believed to have originated in east Asia and was domesticated in China around 1100 BC using its wild variety Glycine soja (Hirst Citation2019; Lee et al. Citation2011). Soybean is known as a “nutritional powerhouse” as it possesses a high protein content of 36% with all the nine essential amino acids (Michelfelder Citation2009), which accounts for approximately 60% of the world’s vegetable protein supply (Wijewardana, Reddy, and Bellaloui Citation2019). In addition, soybean comprises 35% carbohydrates, 19% lipids, and approximately 5% ash. Micro and macro-minerals (K, P, Mg, S, Cl, Na, Fe, Zn, Cu), vitamins (tocopherols, thiamin, riboflavin), phytins, and bioactive compounds (Isoflavones and anthocyanins) are among the other minor components (Liu Citation1997). Besides the nutritional value, soy has culinary qualities for humans and animals, health benefits, construction, and biofuel properties, and is inexpensive (Singh Citation2010). Soy is consumed in several forms, including soy sauce, tofu, edamame, soy milk, tempeh, miso, and edible oil. Approximately 77% of soy is processed into soybean meal as feed for animals farmed for human consumption (Charbeneau Citation2021; Ritchie and Roser Citation2021).
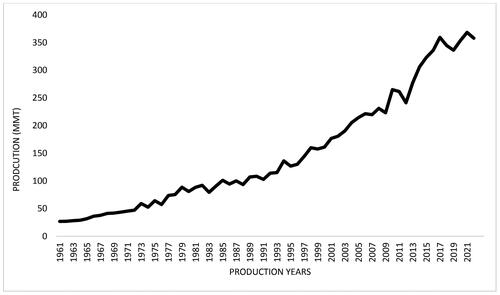
As the world’s population grows, so does the demand for soy protein-based foods. China has been the world’s top soybean importer since 2000, accounting for 65% of global soybean imports (Hasan, Suryani, and Hendrawan Citation2015; Chiang and Ikeda Citation2017). To meet these astronomically high demands, the global soybean production has increased dramatically over the years (), reaching to 358 million metric tons (MMT) in 2021/2022 as compared to mere 17 MMT in 1960 (Hartman, West, and Herman Citation2011), with Brazil being the largest producer (129.5Footnote1) and exporter (79), followed by the USA (121.5), Argentina (44), China (16.4) and India (12) (USDA Citation2023b). According to the USDA’s (United States department of Agriculture) most recent projections, Brazil’s soybean production will rise to 153 MMT, and global soybean production will reach approximately 391 MMT in 2022/2023 (USDA Citation2023c, Citation2023a). Due to these increased demands and production rate, the supply chains have been pushed, resulting in reduced product quality by utilizing questionable fillers and substitutes, food fraud and tax fraud by mislabelling, and deforestation to make more room for soy farming to meet the rising demands. Mato Grosso is Brazil’s largest soy producer and has some of the highest deforestation rates, accounting for 16% of Cerrado and 31% of Amazon deforestation over the past two decades (Vasconcelos et al. Citation2020). Countries including China, South Korea, and Japan are battling the problem of counterfeit soybean as the suppliers often mix authentic soybean with relatively inexpensive and low-quality foreign-acquired soybean (Lee et al. Citation2018; Oh et al. Citation2021; Otaka, Hokura, and Nakai Citation2014). Food falsification hurts the economy and threatens public health, as sometimes a non-compliant or unknown substitute additive can cause allergic reactions (Gerbig et al. Citation2017). Consumers, producers, and regulatory agencies have all emphasized the importance of food product authenticity since the 1980s (Rodríguez-Bermúdez et al. Citation2018). Food authentication is now more crucial than ever as consumers’ awareness of food safety grows, especially in the wake of the COVID-19 outbreak. Furthermore, lifestyle choices, religious beliefs, and health complications can restrict people from consuming certain foods, e.g., vegans avoid animal-based products; some communities don’t consume pork; people with specific allergies avoid certain foods such as gluten, nuts, dairy, and others. Conventional labeling is not entirely reliable and can be forged, thereby misleading consumers. This is another reason why consumers are compelled to know if the product’s content complies with the information provided on the packaging about the product composition, geographical origin, processing methods, and allergen alerts. Determination of geographical origin is an essential step in the food authentication process (Esteki et al. Citation2018). Deceptive labelling, health risks, tax fraud, and illegal deforestation are among the many reasons why establishing the geographical origin of soybeans is so important today.
Figure 1. Demonstrates the pattern of soybean production from 1960 to 2022 (Ritchie and Roser Citation2021; USDA Citation2023c).
All the components in soybean are substantially influenced by variety, cultivation practices (e.g., fertilizers), soil characteristics, and environmental factors (total rainfall and average annual temperature). This inherent benefit aids in distinguishing the geographical origin of the soybean, and a variety of analytical techniques can be employed to measure these variations in soybean (Dhungana et al. Citation2021; Ibáñez et al. Citation2020; Karr-Lilienthal et al. Citation2004; Lee and Choung Citation2011). The analytical techniques for verifying origin are transitioning from conventional geochemical methods to more rapid, sensitive, and inexpensive methods as new techniques demonstrate their reliability in determining the provenance of food products. Additionally, as chemometrics has developed, data extraction from these methodologies has improved in complexity, robustness, and accuracy. For example, spectroscopy techniques now provide complex chemical information and are no longer merely limited to providing structural information. Chemometrics methods enable spectral pre-processing, variable selection, pattern recognition, data dimension reduction, quantitative calibration, and multispectral data fusion (Wang et al. Citation2022). Several conventional and new advanced analytical techniques coupled with chemometrics have been reported for the origin determination of soybean, including the mass spectrometric techniques such as IRMS (Oh et al. Citation2021; Wu et al. Citation2015), ICP-MS (Sheng et al. Citation2020; Cui et al. Citation2021), HPLC-MS (Lee and Choung Citation2011; Wu et al. Citation2017), GC-TOF-MS and LC-orbitrap-MS (Lee et al. Citation2019); separation techniques such as HPLC (Azam et al. Citation2021; Desta et al. Citation2022), UPLC (Azam et al. Citation2021) and GC-FID (Desta et al. Citation2022; Lee and Choung Citation2011); spectroscopy techniques such as NMR (Zhou et al. Citation2021), NIR (Ahn and Kim Citation2012), FT-IR (Lee et al. Citation2018), terahertz spectroscopy (Wei, Zhu, et al. Citation2020) and, ED-XRF spectroscopy (Lai et al. Citation2020; Otaka, Hokura, and Nakai Citation2014). Furthermore, instrumental neutron activation analysis (NAA) has also been reported for the origin determination of soybean (Okada, Suzuki, and Hirai Citation1987).
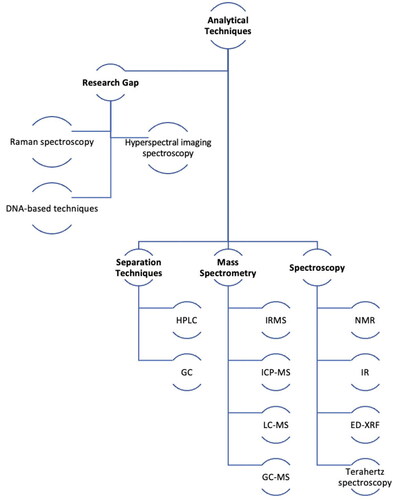
Other potential DNA-based and spectroscopy techniques such as Raman (Zhu et al. Citation2018) and hyperspectral imaging spectroscopy (Yin et al. Citation2017) can effectively determine the origin but haven’t been reported previously for soybean. To the best of our knowledge, no review article has summarized the various analytical techniques to determine the geographical origin of soybean. In this review, several analytical techniques () combined with chemometrics for determining the geographical origin of soybeans are presented, assessed, compared, and discussed in terms of their operating specifics, benefits, and drawbacks.
Figure 2. Outline of analytical techniques discussed in this review.
Chemometrics in food traceability and authentication
Chemometrics is a multidisciplinary approach that employs multivariate statistics to extract relevant information from intricate chemical systems. Over the years, chemometrics has developed to the point that it can now be utilized to extract minute differences in measurements between the target products. Both qualitative and quantitative analyses are now possible in food authentication thanks to the advancements in multivariate data analysis. Qualitative methods can further be categorized into unsupervised and supervised machine learning methods. Both methods are relevant for feature selection and classification (Berrueta, Alonso-Salces, and Héberger Citation2007; Berry, Mohamed, and Yap Citation2020). The primary distinction between unsupervised and supervised learning methods is that the former categorizes the data and presents a pattern without any prior information about the groups. In contrast, the supervised chemometrics method latter uses a training set of data based on prior information assignment of the entities to a known group to construct a prediction model (Esteki et al. Citation2018).
Principle component analysis (PCA) and cluster analysis (CA) are unsupervised pattern recognition methods most employed. Linear discriminant analyses (LDA) and partial least square discriminant analyses (PLS-DA) are the most commonly used supervised techniques (Berrueta, Alonso-Salces, and Héberger Citation2007). The supervised technique by itself can be biased as the samples are always classified into one of the given categories, even if they do not belong to any of them, which is why the most common approach in food science research is to initiate with an unsupervised learning method followed a supervised learning technique (Berrueta, Alonso-Salces, and Héberger Citation2007; Berry, Mohamed, and Yap Citation2020).
Quantitative models are based on linear and non-linear regression supervised models. Both methods help establish the relationship between the independent and dependent variables and fit the model depending on the type of equation. Multiple linear regression (MLR), principal component regression (PCR), partial least squares (PLS) regression, and orthogonal partial least square (OPLS) regression are examples of linear regression. In contrast, artificial neural networks (ANN), support vector machine (SVM), and wavelet neural networks (WNN) are most commonly used to explain the non-linear relationship between the variables (Esteki et al. Citation2018; Guillén-Casla et al. Citation2011).
Separation techniques
Chromatographic methods, one of the most used separation techniques, permit separation, identification, and purification of the components of a mixture for qualitative and quantitative analysis. The separation of molecules is based on their chemical affinities, liquid-solid partitioning, liquid-solid adsorption, and variations in molecular weights. Column chromatography, thin-layer chromatography, gas chromatography, ion exchange chromatography, gel permeation chromatography, and high-pressure liquid chromatography are among the most used chromatographic techniques. The fundamental building blocks of chromatography techniques are the stationary phase, mobile phase, separated molecules, and a detector (Coskun Citation2016). Numerous chromatography methods that have been employed to establish the geographical origin of soybean are summarized in below.
Table 1. The summary overview of all the chromatographic techniques used to determine soybean’s geographical origin.
Liquid Chromatography (LC)
LC efficiently separates and identifies all types of organic compounds irrespective of their polarity and volatility, including proteins, amino acids, carbohydrates, lipids, nucleic acids, phenolic compounds, and other biologically active molecules (Lehotay and Hajšlová Citation2002). The more advanced high-performance (HP) and ultra-performance (UP) LC have mostly supplanted LC. Apart from the fundamental building blocks, a typical HPLC instrument consists of a high-pressure pump to ensure better separation. Numerous detectors, such as an ultraviolet-visible (UV-Vis) light absorbance detector, refractive index detector (RID), fluorescence detector, and mass spectrometer, are widely employed with HPLC. The basic working principle of an LC system is that components in the sample mixture move through the mobile and stationary phases at different rates as a result of their different chemical affinities, and depending on the stationary phase in the column, they can be separated based on their charge, molecular mass, polarity, and other characteristics. Another enhanced variation of LC that emerged from HPLC is UPLC. It operates at an even higher pressure than HPLC and supports particles smaller than 2 µm for packing material, which enables better separation in less time (Gumustas et al. Citation2013).
Owing to these advancements, the use of HPLC in food analysis has increased exponentially since 1969 (Lehotay and Hajšlová Citation2002). In addition, both HPLC and UPLC have been widely used in the field of food traceability (Di Cagno et al. Citation2003; Guo et al. Citation2013, Citation2017; Liu, Chen, et al. Citation2018; Rodrıguez-Delgado et al. Citation2002; Stefanoudaki, Kotsifaki, and Koutsaftakis Citation1997; Tomás-Barberán et al. Citation1993). Similarly, several studies have been conducted in the past decade that utilized HPLC and UPLC to examine several nutritional characteristics (e.g., isoflavones, soluble sugar) in multiple soybean cultivars from various regions to determine their association with the geographical origin (Azam et al. Citation2021; Zhang and Li Citation2009; Desta et al. Citation2022; Kim et al. Citation2012; Lee and Choung Citation2011).
Azam et al. (Citation2021) combined UPLC-Refractive Index Detector (UPLC-RID) and HPLC-UV with chemometrics to analyze soluble sugar and isoflavones in soybean. The results demonstrated that USA soybean cultivars had significantly higher total soluble sugar and total isoflavone contents than Chinese samples. Similar patterns in the total isoflavones levels and soluble sugar were reported in previous studies (Desta et al. Citation2022; Lee and Choung Citation2011). Desta et al. (Citation2022) utilized HPLC-UV to distinguish the soybean cultivars from the USA, China, South Korea, and Japan based on their total isoflavone contents (except gycitin). They demonstrated that South Korean samples had significantly higher total isoflavone content than other countries. This is in line with a previous study done by Kim et al. (Citation2012), where they utilized an HPLC-photodiode array detector (HPLC/PDA) to analyze isoflavones and phenolic compounds in soybean germplasms from the USA, South Korea, and China. They were able to distinguish the samples from different origins based on these metabolites. In contrast to these investigations, other studies that used similar techniques found no significant variations in the isoflavones levels in soybean cultivars from India and Bulgaria (Sakthivelu et al. Citation2008), the USA, Serbia, Russia and China (Tepavčević et al. Citation2010). However, they could establish the differences in the multiple cultivars based on isoflavones.
The cost of an HPLC apparatus is reasonable, and the analysis is simple, robust, and reproducible. HPLC can detect materials from picograms to milligrams (McMaster Citation2007). Depending on the compounds to be analyzed, the specific detectors can be selected, and the instrument elements (e.g., stationary, mobile phase) can be easily customized (Luykx and van Ruth Citation2008). Additionally, the enhanced permeability and efficiency of the new and improved HPLC columns (e.g., silica-based monolithic) reduce the overall analytical time (Cabrera Citation2004). Despite the benefits, HPLC still has several disadvantages, such as the need for additional extraction and purification steps. In addition, it doesn’t have a universal detector (Wadood et al. Citation2020).
Gas chromatography (GC)
GC has been used to help determine food composition and is a great tool for food traceability and authentication. Unlike HPLC, GC can only be used for non-polar, semi-polar, volatiles, and semi-volatiles (e.g., sterols, oils, low-chain fatty acids, aroma components, and pesticides) without chemical derivatization. However, most researchers prefer to use GC to measure these compounds because of the higher separation efficiency (Lehotay and Hajšlová Citation2002; McMaster Citation2007). The basic operation of GC starts with injecting the sample mixture into the GC, where it is vaporized in a heated inlet. An inert gas then carries this gaseous mixture through the GC column’s stationary phase, where its components separate as they interact with the stationary phase. The abundance of components can then be measured by a range of detectors, including flame ionization (FID), atomic emission, thermal conductivity, photo-ionization detectors, and mass spectrometers (Luykx and van Ruth Citation2008).
Several studies have combined GC with chemometrics for the geographical origin traceability of a variety of food products including wine (Etièvant et al. Citation1989), milk (Collomb et al. Citation2002), edible oils (Ollivier et al. Citation2003), cocoa (Oliveira et al. Citation2016), and cereals (Tres, Heenan, and van Ruth Citation2014). Similarly, GC-FID with multivariate analysis has been widely applied to establish the geographical origin of soybean cultivars based on their fatty acid profiles (Azam et al. Citation2021; Desta et al. Citation2022; Sheng et al. Citation2020; Lee and Choung Citation2011; Xi-Chun Citation2018). Most of these studies analyzed five essential fatty acids, including palmitic acid (PA), stearic acid (SA), oleic acid (OA), linoleic acid (LA), and linolenic acid (LLA). Azam et al. (Citation2021) found that four of the five measured fatty acids (PA, SA, OA, LA) positively correlated with geographical origin. In addition, Chinese cultivars showed higher total average contents of PA, SA, and OA, whereas the USA samples were rich in LA and LLA contents. Similar patterns (except SA) were observed by Desta et al. (Citation2022). Desta et al. (Citation2022) were also able to differentiate the soybean germplasms from the USA, China, and South Korea based on individual fatty acid contents. Interestingly, Lee and Choung (Citation2011) showed contradicting patterns in the five fatty acids of soybean seeds from China and the USA. They concluded that the total average contents of SA and LLA correlated with the geographical origin. Xi-Chun (Citation2018) also employed fatty acid fingerprint technology to detect and measure five fatty acids (PA, SA, heptadecanoic acid, cis-13-octadecenoic acid, arachidic acid) that could be used as traceability indicators for the four regions in Heilongjiang province (Beian, Harbin, Jian Sanjiang and Qiqihar). With respect to identification and prediction, they attained high rates of about 98% and 93%, respectively.
Based on the profiles of twelve trace elements and two fatty acids (OA and SA), Sheng et al. (Citation2020) built an OPLS-DA model and differentiated the soybean samples from four producing areas in northern China. It must be noted that these studies analyzed different genotypes from multiple cultivation years, which could have resulted in the variations observed in the fatty acids. In addition, average annual temperature plays a significant role in the abundance of saturated and unsaturated fatty acids in different parts of plants (Sheng et al. Citation2020). Soybean germplasms from the USA, China, and South Korea have also been discriminated based on tocopherol concentrations using GC-FID (Kim et al. Citation2012).
Qualities like versatility, reproducibility, and, most importantly, higher sensitivity have made GC one of the most widely used analytical separation techniques. While GC equipment is now reasonably priced, its operational expenses continue to be a drawback. In addition, it requires a specialist to perform and interpret the data (Wadood et al. Citation2020). Furthermore, other than by pyrolysis, the nonvolatile substances, such as inorganic salts, proteins, polysaccharides, nucleic acids, and other large molecular weight organics, are no amenable to GC (Lehotay and Hajšlová Citation2002).
Mass spectrometric techniques
Mass spectrometry (MS) is a valuable analytical tool for identifying and quantifying the constituents in inorganic and organic compounds. MS’s fundamental premise is to generate ions from the sample, separate the ions based on their mass and measure their mass-to-charge ratio (m/z) to determine a sample’s composition. MS is often coupled with other techniques, such as geochemical and chromatographic techniques (Luykx and van Ruth Citation2008). summarizes the mass spectrometry techniques that have been employed to determine the geographical origin of soybean.
Table 2. The summary overview of all the mass spectrometry techniques used to determine soybean’s geographical origin.
Isotope ratio mass spectrometry (IRMS)
IRMS is a conventional and well-established geochemical method that uses the isotope content of compounds to identify their geographical, chemical, and biological origin. It is widely used in forensic science, biology, geology, medicine, and archaeology. In a typical EA-IRMS (elemental analyzer), samples are combusted at 1020 °C in the presence of oxygen to transform them into gaseous form. The resulting gases are then reduced and separated before being introduced into the ion source of the MS, where beams of ions are separated according to their m/z and finally detected (Rodrigues et al. Citation2013). IRMS precisely measures the variations in the abundance of isotopic ratios of elements such as 13C/12C, 15N/14N, 18O/16O, 2H/1H, and 34S/32S. The isotope ratios are assessed relative to an isotopic standard to eliminate bias or systematic error in the measurements. Some internationally recognized standards include Vienna Pee Dee Belemnite (VPDB) for carbon, Vienna Canyon Diablo Troilite meteorite (V-CDT) for sulfur, Vienna Standard Mean Ocean Water (VSMOW) for oxygen and hydrogen, and laboratory air for nitrogen. Various natural abundant standards are provided by the International Atomic Energy Agency (IAEA; Vienna, Austria) and the National Institute of Standards and Technology (NIST; Washington, DC, USA). Isotope ratios are measured relative to the universal standards and are reported in the delta notation (δ), δ = (RSample/RStandard − 1), where RSample is the abundance ratio of heavier and lighter isotopes (e.g., 2H/1H) and standards chosen to establish the RStandard values represent a stable and homogenous material (Muccio and Jackson Citation2009). δ -values are small and so are multiplied by 1000 and reported as per mille (‰).
Fertilizers, climatic variations, farming methods, and geological elements (such as soil characteristics and altitude) all affect a plant’s isotopic composition (proteins, carbohydrates, fats, minerals) and can serve as indicators of geographical origin (Li et al. Citation2016; Luykx and van Ruth Citation2008). Some of these factors affect specific stable isotopes, e.g., compared to plants produced using chemical fertilizers, plant materials fertilized with organic fertilizer or animal manure had greater δ15N values as these fertilizers are enriched in 15N (Watzka, Buchgraber, and Wanek Citation2006); δ18O values depends broadly on latitude the altitude of the production site (Luykx and van Ruth Citation2008).
A variety of plant and animal products have been authenticated and tracked using IRMS, including some essential commodities such as oils (Portarena et al. Citation2014), rice (Chung et al. Citation2021; Liu et al. Citation2022), coffee (Brodie, Kracht, and Hilkert Citation2019; Rodrigues et al. Citation2009), fruit juices (Perez, Smith, and Anderson Citation2006), meat (Piasentier et al. Citation2003; Schmidt et al. Citation2005), dairy products (Ehtesham et al. Citation2013; Kalpage et al. Citation2022), honey (McComb and Frew Citation2013; Zhou et al. Citation2018), wines (Ogrinc et al. Citation2001), and the world’s most expensive spice; saffron (Wakefield et al. Citation2019). To the best of our knowledge, merely two studies have been published on stable isotope analysis of soybeans to determine their geographical origin. Oh et al. (Citation2021) measured δ13C, δ15N, and δ18O values for origin authentication of red pepper powders, chickpea, and soybean originating from South Korea, China, Vietnam, and Egypt. Soybeans were purchased commercially from South Korea and China without any information about the growing environment of the samples. Wu et al. (Citation2015) conducted a similar study to measure δ13C and δ15N values of five kinds of cereal grains, including rice, soybean (imported from three Chinese regions: Jiangsu, Shandong, and Heilongjiang), millet, wheat, and corn, from different origins to investigate their geographical origin traceability. Both of these studies used analysis of variance (ANOVA) followed by Duncan’s least significant test to determine the significance (p < 0.05) of the results.
The results from both studies demonstrated that soybean from China had similar average δ15N values of 1.40 ± 0.32 ‰ (Wu et al. Citation2015) and 1.39 ± 0.82 ‰ (Oh et al. Citation2021). In addition, the δ15N values weren’t significantly different between the regions (p > 0.05). They concluded that δ15N could not be used for origin provenance because δ15N values are highly influenced by the soil nutrition and type of fertilizers and are not merely depend on the origin (Li et al. Citation2016; Wu et al. Citation2015). The low nitrogen isotopic composition of soybean indicates that the soybeans were grown using chemical fertilizers. However, it couldn’t be verified as the soil and fertilizer information was not accessible. Furthermore, due to the similar latitudes of South Korea and China, Oh et al. (Citation2021) discovered no discernible variation between the δ18O values of soybean from these two countries.
Wu et at. (2015) showed a significant difference (p < 0.05) in the δ13C values of the soybean obtained from three different Chinese provinces. In contrast, Oh et al. (Citation2021) found no statistically significant difference between the δ13C values of South Korean and Chinese soybean samples. In addition, the average δ13C values of Chinese samples from both studies were also different. It is difficult to pinpoint the precise cause of this discrepancy because the sample metadata was inaccessible. However, the variation in the 13C/12C could be explained based on a plants’ photosynthesis that affect the carbon fixation process. Wind stress and water usage efficiency can impact CO2 diffusion in the leaves, potentially resulting in isotope fractionation in the crop and varying δ13C values (Farquhar et al. Citation1989; Kaler et al. Citation2018).
IRMS leverages certain environmental parameters (such as climate and altitude) to establish a fingerprint specific to a given product. However, similar climate conditions can occur in different locations making it difficult to distinguish based on their isotopic compositions. Other drawbacks of employing stable isotope analysis include the high cost of the equipment, its maintenance and sample preparation, and the time-consuming aspect of sample preparation and processing (Luykx and van Ruth Citation2008).
Inductively couples’ plasma mass spectrometry (ICP-MS)
ICP-MS is believed to be the fastest-growing analytical trace element technique due to its unique capabilities, such as the range of detection limit (from ultra-trace; ppq to higher quantities; ppm), rapid multi-element analysis, isotopic ability, and sensitivity. ICP-MS works on a principle that the samples (solid or liquid) are first converted to fine aerosols using a nebulizer, followed by ionization in a high-temperature argon plasma torch. The targeted ions are separated by a mass spectrometer (m/z) and finally sent to the detector. Numerous sectors, including environmental, biomedical, geological, semiconductor, and nuclear applications, have demonstrated the technique’s utility (Thomas Citation2008). ICP-MS, coupled with chemometrics, has also been extensively utilized in food authentication and traceability since it can analyze several inorganic elements simultaneously to produce a chemical fingerprint. This approach is predicated on the notion that an agricultural product’s chemical composition is influenced by the soil’s structural makeup, which is crucial to distinguish the geographical origin as no two soils would have the same structure (Nguyen-Quang, Bui-Quang, and Truong-Ngoc Citation2021).
ICP-MS has been successfully applied to screen the geographical origin of numerous food products, including vegetables (Ariyama et al. Citation2007; Laursen et al. Citation2011), rice (Kelly et al. Citation2002), wines (Gao et al. Citation2022; Geana et al. Citation2013), honey (Chen et al. Citation2014; Wu et al. Citation2021), coffee (Santato et al. Citation2012; Valentin and Watling Citation2013), tea (Liu, Zeng, et al. Citation2020), nuts (von Wuthenau et al. Citation2022), and cacao and cocoa beans (Bertoldi et al. Citation2016). The concentration of mineral elements in the soil, which is ultimately transferred to the crop, is influenced by the soil type and the capacity of certain elements to solubilize in the soil. For example, the chernozem soil is rich in Mg, Ca, and K, whereas black soil is rich in elements such as Fe, Zn, Mn, Cu, and Mo (Sheng et al. Citation2020). Alkali metals like rubidium and cesium are labile in soil, so they are readily transported to the plant. Such factors serve as excellent indicators of geographical origin (Kelly et al. Citation2002). Cui et al. (Citation2021) demonstrated a significant correlation between the element composition of soybeans and that of the corresponding soil. Furthermore, factors like temperature and precipitation impact the soil’s organic matter and humus, impacting the crop’s elemental composition (Chung et al. Citation2021; Sheng et al. Citation2020). The concentrations of the soil’s mineral elements could also be affected by several other factors, such as environmental pollution, agricultural practices (e.g., fertilizers, irrigation), crop variety, and climate change. Still, these variations would be less pronounced than those seen between production sites if suitable elements were selected (Luykx and van Ruth Citation2008). Recent advancements have been made in the authentication of soybeans’ origin using ICP-MS. We have identified various studies conducted over the last two years using ICP-MS and multivariate analysis to establish the geographical specificity of soybeans (Sheng et al. Citation2020; Hidalgo et al. Citation2020; Nguyen-Quang, Bui-Quang, and Truong-Ngoc Citation2021).
Nguyen-Quang, Bui-Quang, and Truong-Ngoc (Citation2021) used ICP-MS with PCA and hierarchical clustering analysis (HCA) to identify 33 out of 40 examined elements in soybean from Vietnam, Canada, the USA, and Brazil as essential markers for soybean origin detection. The HCA successfully differentiated the samples from four regions with a slight overlap between the Canadian and the USA samples. PCA modeling clearly clustered samples from four countries and was also able to determine discriminant elements as some of the elements were dramatically higher in specific locations, e.g., Ti, Mn, Zn, Mo, Dy, and Tl concentrations were significantly higher in Brazilian samples as compared to the other regions. Similarly, contents of Se, Sr, Nb, and Ba were highest in Vietnamese samples, Canadian samples typically possessed the highest levels of Lu, and the USA samples stood out due to their highest concentrations of Ti and Hf.
Sheng et al. (Citation2020) combined gas chromatography and ICP-MS to measure five fatty acids and 17 trace elements in soybean from four production sites in northern China (Heilongjiang, Inner Mongolia Autonomous, Liaoning, and Jilin). HCA revealed the key elements unique to each production region. Mg, Ca and Pd contents were found to be highest in soybeans from Heilongjiang, whereas the soybean from Liaoning possessed the highest concentration of Zn, Mn, Se, and C18:1. Similarly, the concentrations of Mo and Cr were measured in the soybean from Inner Mongolia Autonomous region and Jilin regions respectively. Employing 14 classification indexes (Mn, Se, Ni, Sr, Cd, Pd, Mg, Fe, Ca, Zn, Co, Rb, C18:1, and C18:0), the PLS-DA model was able to predict 89.9% of the sample’s origin accurately. This study used yearly temperature, precipitation, and soil organic matter to explain the fluctuation of various elements in various producing regions. The results, however, may have been skewed due to not considering the impact of different soybean varieties in different geographical areas.
Another study by the same author, Cui et al. (Citation2021), examined the elemental composition of soybean and soil samples from four production regions within the Heilongjiang province (Daqing, Suihua, Heihe, and Jiamusi) of China. They established a geographical traceability system using the difference in the element content between each production area, correlation analysis of all variables in soybean and soil, cluster heat map, and the orthogonal partial least squares discriminant analyses (OPLS-DA). The cluster heat map utilizing 17 (Mg, Al, K, Mn, Mo, O, Cu, Cr, Rb, Ni, Ca, Fe, Se, Pd, Zn, Ga, and Pd) of the 25 analyzed trace elements contained sufficient discriminating ability, and OPLS-DA model showed a high prediction percentage of 93.33. Furthermore, they demonstrated that, as a result of bidirectional absorption aid and unidirectional absorption inhibition, respectively, there is a positive and negative correlation between the elemental composition of the soybean and the soil. They also successfully reduced the sampling area from approximately 1.97 million Km2 (Sheng et al. Citation2020) to 143,985 Km2, i.e. approximately 13 times, and presented a more effective and sensitive model to discriminate the samples from the production area within a single province.
Hidalgo et al. (Citation2020) collected soybeans from Argentina’s three provinces (Córdoba, San Luis, and Chaco) and measured a panel of 20 trace elements using ICP-MS. They compared many supervised and unsupervised classification and discriminant techniques such as PCA, support vector machine (SVM) discriminant model (SVM-DA), soft independent modeling of class analogy (SIMCA), k-nearest number (k-NN), random forest (RF), potential functions (PF), one-class support vector machine (OC-SVM). The results demonstrated significant variations in Cr, Li, Mn, and Zn concentrations (p < 0.01) between the three provinces. PCA discriminated the samples from Chaco and showed a slight overlap between the other two origins. The supervised technique, SVM-DA, could even differentiate these two neighboring regions (San Luis and Córdoba) with an accuracy of 91.7%. They concluded that SVM-DA and SIMCA outperformed all the other tested models in terms of prediction ability in cross-validation with average values of 99.3% for SVM-DA and a median value of balanced accuracy of 96% for Chaco, 92% for Córdoba, 88% for San Luis using SIMCA.
Homura et al. (Citation2006) used LDA to distinguish between Japanese and Chinese soybean samples based on six chosen elements; Baoxin and Dongjie (Citation2017) examined 52 mineral elements in whole soybean samples, produced a PCA-DA model based on four elements, and successfully discriminated the samples from Qiqihar and Beian regions of China’s Heilongjiang province; Hua Jao et al. (Citation2017) were able to determine the correct production region of the vegetable soybean samples (both kernel and pods) collected from Taiwan, China and Japan based on eight trace elements.
ICP-atomic emission spectroscopy (ICP-AES), Atomic absorption, x-ray fluorescence spectroscopy (discussed in the later section), and neutron activation analysis (NAA) are additional methods for trace elemental analysis. ICP-AES was used by Wan et al. (Citation2010) to distinguish soybean from the Chinese provinces of Jiangxi, Heilongjiang, Jilin, and Anhui. They concluded that the production region significantly impacts the concentrations of Al, Ca, Fe, Na, Ma, and Zn in soybeans (p < 0.05). Okada, Suzuki, and Hirai (Citation1987) nuclear study using instrumental NAA demonstrated that the concentration of selenium in soybean from China, the USA, and Japan differ significantly and can be used as an indicator of geographical origin. These techniques haven’t been used widely due to their drawbacks, such as high detection limit, large sample size, high cost of equipment, inaccessibility of a nuclear reactor, and radioactive hazards (Kučera, Pp, and In Citation2009; Misof, Roschger, and Fratzl Citation2011; Wilschefski and Baxter Citation2019). ICP-MS has largely overcome these limitations; however, it still has shortcomings, much like IRMS. The main drawback is the expensive equipment, operating, and sample preparation costs. Additionally, it is susceptible to both spectroscopic and non-spectroscopic interference. Thus, great caution must be used to obtain good data (Wilschefski and Baxter Citation2019).
Liquid Chromatography Mass spectrometry (LC-MS)
LC coupled with an MS provides high sensitivity, selectivity, and resolution to measure both non-targeted/targeted metabolites in a wide range of compounds (Dong and Llanas Citation2013; Luykx and van Ruth Citation2008). HPLC-MS has been used widely in the field of metabolomics for drug bioanalysis and to discover and develop new medicines (Wilson et al. Citation2005).
The quality characteristics of soybeans are primarily affected by genotype, origin, maturity groups, climatic conditions (temperature, precipitation, rainfall), soil properties, and water (Azam et al. Citation2021; Desta et al. Citation2022; Lee et al. Citation2019; Zhang et al. Citation2014) and these could act as unique and identifiable markers for the origin. Based on the examination of nonvolatile metabolite concentrations including proteins, nucleotides and secondary metabolites such as isoflavones, and anthocyanin, HPLC-MS has demonstrated its dependability in the field of traceability, e.g., for origin authentication of coffee (Choi et al. Citation2010), tea (Fraser et al. Citation2013), rice, oils (Nescatelli et al. Citation2014), wine (Sagratini et al. Citation2012), and juices (Jandrić et al. Citation2017).
Similarly, multiple studies have combined LC with MS to examine the secondary metabolites (e.g., isoflavones, anthocyanins), in multiple soybean cultivars from various regions to determine their association with the geographical origin (Lee et al. Citation2019; Lee and Choung Citation2011; Wu et al. Citation2017). Lee and Choung (Citation2011) used HPLC with diode array detection and electrospray ionization/mass spectrometry (HPLC-DAD-ESI/MS) to screen and differentiate soybean varieties from the USA, China, South Korea, Japan, Taiwan, and Nepal. They found no significant correlation between the isoflavone content and the country of origin. However, they discovered a positive correlation between the isoflavone concentration and soybean varieties from each country. Other studies also demonstrated a correlation between the isoflavones and geographical origin (Lee et al. Citation2019; Wu et al. Citation2017). Lee et al. (Citation2019) coupled UPLC-orbitrap-MS with chemometrics to examine the high geographical specificity of metabolomic traits among the Korean samples collected from 7 provinces (Paju, Inje, Boeun, Gunsan, Gangjin, Daegu, and Hamyang). PCA analysis on flavonoids and isoflavonoid contents was able to distinguish between the Gunsan, Inje, and Daegu regions, and HCA was able to establish a correlation between the regions (Paju and Boeun; Hamyang and Gangjin; Inje and Daegu) considering the geographical characteristics (rainfall, average temperature, and soil texture) and soybean varieties. Tryptophan, malonylgenistin and malonyldaidzin, N-acetylornithine, and allysine were the five discriminating metabolites prioritized using the OPLS-DA model, which had a fitness and predictability of 95% and 78%, respectively.
Wu et al. (Citation2017) differentiated the black soybean seeds collected from four different Chinese regions: Sichuan, Yunnan, Guizhou, and Chongqing, based on isoflavone and anthocyanin content. They utilized HPLC-MS and profiled twelve isoflavones and eight anthocyanins. Using the combined data from the geographical analysis and OPLS-DA model, they concluded that longitude and latitude significantly influence the accumulation of these secondary metabolites. Samples grown at higher latitudes showed a higher accumulation of isoflavones and anthocyanins (e.g., Sichuan and Chongqing). Similar observations were made by Zhang and Li (Citation2009). Wu et al. (Citation2017) also observed a biosynthesis tradeoff between the isoflavones and anthocyanins, which may be affected by the longitude. Samples from Guizhou and Chongqing, grown in a high-longitudinal environment, were found to have higher levels of isoflavones. In contrast, higher anthocyanins content was observed in the sample grown in the low-longitudinal areas of Sichuan.
LC-MS has been used in all of these investigations because it is versatile, accurate, and highly reproducible for profiling and quantitative analysis; nevertheless, there are some drawbacks, such as extensive extraction procedures, complex data analysis, compound identification challenge costly equipment and maintenance expenses, and lower separation efficiency than gas chromatography (Kamal and Karoui Citation2015; Timchenko Citation2021).
Gas Chromatography Mass Spectrometry (GC-MS)
Like LC-MS, GC combined with an MS provides comprehensive information about the identity of components in a sample mixture. GC-MS best quantifies the metabolites that are volatile and thermally stable (Luykx and van Ruth Citation2008). Due to its specificity, GC-MS has established its importance in metabolomics-based research (Beale et al. Citation2018). The cultivation and post-harvest conditions, including temperature, precipitation, light, water, and soil characteristics, fertilizer treatments have a significant impact on the volatile organic compounds of soybeans; therefore, they can be used to distinguish the soybean from different growing regions (Kim et al. Citation2020; Maestri et al. Citation1998). Thus, GC-MS has been widely applied in the field of authentication and traceability of oils (Gonzalez-Fernandez et al. Citation2019), fruits (Giannetti et al. Citation2017), tea (Lin et al. Citation2013), Saffron (Liu, Chen, et al. Citation2018), dairy products (Gaspardo et al. Citation2010; Palladino et al. Citation2010), and other animal and agricultural products (Kamal and Karoui Citation2015).
Numerous studies have effectively identified the region of soybean production by analyzing and profiling volatile compounds such as aldehydes, terpenes, ketones, alcohols, phenolic compounds, and fatty acids (Alghamdi et al. Citation2018; Kim et al. Citation2020; Lee et al. Citation2019). By combining GC-MS and multivariate analysis (PLS-DA), Kim et al. (Citation2020) were able to identify 52 discriminating volatile compounds in soybean from South Korea (15), China (25), and North America (12) and could establish the association of soybean to their origin. Similarly, Alghamdi et al. (Citation2018) identified 88 volatile compounds categorized into 13 classes, including aldehydes, ketones, alcohols, carboxylic acids, esters, alkanes, heterocyclic compounds, phenolic compounds, sugar moiety, ether, amide, alkene and fatty acid ester in soybean genotypes from nine countries (the USA, Egypt, Syria, China, India, Pakistan, Indonesia, Argentina and Australia). They found that Indonesian and Australian samples had the highest amounts of phenolic and ester compounds, respectively. In a subsequent study, Lee et al. (Citation2019) used an OPLS-DA model to identify five distinguishing metabolites in seven Korean provinces.
GC-MS is considered a versatile analytical technique due to its ability to separate the components with high selectivity, sensitivity, and reproducibility. The well-established libraries, which facilitate compound identification, are the most compelling advantage of GC-MS. Among its other advantages, it is easy to use in terms of analysis time and running costs. In addition, GC-MS minimizes the problems common to LC-MS, such as matrix effects, and achieves greater chromatographic resolution (Beale et al. Citation2018). However, similar to LC-MS, the instrumentation is expensive, and analysis is time-consuming. The sample preparation for GC-MS is extremely particular because the MS detector is designed to analyze clean materials (Luykx and van Ruth Citation2008). Furthermore, GC-MS can only be used to separate and identify low molecular weight (ca. 50–600 Da) and volatile compounds (Beale et al. Citation2018). Moreover, chemical derivatization is needed to measure polar and nonvolatile compounds using GC (Raynie Citation2018).
Spectroscopy techniques
Spectroscopy techniques are based on the premise that molecules and atoms can interact with electromagnetic radiation. By using the wavelength or frequency detected in the emitted or absorbed energy spectrum, they reveal intricate structural and physicochemical details of the compounds in the sample (Ibañez and Cifuentes Citation2001). The available spectroscopy techniques include nuclear magnetic resonance (NMR), energy dispersive X-Ray fluorescence spectroscopy (ED-XRF), and a wide array of vibrational spectroscopy techniques, such as near-infrared (NIR), mid-infrared, terahertz spectroscopy and others. The primary benefits are that spectroscopic techniques are nondestructive, noninvasive, affordable, rapid, and can be used for qualitative and quantitative analysis. Combined with chemometrics, these techniques have proven effective for assessing authenticity and detecting adulteration (Wadood et al. Citation2020). summarizes the spectroscopy techniques that have been employed to determine the geographical origin of soybean.
Table 3. The summary overview of the spectroscopy techniques to determine the geographical origin of soybean.
Nuclear magnetic resonance (NMR)
NMR is one of the most used techniques in metabolomic fingerprinting research because of its numerous advantages. NMR is noninvasive, environmentally friendly, and requires relatively simple sample preparation. It is based on the measurement of radiofrequency radiation absorbed by the nuclei of the atoms present in a strong magnetic field. The absorption by atomic nuclei is influenced by the atoms in their immediate environment, and this effect is utilized to acquire structural data about the compound under study. The most employed isotopes in NMR are 1H and 13C, with 15N, 17O, 19F, and 31P, among others (Wadood et al. Citation2020). Depending on the magnetic field strengths, low and high field NMR-based metabolomics are widely used for food authentication and traceability. Factors such as pedoclimatic conditions of production areas, sample variety, year of production, and seasonality affect the agro-products’ nutritional characteristics, which can also be measured and quantified using NMR (Bellaloui et al. Citation2009; Masetti, Sorbo, and Nisini Citation2021). The geographical origin of various plant and animal products has been identified by profiling metabolites using NMR (Aursand et al. Citation2009; Brescia et al. Citation2003; Consonni, Cagliani, and Cogliati Citation2012; Huo et al. Citation2017; Mannina et al. Citation2001). Similarly, three studies applied coupled NMR and chemometric techniques to differentiate soybean from South Korea and China (Kim, Rho, and Lee Citation2009; Rho et al. Citation2003; Zhou et al. Citation2021).
Zhou et al. (Citation2021) analyzed twenty-five metabolites, including ten amino acids, three carbohydrates, nine organic acids, one fatty acid, and others, and developed an OPLS-DA model with a sensitivity, specificity, and accuracy of 96.9%, 94.4%, and 95.6% respectively and discriminated the soybean samples from South Korea and China. They also distinguished soybean from the regions within China (north-eastern, middle, and southern regions) using a PLS-DA model that showed more than 95% accuracy. However, the samples within Korean provinces could not be differentiated, possibly because the region of origin had similar climatic, soil, and rainfall conditions. In addition, no information regarding the soybean cultivars was available to the author and wasn’t considered in this study. Using low-field NMR (10 MHz) and performing the canonical discriminant analysis (96% accuracy), Kim, Rho, and Lee (Citation2009) found that Korean soybean had higher relaxation times and crude protein content (p < 0.05) as compared to the Chinese soybean. In a similar study, soybean samples were discriminated based on relaxation times measured using general components and 20 MHz pulsed NMR. In particular, yellow beans showed a significant difference in the crude fat contents whereas black beans showed a considerable variation in the moisture and protein contents between the countries (Rho et al. Citation2003).
The most appealing feature of NMR spectroscopy is the ability to analyze and quantify several chemical compounds in a single run using the same sample. However, it is still expensive compared to other spectroscopy techniques and requires an expert operator (Wadood et al. Citation2020). NMR’s main limitation compared to MS is its low sensitivity. MS has detection limits in the nanomolar range. MS is also applicable for targeted and untargeted analyses, whereas NMR is often employed for nonselective assays (Emwas Citation2015).
Infrared spectroscopy (IR)
When exposed to a specific wavelength of light that creates a vibration in the bonds, each functional group or structural feature of a sample absorbs infrared at different intensities that can be detected by IR spectroscopy. Since the vibration frequencies of the various bonds in the functional groups differ, if we consider them all, they provide a fingerprint of the sample that can reveal the potential compositional and/or structural identity of the sample (Luykx and van Ruth Citation2008). Two principal zones of the IR spectrum are widely used for analytical purposes, the mid-infrared (mid-IR) region from 4000 to 400 cm−1 and the near-infrared (NIR) from 14,000 to 4000 cm−1 (Ibañez and Cifuentes Citation2001). Absorption in the NIR region mainly appears as combination and overtone bands of molecular vibrations of -CH, -OH, and -NH functional groups typical of oil, carbohydrates, and protein components. Fourier transform infrared (FT-IR) spectroscopy, on the other hand, relies on the mid-infrared region of the electromagnetic spectrum. It provides the fundamental vibrational information and associated rotational-vibrational structure of the sample instead of overtones and combination modes. The mid-infrared region can be split into two broad regions: functional (4000–1500 cm−1) and fingerprint (1500–400 cm−1) regions. The former provides extensive information about the sample, including the major functional groups present in the sample. The latter contains various overlapped bands generated by different compounds in this region making it harder to identify individual functional groups without any uncertainty. However, this region can still be used as a fingerprint of a food product (Karoui, Downey, and Blecker Citation2010; Wadood et al. Citation2020).
Multivariate statistical analysis must be utilized to interpret the spectroscopy data since the NIR and FT-IR spectra of soybeans from different origins are superficially similar but contain a substantial amount of hidden and complex information about the sample. Furthermore, multivariate analysis is necessary for data pre-processing for any sample background, noise, light scattering, device response, and so forth (Rinnan, Berg, and Engelsen Citation2009; Wei, Zhu, et al. Citation2020). Both FT-IR and NIR combined with chemometrics have been employed to determine the geographical origin of various commodities, including rice (Kim et al. Citation2003), olive oils (Tapp, Defernez, and Kemsley Citation2003), dairy products (Bassbasi et al. Citation2014; Karoui et al. Citation2004), coffee (Medina et al. Citation2017), wines (Hu et al. Citation2019), tea (Esteki, Memarbashi, and Simal-Gandara Citation2022), alcoholic beverages (Uríčková and Sádecká Citation2015), saffron (Liu, Chen, et al. Citation2018), and honey (Ruoff et al. Citation2006).
By integrating NIR spectroscopy and chemometrics, Kim et al. (Citation2022) distinguished Korean soybeans from imported soybeans with a correct classification rate of 100%. They also experimented with various spectral pre-processing approaches to create a model using DA and modified partial least squares OPLS(MPLS) regression techniques and discovered that the classification rate could range from 90% to 100%. Ahn and Kim (Citation2012) conducted a similar analysis and successfully distinguished between Korean and imported soybeans with a discriminating rate of 98%. Using a PLS algorithm based on eight wavenumber regions, Lee et al. (Citation2022) found that FT-NIR had about 96% prediction accuracy in separating Korean and imported soybeans. Similar prediction accuracy was reported by Kang et al. (Citation2016). They successfully discriminated Korean soybeans in cheonggukjang (a traditional Korean dish made using fermented soybean) from imported soybeans (China and the USA). Tangendjaja (Citation2020) successfully discriminated soybean meal (SBM) from Argentina, Brazil, and the USA. They measured proximate amino acids, metabolizable energy, and carbohydrate composition of SBM using near-infrared reflectance spectroscopy and applied a stepwise regression technique to select the distinct variables. They concluded that Brazilian SBM possessed higher protein (2%) and amino acid content than the USA and the Argentine SBM. Azam et al. (Citation2021) also used NIR and concluded that protein and oil contents were higher in China and the USA soybeans, respectively. Previous studies made similar conclusions (Grieshop and Fahey Citation2001; Lee and Choung Citation2011).
One published study used FT-IR and multivariate statistical analysis to distinguish between Chinese and Korean soybeans (Lee et al. Citation2018). This study also revealed the regions within China and South Korea where the soybeans were cultivated by analyzing the regional characteristics without considering the variety. Based on three wavenumber regions, they developed a PLSR model and experimented with different scaling and normalization techniques, and VIP-cutoff values. They found that when a VIP cutoff was not used, discriminating against the country of origin (China vs South Korea) was more precise (93.5%). In contrast, a VIP cutoff value of 1.5 was optimal for discriminating the origin of soybean within a country.
FT-IR and NIR spectroscopy provides a cheap, rapid, and noninvasive way of analyzing samples to find their region of origin. In addition, they can detect numerous components in a single scan. As compared to FT-IR spectroscopy, the sample preparation for NIR spectroscopy is simpler. If a shorter wavelength area is used, sample homogenization is not even necessary. However, if a qualitative analysis is the objective, the samples’ moisture content needs to be regulated (Kawano Citation2001). Both of these techniques have a few limitations too. For example, NIR has low sensitivity associated with a high signal-to-noise ratio plus low selectivity of NIR spectra due to the superposition of various overtones and combination bands in the NIR region (Wadood et al. Citation2020). As the particle size decreases, the intensity and area of IR bands increases, therefore the sample preparation for FT-IR needs to be carefully done and can be time-consuming (Udvardi et al. Citation2017; Yang and Fateley Citation1986). Water is a significant absorber in the MIR spectral region and can interfere with determining other components present in food systems (Karoui, Downey, and Blecker Citation2010).
Energy dispersive X-Ray fluorescence spectroscopy (ED-XRF)
ED-XRF is a spectroscopy-based technique for trace element analysis and a great alternative to ICP-MS. The basic operation of an ED-XRF spectrometer begins with irradiating a sample using an X-ray source which ionizes the sample and produces X-ray fluorescence unique to each inorganic element. A semiconductor detector detects this fluorescence, and the various energies are separated and processed at a multi-channel analyzer. Finally, the analogue signal is converted to a digital signal, and both qualitative and quantitative analysis occur (Yao, Wang, and Zhao Citation2015). ED-XRF was initially used mainly for metal authentication. It has recently been proven effective for screening purposes in organic food control, geographical origin authentication, adulteration, and detecting the impact of manufacturing procedures on the food product (Ghidotti, Papoci, et al. Citation2021). Numerous food products have been geographically authenticated using ED-XRF, including olive oil (Lia, Zammit Mangion, and Farrugia Citation2020), honey (Ghidotti, Fiamegos, et al. Citation2021), tea (Rajapaksha et al. Citation2017), milk (Potocnik et al. Citation2016), cocoa powder (Herreros-Chavez, Cervera, and Morales-Rubio Citation2019), and sesame seeds (Choi et al. Citation2016).
Multiple studies analyzed and quantified several trace elements for the provenance analysis of soybeans using ED-XRF (Kim et al. Citation2022; Lai et al. Citation2020; Lee et al. Citation2020; Otaka, Hokura, and Nakai Citation2014). Kim et al. (Citation2022) demonstrated the highest correct prediction rate of 99% while employing the canonical DA based on 11 elements. They revealed that Al, P, S, Cl, Ca, Fe, Ni, Cu, Zn, Br, and Rb concentrations were significantly different (p < 0.05) between the Korean and imported soybeans. Similarly, Lee et al. (Citation2020) were also able to differentiate between Korean and imported soybeans by using just five elements (P, Ni, Br, Zn, and Mn) with a prediction efficiency of 93.4%. With a high prediction efficiency of 95%, Kang et al. (Citation2016) could even distinguish the fermented Korean soybeans from the imported soybeans (from China and the USA) used in a traditional Korean dish called cheonggukjang.
Otaka, Hokura, and Nakai (Citation2014) found a significant difference in 8 elements (Mg, P, Cl, K, Mn, Cu, Br, and Ba) in soybean sourced from Japan and other countries (the USA, Canada, and China). Using LDA, they could discriminate the geographical origins with a prediction accuracy of 91%. According to Lai et al. (Citation2020), soybean from the five provinces of China (Henan, Inner Mongolia, Heilongjiang, Xinjiang, and Liaoning) could be differentiated by performing a multilayer perception (MLP) analysis (96.2% prediction efficiency) based on 8 trace elements (K, Ca, Mn, Fe, Ni, Cu, Zn, and Rb).
The minimal sample preparation is a significant factor in the growing use of ED-XRF spectroscopy and gives it a significant advantage over methods like ICP-AES/MS. Before analysis, the sample must be adequately homogenized, which is the sole substantial sample treatment requirement. Another advantage of ED-XRF spectroscopy over ICP-MS is that it is simple and rapid. In addition, it is noninvasive, the results are highly reproducible, and an operator specialist isn’t necessarily required, making it easier to use at daily foodstuff markets. Compared to ICP-MS methods, the sensitivity of ED-XRF spectroscopy is still a limitation. However, Otaka, Hokura, and Nakai (Citation2014) demonstrated that, except for light components Mg, Al, and P, the findings measured by XRF had standard deviations of less than 10%, and the results acquired via XRF and ICP-MS were in good agreement. The most common way to decrease the detection limit is to increase the irradiation time at the expense of the sample throughput. ED-XRF spectroscopy can be used to analyze a wide range of matrices. Once calibration curves are created, they can easily be corrected for the matrix effects using mathematical algorithms such as fundamental parameters (Ghidotti, Papoci, et al. Citation2021). The ED-XRF method can even be validated without needing matrix-matched calibration curves (Fiamegos and Guntiñas Citation2018).
Terahertz spectroscopy
Terahertz (THz) region refers to a very small gap between the microwave (MW) and IR regions of the electromagnetic spectrum with a frequency range of 0.1 to 10 THz (3.3 cm−1 to 333.6 cm−1). The energy of photons in the THz range makes it possible to analyze the vibrational activity of molecules using THz spectroscopy. THz also has distinctive qualities in addition to reflecting some IR and MW features (Afsah-Hejri et al. Citation2019). For example, THz radiation is non-ionizing and can also travel in the field of vision, and like MW, it can penetrate a broad range of non-conductive materials. The spectral responses in the THz frequency range comprise evidence of intramolecular and inter-molecular motions, which are beneficial to reflect a single-molecular structure and molecular arrangements. Similar to other spectroscopy techniques, the radiation source (electron beam), lenses or polarizers for manipulating the radiation, and the detector are the three fundamental components of the THz spectrometer (Patil et al. Citation2022).
In 1960, THz radiation was employed for the first time to generate astronomical images. It wasn’t until 1995 that THz time-domain spectroscopy (THz-TDS) depicted its use in food inspection (Sethy et al. Citation2015). Over the last two decades, THz spectroscopy has been applied in a wide range of fields, including security screening, astronomical studies, communication, medical imaging, pharmaceuticals, agriculture, environmental monitoring (Afsah-Hejri et al. Citation2019), adulteration detection (Liu, Zhang, et al. Citation2020), and to differentiate cultivars (Chen et al. Citation2016). Furthermore, it has recently been used to classify the geographical origin of food products such as wheat (Shen et al. Citation2022), olive oils (Liu, Liu, et al. Citation2018), coffee beans (Yang et al. Citation2021), tea (Li, Dai, et al. Citation2017), and honey (Liu, Zhang, et al. Citation2018).
Multiple studies have identified soybean cultivars, including transgenic soybeans using THz spectroscopy (Liu et al. Citation2016; Luo et al. Citation2019; Tu et al. Citation2021; Wei, Zheng, et al. Citation2020). However, to the best of our knowledge, only one study has coupled THz-TDS with chemometrics to successfully establish the geographic origin of soybean (Wei, Zhu, et al. Citation2020). They employed iPLS to optimize THz-TDS spectra and developed three identification models; extreme learning machine (ELM), genetic algorithm support vector machine (GA-SVM), and artificial bee colony algorithm support vector machine (ABC-SVM) combined with 8 pre-processing techniques. They concluded that ABC-SVM with auto-scaling was the best model to differentiate the geographical origin with an identification accuracy of approximately 95%.
Like infrared spectroscopy, THz spectroscopy is green, noninvasive, rapid, and doesn’t require extensive sample preparation (Liu et al. Citation2016). However, it contrasts with infrared approaches and hyperspectral imaging in that it can provide information on both low-frequency intramolecular and intermolecular modes of molecules (Liu, Chen, et al. Citation2018). Furthermore, THz waves can penetrate through various materials and have low photon energy, which lowers the risk of possible sample damage. Moreover, the waves are coherent, which offers them an edge over FTIR spectroscopy (Patil et al. Citation2022). Compared to FTIR and Raman spectroscopy, the coherent character of this approach amplifies its sensitivity and dynamic range (GuoZhong et al. Citation2012). The non-ionizing nature of THz radiation makes it a great and safer alternative to X-rays in generating high-resolution images from the inner parts of a solid object. One of the main drawbacks of the THz technique is that the THz radiation can be entirely absorbed by water, limiting its use in the food sector (Mathanker et al. Citation2013). The scattering effect, limited sensitivity and penetration, low limit of detection, and lack of a well-established THz database library are among the other limitations of THz spectroscopy (Afsah-Hejri et al. Citation2019).
Research gap
As discussed in the sections above, various approaches have been used for the provenance analysis of soybean. However, there are additional potential methods that could be applied, albeit they haven’t yet been investigated to determine the geographical origin of soybean. To our knowledge, techniques such as Raman spectroscopy, hyperspectral imaging spectroscopy, and DNA-based techniques haven’t been reported for soybean provenance. These techniques have been combined with multivariate analysis in several studies for other food product traceability and fingerprinting. For example, Zhu et al. (Citation2018) utilized Raman spectroscopy with multivariate data analysis to determine the geographical origin of rice with a recognition rate of approximately 97%. Similarly, provenance studies of honey (Corvucci et al. Citation2015) and wine (Mandrile et al. Citation2016) have demonstrated the effectiveness of Raman spectroscopy in the traceability field.
As the name suggests, hyperspectral imaging spectroscopy integrates imaging and spectroscopic techniques into one system (Li et al. Citation2017). This technique is most popularly used to discriminate the crop varieties, including soybean (Tan et al. Citation2014; Zhu et al. Citation2020), fruits (Liu et al. Citation2014; Zhao et al. Citation2018), edible oils (Xie, Wang, and He Citation2014), meat and beverages (Feng et al. Citation2021). The use of hyperspectral imaging in traceability is still novel, so it hasn’t been applied widely. However, numerous provenance investigations have demonstrated that it has a promising scope. For instance, Hai-Yan, Zhan-Qi, and Zhen-Hong (Citation2019) used machine learning algorithms to differentiate millets from three regions of China with an average prediction rate of 90%; Kim, Lim, et al. (Citation2020) employed PLS-DA and achieved a high discrimination accuracy of 99% in discriminating rice from South Korea and China; Choi, Kim, and Moon (Citation2021) applied the same approach and achieved a discrimination prediction accuracy of 91% for chia seeds from Argentina, Paraguay, and Bolivia. Similarly, it has been used for traceability analysis of Chinese wolfberries (Yin et al. Citation2017), peaches (Sun et al. Citation2021), tea (Hong and He Citation2020), and saffron (Lu et al. Citation2020).
Numerous DNA-based techniques have been used to identify countries of origin, including microsatellites, species-specific PCR amplification, single nucleotide polymorphisms (SNPs), DNA sequencing, and cleaved amplified polymorphisms (Wilkes, Nixon, and Burns Citation2016). DNA fingerprinting has been employed to trace the geographical origin of several products, including beef (Vázquez et al. Citation2004), timber (Hung, Lin, and Ju Citation2017), honey (Khansaritoreh et al. Citation2020), olive oil (Woolfe and Primrose Citation2004), and seafood (Takashima et al. Citation2014). Hung, Lin, and Ju (Citation2017) determined and genotyped 16 microsatellites to discriminate between the legal and illegal logged timber from Taiwan. The provenance of soybeans may benefit substantially from such a strategy.
Conclusion
Consumer interest in high-quality food and its supply chain transparency has increased rapidly over the past decade, favouring the development of several analytical techniques for food traceability purposes, such as geochemical, chromatographic, and spectroscopic techniques. New advancements in machine learning methods have also offered us an innovative approach to looking at the data differently and better comprehending it. Combining chemometrics with analytical techniques allows for analyzing specific product attributes influenced by geographic origin. In this review, we have discussed ten techniques, broadly categorized into three groups that have been utilized to determine the geographical origin of soybean. However, each of these methods has advantages and disadvantages of its own. For example, the major drawback of geochemical techniques is their instrumental and operational costs, which can be mitigated by spectroscopic methods at the expense of sensitivity. Lastly, we have discovered research gaps in analytical techniques, including DNA techniques, Raman, and hyperspectral spectroscopies that have the potential to determine the provenance of soybeans.
Acknowledgements
We would like to acknowledge the University of Otago for the Doctoral Scholarship.
Disclosure statement
The authors declare that they have no known conflict of interests.
Additional information
Funding
Notes
1 All units are in million metric tons (MMT).
2 Least significant difference
3 General linear model
4 Exact origins weren’t specified.
References
- Afsah-Hejri, L., P. Hajeb, P. Ara, and R. J. Ehsani. 2019. A comprehensive review on food applications of terahertz spectroscopy and imaging. Comprehensive reviews in Food Science and Food Safety 18 (5):1563–621. doi: 10.1111/1541-4337.12490.
- Ahn, H.-G., and Y.-H. Kim. 2012. 근적외선분광광도계(NIRS)를 이용한 국내산 콩과 수입콩의 판별분석 [Discrimination of Korean domestic and foreign soybeans using near infrared reflectance spectroscopy]. Korean Journal of Crop Science 57 (3):296–300. doi: 10.7740/kjcs.2012.57.3.296.
- Alghamdi, S. S., M. A. Khan, E. H. El-Harty, M. H. Ammar, M. Farooq, and H. M. Migdadi. 2018. Comparative phytochemical profiling of different soybean (Glycine Max (L.) Merr.) genotypes using GC–MS. Saudi journal of Biological Sciences 25 (1):15–21. doi: 10.1016/j.sjbs.2017.10.014.
- Ariyama, K., Y. Aoyama, A. Mochizuki, Y. Homura, M. Kadokura, and A. Yasui. 2007. Determination of the geographic origin of onions between three main production areas in Japan and other countries by mineral composition. Journal of Agricultural and Food Chemistry 55 (2):347–54. doi: 10.1021/jf062613m.
- Aursand, M., I. B. Standal, A. Praël, L. McEvoy, J. Irvine, and D. E. Axelson. 2009. 13C NMR pattern recognition techniques for the classification of Atlantic Salmon (Salmo Salar L.) According to their wild, farmed, and geographical origin. Journal of Agricultural and Food Chemistry 57 (9):3444–51. doi: 10.1021/jf8039268.
- Azam, M., S. Zhang, J. Qi, A. M. Abdelghany, A. S. Shaibu, S. Ghosh, Y. Feng, Y. Huai, B. S. Gebregziabher, J. Li, et al. 2021. Profiling and associations of seed nutritional characteristics in Chinese and USA soybean cultivars. Journal of Food Composition and Analysis 98:103803. doi: 10.1016/j.jfca.2021.103803.
- Baoxin, l., and Z. Dongjie. 2017. 基于矿物元素指纹图谱的黑龙江黄豆产地溯源 [Origin traceability of Heilongjiang soybean using fingerprint of mineral elements]. Chinese Journal of Agricultural Engineering 33 (21):216–21. doi: 10.11975/j.issn.1002-6819.2017.21.026.
- Bassbasi, M., M. De Luca, G. Ioele, A. Oussama, and G. Ragno. 2014. Prediction of the geographical origin of butters by partial least square discriminant analysis (PLS-DA) applied to infrared spectroscopy (FTIR) data. Journal of Food Composition and Analysis 33 (2):210–5. doi: 10.1016/j.jfca.2013.11.010.
- Beale, D. J., F. R. Pinu, K. A. Kouremenos, M. M. Poojary, V. K. Narayana, B. A. Boughton, K. Kanojia, S. Dayalan, O. A. H. Jones, and D. A. Dias. 2018. Review of recent developments in GC–MS approaches to metabolomics-based research. Metabolomics 14 (11):1–31. doi: 10.1007/s11306-018-1449-2.
- Bellaloui, N., J. E. Hanks, D. K. Fisher, and A. Mengistu. 2009. Soybean seed composition is influenced by within-field variability in soil nutrients. Crop Management 8 (1):1–12. doi: 10.1094/CM-2009-1203-01-RS.
- Berrueta, L. A., R. M. Alonso-Salces, and K. Héberger. 2007. Supervised pattern recognition in food analysis. Journal of Chromatography. A 1158 (1–2):196–214. doi: 10.1016/j.chroma.2007.05.024.
- Berry, Michael W., Azlinah Mohamed, and Bee Wah Yap, Eds. 2020. Supervised and Unsupervised Learning for Data Science. Cham: Springer International Publishing.
- Bertoldi, D., A. Barbero, F. Camin, A. Caligiani, and R. Larcher. 2016. Multielemental fingerprinting and geographic traceability of Theobroma cacao beans and cocoa products. Food Control 65:46–53. doi: 10.1016/j.foodcont.2016.01.013.
- Brescia, M. A., I. J. Košir, V. Caldarola, J. Kidrič, and A. Sacco. 2003. Chemometric classification of Apulian and Slovenian wines using 1H NMR and ICP-OES together with HPICE data. Journal of Agricultural and Food Chemistry 51 (1):21–26. doi: 10.1021/jf0206015.
- Brodie, C., O. Kracht, and A. Hilkert. 2019. Tracing the geographical origin of roasted and green coffee using isotope fingerprints. Journal of AOAC International 102 (2):653–4. doi: 10.5740/jaoacint.18-0314.
- Cabrera, K. 2004. Applications of silica-based monolithic HPLC columns. Journal of Separation Science 27 (10–11):843–52. doi: 10.1002/jssc.200401827.
- Charbeneau, D. 2021. “Soy and deforestation: Everything you need to know.” Animal Equality. International Animal Protection Organization, September 28.
- Chen, H., C. Fan, Q. Chang, G. Pang, X. Hu, M. Lu, and W. Wang. 2014. Chemometric determination of the botanical origin for Chinese honeys on the basis of mineral elements determined by ICP-MS. Journal of Agricultural and Food Chemistry 62 (11):2443–8. doi: 10.1021/jf405045q.
- Chen, T., Z. Li, X. Yin, F. Hu, and C. Hu. 2016. Discrimination of genetically modified sugar beets based on terahertz spectroscopy. Spectrochimica acta. Part A, Molecular and Biomolecular Spectroscopy 153:586–90. doi: 10.1016/j.saa.2015.09.028.
- Choi, J.-Y., H.-C. Kim, and K.-D. Moon. 2021. Geographical origin discriminant analysis of chia seeds (Salvia Hispanica L.) using hyperspectral imaging. Journal of Food Composition and Analysis 101:103916. doi: 10.1016/j.jfca.2021.103916.
- Choi, M.-Y., W. Choi, J. H. Park, J. Lim, and S. W. Kwon. 2010. Determination of coffee origins by integrated metabolomic approach of combining multiple analytical data. Food Chemistry 121 (4):1260–8. doi: 10.1016/j.foodchem.2010.01.035.
- Choi, Y. H., C. K. Hong, G. Y. Park, C. K. Kim, J. H. Kim, K. Jung, and J.-H. Kwon. 2016. A nondestructive approach for discrimination of the origin of sesame seeds using ED-XRF and NIR spectrometry with chemometrics. Food science and Biotechnology 25 (2):433–8. doi: 10.1007/s10068-016-0059-x.
- Chung, I.-M., Y.-J. Kim, H.-S. Moon, H.-Y. Chi, and S.-H. Kim. 2021. Long-term isotopic model study for ecofriendly rice (Oryza sativa L.) authentication: Updating a case study in South Korea. Food chemistry 362:130215. doi: 10.1016/j.foodchem.2021.130215.
- Collomb, M., U. Bütikofer, R. Sieber, B. Jeangros, and J.-O. Bosset. 2002. Composition of fatty acids in Cow’s milk fat produced in the lowlands, mountains and highlands of Switzerland using high-resolution gas chromatography. International Dairy Journal 12 (8):649–59. doi: 10.1016/S0958-6946(02)00061-4.
- Consonni, R., L. R. Cagliani, and C. Cogliati. 2012. NMR based geographical characterization of roasted coffee. Talanta 88:420–6. doi: 10.1016/j.talanta.2011.11.010.
- Corvucci, F., L. Nobili, D. Melucci, and F.-V. Grillenzoni. 2015. The discrimination of honey origin using melissopalynology and raman spectroscopy techniques coupled with multivariate analysis. Food chemistry 169:297–304. doi: 10.1016/j.foodchem.2014.07.122.
- Coskun, O. 2016. Separation techniques: Chromatography. Northern clinics of Istanbul 3 (2):156–60. doi: 10.14744/nci.2016.32757.
- Cui, D., Y. Liu, H. Yu, Z. Wang, and X. Mao. 2021. Geographical traceability of soybean based on elemental fingerprinting and multivariate analysis. Journal of Consumer Protection and Food Safety 16 (4):323–31. doi: 10.1007/s00003-021-01340-2.
- Desta, K. T., O. S. Hur, S. Lee, H. Yoon, M.-J. Shin, J. Yi, Y. Lee, N. Y. Ro, X. Wang, and Y.-M. Choi. 2022. Origin and seed coat color differently affect the concentrations of metabolites and antioxidant activities in soybean (Glycine Max (L.) Merrill) seeds. Food chemistry 381:132249. doi: 10.1016/j.foodchem.2022.132249.
- Dhungana, S. K., J.-H. Seo, B.-K. Kang, J.-H. Park, J.-H. Kim, J.-S. Sung, I.-Y. Baek, S.-O. Shin, and C.-S. Jung. 2021. Protein, amino acid, oil, fatty acid, sugar, anthocyanin, isoflavone, lutein, and antioxidant variations in colored seed-coated soybeans. Plants 10 (9):1765. doi: 10.3390/plants10091765.
- Di Cagno, R., J. Banks, L. Sheehan, P. F. Fox, E. Y. Brechany, A. Corsetti, and M. Gobbetti. 2003. Comparison of the microbiological, compositional, biochemical, volatile profile and sensory characteristics of three Italian PDO Ewes’ milk cheeses. International Dairy Journal 13 (12):961–72. doi: 10.1016/S0958-6946(03)00145-6.
- Dong, M., and A. Llanas. 2013. The essence of modern HPLC: Advantages, limitations, fundamentals, and opportunities. Lc Gc North America 31 (6):472–9.
- Sheng, C. D., J. H. Yu, L. H. Qing, W. Z. Hui, and M. Xue Fei. 2020. Geographical specificity of fatty acid and multi-element fingerprints of soybean in Northern China. Quality Assurance and Safety of Crops & Foods 12 (3):126–39. doi: 10.15586/qas.v12i3.767.
- Ehtesham, E., A. R. Hayman, K. A. McComb, R. Van Hale, and R. D. Frew. 2013. Correlation of geographical location with stable isotope values of hydrogen and carbon of fatty acids from new zealand milk and bulk milk powder. Journal of Agricultural and Food Chemistry 61 (37):8914–23. doi: 10.1021/jf4024883.
- Emwas, A.-H M. 2015. The strengths and weaknesses of NMR Spectroscopy and Mass Spectrometry with Particular Focus on Metabolomics Research. In J. T. Bjerrum, Ed., Metabonomics: Methods and Protocols, Methods in Molecular Biology, p. 161–93. New York, NY: Springer.
- Esteki, M., J. Simal-Gandara, Z. Shahsavari, S. Zandbaaf, E. Dashtaki, and Y. Vander Heyden. 2018. A review on the application of chromatographic methods, coupled to chemometrics, for food authentication. Food Control 93:165–82. doi: 10.1016/j.foodcont.2018.06.015.
- Esteki, M., N. Memarbashi, and J. Simal-Gandara. 2022. Classification and authentication of tea according to their geographical origin based on FT-IR fingerprinting using pattern recognition methods. Journal of Food Composition and Analysis 106:104321. doi: 10.1016/j.jfca.2021.104321.
- Etièvant, P., P. Schlich, R. Cantagrel, M. Bertrand, and J.-C. Bouvier. 1989. Varietal and geographic classification of French red wines in terms of major acids. Journal of the Science of Food and Agriculture 46 (4):421–38. doi: 10.1002/jsfa.2740460405.
- Farquhar, G. D., K. T. Hubick, A. G. Condon, and R. A. Richards. 1989. Carbon isotope fractionation and plant water-use efficiency. In P. W. Rundel, J. R. Ehleringer, and K. A. Nagy Eds. Stable Isotopes in Ecological Research, Ecological Studies, p. 21–40. New York, NY: Springer.
- Feng, L., B. Wu, S. Zhu, Y. He, and C. Zhang. 2021. Application of visible/infrared spectroscopy and hyperspectral imaging with machine learning techniques for identifying food varieties and geographical origins. Frontiers in Nutrition 8:680357. doi: 10.3389/fnut.2021.680357.
- Fiamegos, Y., and M. B. d. l. C. Guntiñas. 2018. Validation strategy for an ED-XRF method to determine trace elements in a wide range of organic and inorganic matrices based on fulfilment of performance criteria. Spectrochimica Acta Part B: Atomic Spectroscopy 150:59–66. doi: 10.1016/j.sab.2018.10.009.
- Fraser, K., G. A. Lane, D. E. Otter, Y. Hemar, S.-Y. Quek, S. J. Harrison, and S. Rasmussen. 2013. Analysis of metabolic markers of tea origin by UHPLC and high resolution mass spectrometry. Food Research International 53 (2):827–35. doi: 10.1016/j.foodres.2012.10.015.
- Gao, F., X. Hao, G. Zeng, L. Guan, H. Wu, L. Zhang, R. Wei, H. Wang, and H. Li. 2022. Identification of the geographical origin of Ecolly (Vitis Vinifera L.) grapes and wines from different chinese regions by ICP-MS coupled with chemometrics. Journal of Food Composition and Analysis 105:104248. doi: 10.1016/j.jfca.2021.104248.
- Gaspardo, B., A. Lavrenčič, A. Levart, S. D. Zotto, and B. Stefanon. 2010. Use of milk fatty acids composition to discriminate area of origin of Bulk Milk. Journal of Dairy Science 93 (8):3417–26. doi: 10.3168/jds.2009-2788.
- Geana, I., A. Iordache, R. Ionete, A. Marinescu, A. Ranca, and M. Culea. 2013. Geographical origin identification of Romanian wines by ICP-MS elemental analysis. Food chemistry 138 (2–3):1125–34. doi: 10.1016/j.foodchem.2012.11.104.
- Gerbig, S., S. Neese, A. Penner, B. Spengler, and S. Schulz. 2017. Real-time food authentication using a miniature mass spectrometer. Analytical chemistry 89 (20):10717–25. doi: 10.1021/acs.analchem.7b01689.
- Ghidotti, M., Y. Fiamegos, C. Dumitrascu, and M. Beatriz de la Calle. 2021. Use of elemental profiles to verify geographical origin and botanical variety of Spanish honeys with a protected denomination of origin. Food chemistry 342:128350. doi: 10.1016/j.foodchem.2020.128350.
- Ghidotti, M., S. Papoci, C. Dumitrascu, T. Zdiniakova, Y. Fiamegos, and M. B. d l C. Gutiñas. 2021. ED-XRF as screening tool to help customs laboratories in their fight against fraud. State-of-the-art. Talanta Open 3:100040. doi: 10.1016/j.talo.2021.100040.
- Giannetti, V., M. Boccacci Mariani, P. Mannino, and F. Marini. 2017. Volatile fraction analysis by HS-SPME/GC-MS and chemometric modeling for traceability of apples cultivated in the Northeast Italy. Food Control. 78:215–21. doi: 10.1016/j.foodcont.2017.02.036.
- Gonzalez-Fernandez, I., M. A. Iglesias-Otero, M. Esteki, O. A. Moldes, J. C. Mejuto, and J. Simal-Gandara. 2019. A critical review on the use of artificial neural networks in olive oil production, characterization and authentication. Critical reviews in Food Science and Nutrition 59 (12):1913–26. doi: 10.1080/10408398.2018.1433628.
- Grieshop, C. M., and G. C. Fahey. 2001. Comparison of quality characteristics of soybeans from Brazil, China, and the United States. Journal of Agricultural and Food Chemistry 49 (5):2669–73. doi: 10.1021/jf0014009.
- Guillén-Casla, V., N. Rosales-Conrado, M. Eugenia León-González, L. V. Pérez-Arribas, and L. M. Polo-Díez. 2011. Principal Component Analysis (PCA) and Multiple Linear Regression (MLR) statistical tools to evaluate the effect of E-beam irradiation on ready-to-eat food. Journal of Food Composition and Analysis 24 (3):456–64. doi: 10.1016/j.jfca.2010.11.010.
- Gumustas, M., S. Kurbanoglu, B. Uslu, and S. A. Ozkan. 2013. UPLC versus HPLC on drug analysis: Advantageous, applications and their validation parameters. Chromatographia 76 (21–22):1365–427. doi: 10.1007/s10337-013-2477-8.
- Guo, J., Y. Yuan, P. Dou, and T. Yue. 2017. Multivariate statistical analysis of the polyphenolic constituents in kiwifruit juices to trace fruit varieties and geographical origins. Food chemistry 232:552–9. doi: 10.1016/j.foodchem.2017.04.037.
- Guo, J., T. Yue, Y. Yuan, and Y. Wang. 2013. Chemometric classification of apple juices according to variety and geographical origin based on polyphenolic profiles. Journal of Agricultural and Food Chemistry 61 (28):6949–63. doi: 10.1021/jf4011774.
- GuoZhong, Z. H. A. O., W. A. N. G. He, L. I. U. LiMing, and W. A. N. G. XiaoYan. 2012. THz spectra of parabens at low temperature. Sci China Inf Sci 55 (1):114–9. doi: 10.1007/s11432-011-4511-5.
- Hai-Yan, J., R. Zhan-Qi, and R. Zhen-Hong. 2019. Discriminant analysis of Millet from different origins based on hyperspectral imaging technology. Spectroscopy and Spectral Analysis 39 (7):2271–7. doi: 10.3964/j.issn.1000-0593(2019)07-2271-07.
- Hartman, G. L., E. D. West, and T. K. Herman. 2011. Crops that feed the World 2. Soybean—Worldwide production, use, and constraints caused by pathogens and pests. Food Security 3 (1):5–17. doi: 10.1007/s12571-010-0108-x.
- Hasan, N., E. Suryani, and R. Hendrawan. 2015. Analysis of soybean production and demand to develop strategic policy of food self sufficiency: A system dynamics framework. Procedia Computer Science 72:605–12. doi: 10.1016/j.procs.2015.12.169.
- Herreros-Chavez, L., M. L. Cervera, and A. Morales-Rubio. 2019. Direct determination by portable ED-XRF of mineral profile in cocoa powder samples. Food chemistry 278:373–9. doi: 10.1016/j.foodchem.2018.11.065.
- Hidalgo, M. J., D. C. Fechner, D. Ballabio, E. J. Marchevsky, and R. G. Pellerano. 2020. Traceability of soybeans produced in argentina based on their trace element profiles. Journal of Chemometrics 34 (12):e3252. doi: 10.1002/cem.3252.
- Homura, Y., T. Suzuki, H. Kosaka, H. Horita, and A. Yasui. 2006. Determination of the geographic origin of one grain of black soybean Tanbaguro by using inorganic elements composition. Nippon Shokuhin Kagaku Kogaku Kaishi 53 (12):619–26. doi: 10.3136/nskkk.53.619.
- Hong, Z., and Y. He. 2020. Rapid and nondestructive discrimination of geographical origins of Longjing tea using hyperspectral imaging at two spectral ranges coupled with machine learning methods. Applied Sciences 10 (3):1173. doi: 10.3390/app10031173.
- Hu, X.-Z., S.-Q. Liu, X.-H. Li, C.-X. Wang, X.-L. Ni, X. Liu, Y. Wang, Y. Liu, and C.-H. Xu. 2019. Geographical origin traceability of cabernet sauvignon wines based on infrared fingerprint technology combined with chemometrics. Scientific reports 9 (1):8256. doi: 10.1038/s41598-019-44521-8.
- H. Jao., Ying, C. L. Wu, Shih Shun Wen, and W. Fu. 2017. 應用無機元素指紋圖譜技術於毛豆產地鑑別模型之建立 [Model for identifying the geographical origin of vegetable soybeans based on inorganic element fingerprint technology]. 臺灣農業化學與食品科學 55 (2):104–11. doi: 10.6578/TJACFS.2017.011.
- Hung, K.-H., C.-H. Lin, and L.-P. Ju. 2017. Tracking the geographical origin of timber by DNA fingerprinting: A study of the endangered species Cinnamomum Kanehirae in Taiwan. Holzforschung 71 (11):853–62. doi: 10.1515/hf-2017-0026.
- Huo, Y., G. M. Kamal, J. Wang, H. Liu, G. Zhang, Z. Hu, F. Anwar, and H. Du. 2017. 1H NMR-based metabolomics for discrimination of rice from different geographical origins of China. Journal of Cereal Science 76:243–52. doi: 10.1016/j.jcs.2017.07.002.
- Ibañez, E., and A. Cifuentes. 2001. New analytical techniques in food science. Critical reviews in Food Science and Nutrition 41 (6):413–50. doi: 10.1080/20014091091878.
- Ibáñez, M. A., C. de Blas, L. Cámara, and G. G. Mateos. 2020. Chemical composition, protein quality and nutritive value of commercial soybean meals produced from beans from different countries: A meta-analytical study. Animal Feed Science and Technology 267:114531. doi: 10.1016/j.anifeedsci.2020.114531.
- Jandrić, Z., M. Islam, D. K. Singh, and A. Cannavan. 2017. Authentication of Indian citrus fruit/fruit juices by untargeted and targeted metabolomics. Food Control. 72:181–8. doi: 10.1016/j.foodcont.2015.10.044.
- Hirst, K. K. 2019. “Why domestic soybeans have half the genetic diversity of wild ones.” ThoughtCo. Retrieved May 4, 2022 (https://www.thoughtco.com/plant-history-of-the-soybean-3879343).
- Kaler, A. S., S. K. Bazzer, A. Sanz-Saez, J. D. Ray, F. B. Fritschi, and L. C. Purcell. 2018. Carbon isotope ratio fractionation among plant tissues of soybean. The Plant Phenome Journal 1 (1):1–6. doi: 10.2135/tppj2018.04.0002.
- Kalpage, M., C. Dissanayake, S. Diyabalanage, R. Chandrajith, R. Frew, and R. Fernando. 2022. Stable isotope and element profiling for determining the agroclimatic origin of cow milk within a tropical country. Foods 11 (3):275. doi: 10.3390/foods11030275.
- Kamal, M., and R. Karoui. 2015. Analytical methods coupled with chemometric tools for determining the authenticity and detecting the adulteration of dairy products: A review. Trends in Food Science & Technology 46 (1):27–48. doi: 10.1016/j.tifs.2015.07.007.
- Kang, D.-J., J.-Y. Moon, D.-G. Lee, and S.-H. Lee. 2016. 근적외선분광분석기 및 에너지 분산형 X선 형광분석기를 이용한 청국장 원산지 판별[Identification of the geographical origin of Cheonggukjang by using fourier transform near-infrared spectroscopy and energy dispersive X-ray fluorescence spectrometry] [text in Korean]. Korean Journal of Food Science and Technology 48 (5):418–23. doi: 10.9721/KJFST.2016.48.5.418.
- Karoui, R., G. Downey, and C. Blecker. 2010. Mid-infrared spectroscopy coupled with chemometrics: A tool for the analysis of intact food systems and the exploration of their molecular structure − quality relationships − A review. Chemical reviews 110 (10):6144–68. doi: 10.1021/cr100090k.
- Karoui, R., É. Dufour, L. Pillonel, D. Picque, T. Cattenoz, and J.-O. Bosset. 2004. Determining the geographic origin of emmental cheeses produced during winter and summer using a technique based on the concatenation of MIR and fluorescence spectroscopic data. European Food Research and Technology 219 (2):184–9. doi: 10.1007/s00217-004-0936-z.
- Karr-Lilienthal, L. K., C. M. Grieshop, N. R. Merchen, D. C. Mahan, and G. C. Fahey. 2004. Chemical composition and protein quality comparisons of soybeans and soybean meals from five leading soybean-producing countries. Journal of Agricultural and Food Chemistry 52 (20):6193–9. doi: 10.1021/jf049795+.
- Kawano, S. 2001. Sampling and sample presentation. In H. W. Siesler, Y. Ozaki, S. Kavata, and H. M. Heise, 1st ed, Eds., Near-infrared spectroscopy: Principles, instruments, applications, 115–24. Germany: John Wiley & Sons, Ltd.
- Kelly, S., M. Baxter, S. Chapman, C. Rhodes, J. Dennis, and P. Brereton. 2002. The application of isotopic and elemental analysis to determine the geographical origin of premium long grain rice. European Food Research and Technology 214 (1):72–8. doi: 10.1007/s002170100400.
- Khansaritoreh, E., Y. Salmaki, E. Ramezani, T. Akbari Azirani, A. Keller, K. Neumann, K. Alizadeh, S. Zarre, G. Beckh, and H. Behling. 2020. Employing DNA metabarcoding to determine the geographical origin of honey. Heliyon 6 (11):e05596. doi: 10.1016/j.heliyon.2020.e05596.
- Kim, E.-H., H.-M. Ro, S.-L. Kim, H.-S. Kim, and I.-M. Chung. 2012. Analysis of isoflavone, phenolic, soyasapogenol, and tocopherol compounds in soybean [Glycine Max (L.) Merrill] germplasms of different seed weights and origins. Journal of Agricultural and Food Chemistry 60 (23):6045–55. doi: 10.1021/jf300463f.
- Kim, M.-H., J.-H. Rho, and C.-H. Lee. 2009. NMR relaxation 기법을 이용한 한국산과 중국산 대두의 원산지 판별 [The geographical discrimination of Korean and Chinese Soybeans (Glycine max (L.) merrill) using NMR relaxation methods] [text in Korean]. Korean Journal of Food Science and Technology 41 (3):292–5.
- Kim, M.-J., J. Lim, S. W. Kwon, G. Kim, M. S. Kim, B.-K. Cho, I. Baek, S. H. Lee, Y. Seo, and C. Mo. 2020. Geographical origin discrimination of white rice based on image pixel size using hyperspectral fluorescence imaging analysis. Applied Sciences 10 (17):5794. doi: 10.3390/app10175794.
- Kim, N., M. Jang, J. Jo, J. Park, A. Kim, and I. Hwang. 2022. Application of energy dispersive X-ray fluorescence spectrometry and near-infrared reflectance spectroscopy combined with multivariate statistical analysis for discriminating the geographical origin of soybeans. Food Control. 140:109140. doi: 10.1016/j.foodcont.2022.109140.
- Kim, S. S., M.-R. Rhyu, J. M. Kim, and S.-H. Lee. 2003. Authentication of rice using near-infrared reflectance spectroscopy. Cereal Chemistry Journal 80 (3):346–9. doi: 10.1094/CCHEM.2003.80.3.346.
- Kim, S.-Y., S. Y. Kim, S. M. Lee, D. Y. Lee, B. K. Shin, D. J. Kang, H.-K. Choi, and Y.-S. Kim. 2020. Discrimination of cultivated regions of soybeans (Glycine Max) based on multivariate data analysis of volatile metabolite profiles. Molecules 25 (3):763. doi: 10.3390/molecules25030763.
- Kučera, J., Pp, In. 2009. Chapter 2 – Assay of iodine in foodstuffs: Methods and applications. In V. R. Preedy, G. N. Burrow, and R. Watson, Eds. Comprehensive Handbook of Iodine, 15–27. San Diego: Academic Press.
- Lai, H., J. Xi, J. Sun, W. He, Z. Wang, C. Zheng, and X. Mao. 2020. Multi-elemental analysis by energy dispersion X-ray fluorescence spectrometry and its application on the traceability of soybean origin. Atomic Spectroscopy 41 (1):20–8. doi: 10.46770/AS.2020.01.003.
- Laursen, K. H., J. K. Schjoerring, J. E. Olesen, M. Askegaard, U. Halekoh, and S. Husted. 2011. Multielemental fingerprinting as a tool for authentication of organic wheat, barley, faba bean, and potato. Journal of Agricultural and Food Chemistry 59 (9):4385–96. doi: 10.1021/jf104928r.
- Lee, B.-J., Y. Zhou, J. S. Lee, B. K. Shin, J.-A. Seo, D. Lee, Y.-S. Kim, and H.-K. Choi. 2018. Discrimination and prediction of the origin of Chinese and Korean soybeans using fourier transform infrared spectrometry (FT-IR) with multivariate statistical analysis. PloS One 13 (4):e0196315. doi: 10.1371/journal.pone.0196315.
- Lee, E. M., S. J. Park, J.-E. Lee, B. M. Lee, B. K. Shin, D. J. Kang, H.-K. Choi, Y.-S. Kim, and D. Y. Lee. 2019. Highly geographical specificity of metabolomic traits among Korean domestic soybeans (Glycine Max). Food research International (Ottawa, Ont.) 120:12–8. doi: 10.1016/j.foodres.2019.02.021.
- Lee, G.-A., G. W. Crawford, L. Liu, Y. Sasaki, and X. Chen. 2011. Archaeological soybean (Glycine Max) in East Asia: Does size matter? PloS one 6 (11):e26720. doi: 10.1371/journal.pone.0026720.
- Lee, J. H., J. M. An, H. J. Kim, H. C. Shin, S. H. Hur, and S. H. Lee. 2022. Rapid discrimination of the country origin of soybeans based on FT-NIR spectroscopy and data expansion. Food Analytical Methods 15 (12):3322–33. doi: 10.1007/s12161-022-02375-3.
- Lee, J.-H., D.-J. Kang, E.-H. Jang, S.-H. Hur, B.-K. Shin, G.-T. Han, and S.-H. Lee. 2020. ED-XRF (Energy dispersive X-ray fluorescence spectrometer)를 이용한 콩 원산지 판별[Discrimination of geographical origin for soybeans using ED-XRF] [text in Korean]. Korean Journal of Food Science and Technology 52 (2):125–9. doi: 10.9721/KJFST.2020.52.2.125.
- Lee, J. H., and M.-G. Choung. 2011. Comparison of nutritional components in soybean varieties with different geographical origins. Journal of the Korean Society for Applied Biological Chemistry 54 (2):254–63. doi: 10.3839/jksabc.2011.040.
- Lehotay, S. J., and J. Hajšlová. 2002. Application of gas chromatography in food analysis. TrAC Trends in Analytical Chemistry 21 (9–10):686–97. doi: 10.1016/S0165-9936(02)00805-1.
- Li, C., H. Dong, D. Luo, Y. Xian, and X. Fu. 2016. Recent developments in application of stable isotope and multi-element analysis on geographical origin traceability of cereal grains. Food Analytical Methods 9 (6):1512–9. doi: 10.1007/s12161-015-0328-y.
- Li, M., G. Dai, T. Chang, C. Shi, D. Wei, C. Du, and H.-L. Cui. 2017. Accurate determination of geographical origin of tea based on terahertz spectroscopy. Applied Sciences 7 (2):172. doi: 10.3390/app7020172.
- Li, X., R. Li, M. Wang, Y. Liu, B. Zhang, and J. Zhou. 2017. Hyperspectral imaging and their applications in the nondestructive quality assessment of fruits and vegetables. In A. I. L. Maldonado, H. R. Fuentes, and J. A. V. Contreras, Eds., Hyperspectral imaging in agriculture, food and environment, 27–63. UK: IntechOpen.
- Lia, F., M. Zammit Mangion, and C. Farrugia. 2020. Application of elemental analysis via energy dispersive X-Ray fluorescence (ED-XRF) for the authentication of Maltese extra virgin olive oil. Agriculture 10 (3):71. doi: 10.3390/agriculture10030071.
- Chiang, L., and V. Ikeda. 2017. The Potential of Brazil’s Growing Soy Exports to China.
- Lin, J., P. Zhang, Z. Pan, H. Xu, Y. Luo, and X. Wang. 2013. Discrimination of Oolong Tea (Camellia Sinensis) varieties based on feature extraction and selection from aromatic profiles analysed by HS-SPME/GC-MS. Food chemistry 141 (1):259–65. doi: 10.1016/j.foodchem.2013.02.128.
- Liu, D., L. Wang, D.-W. Sun, X.-A. Zeng, J. Qu, and J. Ma. 2014. Lychee variety discrimination by hyperspectral imaging coupled with multivariate classification. Food Analytical Methods 7 (9):1848–57. doi: 10.1007/s12161-014-9826-6.
- Liu, H-l., Y-t Zeng, X. Zhao, and H-r Tong. 2020. Improved geographical origin discrimination for tea using ICP-MS and ICP-OES techniques in combination with chemometric approach. Journal of the Science of Food and Agriculture 100 (8):3507–16. doi: 10.1002/jsfa.10392.
- Liu, J., N. Chen, J. Yang, B. Yang, Z. Ouyang, C. Wu, Y. Yuan, W. Wang, and M. Chen. 2018. An integrated approach combining HPLC, GC/MS, NIRS, and chemometrics for the geographical discrimination and commercial categorization of saffron. Food chemistry 253:284–92. doi: 10.1016/j.foodchem.2018.01.140.
- Liu, K. 1997. Chemistry and nutritional value of soybean components. In K. Liu, Ed., Soybeans: Chemistry, Technology, and Utilization, 25–113. Boston, MA: Springer US.
- Liu, W., C. Liu, F. Chen, J. Yang, and L. Zheng. 2016. Discrimination of transgenic soybean seeds by terahertz spectroscopy. Scientific reports 6 (1):35799. doi: 10.1038/srep35799.
- Liu, W., C. Liu, J. Yu, Y. Zhang, J. Li, Y. Chen, and L. Zheng. 2018. Discrimination of geographical origin of extra virgin olive oils using terahertz spectroscopy combined with chemometrics. Food chemistry 251:86–92. doi: 10.1016/j.foodchem.2018.01.081.
- Liu, W., Y. Zhang, M. Li, D. Han, and W. Liu. 2020. Determination of invert syrup adulterated in acacia honey by terahertz spectroscopy with different spectral features. Journal of the Science of Food and Agriculture 100 (5):1913–21. doi: 10.1002/jsfa.10202.
- Liu, W., Y. Zhang, S. Yang, and D. Han. 2018. Terahertz time-domain attenuated total reflection spectroscopy applied to the rapid discrimination of the botanical origin of honeys. Spectrochimica acta. Part A, Molecular and Biomolecular Spectroscopy 196:123–30. doi: 10.1016/j.saa.2018.02.009.
- Liu, X., B. Bai, K. M. Rogers, D. Wu, Q. Qian, F. Qi, J. Zhou, C. Yao, and W. Song. 2022. Determining the geographical origin and cultivation methods of shanghai special rice using NIR and IRMS. Food chemistry 394:133425. doi: 10.1016/j.foodchem.2022.133425.
- Lu, X., Z. Xia, F. Qu, Z. Zhu, and S. Li. 2020. Identification of authenticity, quality and origin of saffron using hyperspectral imaging and multivariate spectral analysis. Spectroscopy Letters 53 (2):76–85. doi: 10.1080/00387010.2019.1693403.
- Luo, H., J. Zhu, W. Xu, and M. Cui. 2019. Identification of soybean varieties by Terahertz spectroscopy and integrated learning method. Optik 184:177–84. doi: 10.1016/j.ijleo.2019.02.148.
- Luykx, D. M. A. M., and S. M. van Ruth. 2008. An overview of analytical methods for determining the geographical origin of food products. Food Chemistry 107 (2):897–911. doi: 10.1016/j.foodchem.2007.09.038.
- Maestri, D. M., D. O. Labuckas, J. M. Meriles, A. L. Lamarque, J. A. Zygadlo, and C. A. Guzmán. 1998. Seed composition of soybean cultivars evaluated in different environmental regions. Journal of the Science of Food and Agriculture 77 (4):494–8. doi: 10.1002/(SICI)1097-0010(199808)77:4<494::AID-JSFA69>3.0.CO;2-B.
- Mandrile, L., G. Zeppa, A. M. Giovannozzi, and A. M. Rossi. 2016. Controlling protected designation of origin of wine by raman spectroscopy. Food chemistry 211:260–7. doi: 10.1016/j.foodchem.2016.05.011.
- Mannina, L., M. Patumi, N. Proietti, D. Bassi, and A. L. Segre. 2001. Geographical characterization of italian extra virgin olive oils using high-field 1H NMR spectroscopy. Journal of Agricultural and Food Chemistry 49 (6):2687–96. doi: 10.1021/jf001408i.
- Masetti, O., A. Sorbo, and L. Nisini. 2021. NMR tracing of food geographical origin: The impact of seasonality, cultivar and production year on data analysis. Separations 8 (12):230. doi: 10.3390/separations8120230.
- Mathanker, S., K. Paul, R. Weckler, and N. Wang. 2013. Terahertz (THz) applications in food and agriculture: A review. Transactions of the ASABE 56 (3):1213–26. doi: 10.13031/trans.56.9390.
- McComb, K., and R. Frew. 2013. 10 – Using new analytical approaches to verify the origin of honey. In New Analytical Approaches for Verifying the Origin of Food, Woodhead Publishing Series in Food Science, Technology and Nutrition, ed. P. Brereton, 216–42. UK: Woodhead Publishing.
- McMaster, M. C. 2007. HPLC: A practical user’s guide
- Medina, J., D. Caro Rodríguez, V. A. Arana, A. Bernal, P. Esseiva, and J. Wist. 2017. Comparison of attenuated total reflectance mid-infrared, near infrared, and 1H-nuclear magnetic resonance spectroscopies for the determination of coffee’s geographical origin. International journal of Analytical Chemistry 2017:e7210463. doi: 10.1155/2017/7210463.
- Michelfelder, A. J. 2009. Soy: A complete source of protein. American Family Physician 79 (1):43–7.
- Misof, B., P. Roschger, and P. Fratzl. 2011. 3.325 – Imaging mineralized tissues in vertebrates. In P. Ducheyne Ed., Comprehensive Biomaterials, 407–26. Oxford: Elsevier.
- Muccio, Z., and G. P. Jackson. 2009. Isotope ratio mass spectrometry. The Analyst 134 (2):213–22. doi: 10.1039/B808232D.
- Nescatelli, R., R. C. Bonanni, R. Bucci, A. L. Magrì, A. D. Magrì, and F. Marini. 2014. Geographical traceability of extra virgin olive oils from Sabina PDO by chromatographic fingerprinting of the phenolic fraction coupled to chemometrics. Chemometrics and Intelligent Laboratory Systems 139:175–80. doi: 10.1016/j.chemolab.2014.09.012.
- Nguyen-Quang, T., M. Bui-Quang, and M. Truong-Ngoc. 2021. Rapid identification of geographical origin of commercial soybean marketed in Vietnam by ICP-MS. Journal of Analytical Methods in Chemistry 2021:e5583860. doi: 10.1155/2021/5583860.
- Ogrinc, N., I. J. Kosir, M. Kocjancic, and J. Kidric. 2001. Determination of authenticy, regional origin, and vintage of slovenian wines using a combination of IRMS and SNIF-NMR analyses. Journal of Agricultural and Food Chemistry 49 (3):1432–40. doi: 10.1021/jf000911s.
- Oh, H.-J., G-a Ko, M.-Y. Yang, and Y.-J. Kim. 2021. 안정동위원소비를 활용한 고춧가루와 콩의 원산지 판별 분석 [Stable isotope ratio analysis for origin authentication of red pepper powders and soybeans]. Journal of the Korean Society of Food Science and Nutrition 50 (6):570–6. doi: 10.3746/jkfn.2021.50.6.570.
- Okada, Y., S. Suzuki, and S. Hirai. 1987. 機 器中性子放射化分析法 による産地別大豆 中の セ レン含有量 [Determination of Selenium in soybean from different regions by instrumental neutron activation analysis]. Bunseki Kagaku 36 (12):856–61. doi: 10.2116/bunsekikagaku.36.12_856.
- Oliveira, L. F., Soraia, C. G. N. Braga, F. Augusto, J. C. Hashimoto, P. Efraim, and R. J. Poppi. 2016. Differentiation of cocoa nibs from distinct origins using comprehensive two-dimensional gas chromatography and multivariate analysis. Food research International (Ottawa, Ont.) 90:133–8. doi: 10.1016/j.foodres.2016.10.047.
- Ollivier, D., J. Artaud, C. Pinatel, J. P. Durbec, and M. Guérère. 2003. Triacylglycerol and fatty acid compositions of French virgin olive oils. Characterization by chemometrics. Journal of Agricultural and Food Chemistry 51 (19):5723–31. doi: 10.1021/jf034365p.
- Otaka, A., A. Hokura, and I. Nakai. 2014. Determination of trace elements in soybean by X-ray fluorescence analysis and its application to identification of their production areas. Food chemistry 147:318–26. doi: 10.1016/j.foodchem.2013.09.142.
- Palladino, R. A., F. Buckley, R. Prendiville, J. J. Murphy, J. Callan, and D. A. Kenny. 2010. A comparison between Holstein-Friesian and Jersey dairy cows and their F1 hybrid on milk fatty acid composition under grazing conditions. Journal of Dairy Science 93 (5):2176–84. doi: 10.3168/jds.2009-2453.
- Patil, M. R., S. B. Ganorkar, A. S. Patil, and A. A. Shirkhedkar. 2022. Terahertz spectroscopy: encoding the discovery, instrumentation, and applications toward pharmaceutical prospectives. Critical reviews in Analytical Chemistry 52 (2):343–55. doi: 10.1080/10408347.2020.1802219.
- Perez, A. L., B. W. Smith, and K. A. Anderson. 2006. Stable isotope and trace element profiling combined with classification models to differentiate geographic growing origin for three fruits: effects of subregion and variety. Journal of Agricultural and Food Chemistry 54 (13):4506–16. doi: 10.1021/jf0600455.
- Piasentier, E., R. Valusso, F. Camin, and G. Versini. 2003. Stable isotope ratio analysis for authentication of Lamb meat. Meat science 64 (3):239–47. doi: 10.1016/S0309-1740(02)00183-3.
- Portarena, S., O. Gavrichkova, M. Lauteri, and E. Brugnoli. 2014. Authentication and traceability of italian extra-virgin olive oils by means of stable isotopes techniques. Food chemistry 164:12–6. doi: 10.1016/j.foodchem.2014.04.115.
- Potocnik, D., M. Necemer, D. Mazej, R. Jaćimović, and N. Ogrinc. 2016. Multi-elemental composition of Slovenian milk: Analytical approach and geographical origin determination. Acta Imeko 5 (1):15. doi: 10.21014/acta_imeko.v5i1.292.
- Rajapaksha, D., V. Waduge, R. Padilla-Alvarez, M. Kalpage, R. M. N. P. Rathnayake, A. Migliori, R. Frew, S. Abeysinghe, A. Abrahim, and T. Amarakoon. 2017. XRF to support food traceability studies: Classification of Sri Lankan tea based on their region of origin. X-Ray Spectrometry 46 (4):220–4. doi: 10.1002/xrs.2748.
- Raynie, D. 2018. Analyte derivatization as an important tool for sample preparation. LCGC Europe 31 (1):42–5.
- Rho, J.-H., S.-M. Lee, Y.-B. Kim, and T.-S. Lee. 2003. 20 MHz pulsed NMR을 이용한 국내산과 수입산 콩의 판별 [Discriminating domestic soybeans from imported soybeans by 20 MHz pulsed NMR] [text in Korean]. Korean Journal of Food Science and Technology 35 (4):653–9.
- Rinnan, Å., F. v d Berg, and S. B. Engelsen. 2009. Review of the most common pre-processing techniques for near-infrared spectra. TrAC Trends in Analytical Chemistry 28 (10):1201–22. doi: 10.1016/j.trac.2009.07.007.
- Ritchie, H., and M. Roser. 2021. Forests and deforestation. Our World in Data. Published Online at OurWorldInData.org. Retrieved from: https://ourworldindata.org/forests-and-deforestation. Accessed October 23, 2022.
- Rodrigues, C. I., R. Maia, M. Miranda, M. Ribeirinho, J. M. F. Nogueira, and C. Máguas. 2009. Stable isotope analysis for green coffee bean: A possible method for geographic origin discrimination. Journal of Food Composition and Analysis 22 (5):463–71. doi: 10.1016/j.jfca.2008.06.010.
- Rodrigues, C., R. Maia, M. Lauteri, E. Brugnoli, and C. Máguas. 2013. Chapter 4 – Stable isotope analysis. In M. de la Guardia and A. Gonzálvez, Eds., Comprehensive Analytical Chemistry. Food Protected Designation of Origin, Vol. 60, 77–99. UK: Elsevier.
- Rodríguez-Bermúdez, R., M. López-Alonso, M. Miranda, R. Fouz, I. Orjales, and C. Herrero-Latorre. 2018. Chemometric authentication of the organic status of milk on the basis of trace element content. Food chemistry 240:686–93. doi: 10.1016/j.foodchem.2017.08.011.
- Rodrıguez-Delgado, M.-Á., G. González-Hernández, J.-E. Conde-González, and J.-P. Pérez-Trujillo. 2002. Principal component analysis of the polyphenol content in young red wines. Food Chemistry 78 (4):523–32. doi: 10.1016/S0308-8146(02)00206-6.
- Ruoff, K., W. Luginbühl, R. Künzli, M. T. Iglesias, S. Bogdanov, J. O. Bosset, K. von der Ohe, W. von der Ohe, and R. Amadò. 2006. Authentication of the botanical and geographical origin of honey by mid-infrared spectroscopy. Journal of Agricultural and Food Chemistry 54 (18):6873–80. doi: 10.1021/jf060838r.
- Sagratini, G., F. Maggi, G. Caprioli, G. Cristalli, M. Ricciutelli, E. Torregiani, and S. Vittori. 2012. Comparative study of aroma profile and phenolic content of Montepulciano Monovarietal red wines from the Marches and Abruzzo regions of Italy using HS-SPME–GC–MS and HPLC–MS. Food chemistry 132 (3):1592–9. doi: 10.1016/j.foodchem.2011.11.108.
- Sakthivelu, G., M. K. Akitha Devi, P. Giridhar, T. Rajasekaran, G. A. Ravishankar, M. T. Nikolova, G. B. Angelov, R. M. Todorova, and G. P. Kosturkova. 2008. Isoflavone composition, phenol content, and antioxidant activity of soybean seeds from India and Bulgaria. Journal of Agricultural and Food Chemistry 56 (6):2090–5. doi: 10.1021/jf072939a.
- Santato, A., D. Bertoldi, M. Perini, F. Camin, and R. Larcher. 2012. Using elemental profiles and stable isotopes to trace the origin of green coffee beans on the global market. Journal of Mass Spectrometry : JMS 47 (9):1132–40. doi: 10.1002/jms.3018.
- Schmidt, O., J. M. Quilter, B. Bahar, A. P. Moloney, C. M. Scrimgeour, I. S. Begley, and F. J. Monahan. 2005. Inferring the origin and dietary history of beef from C, N and S stable isotope ratio analysis. Food Chemistry 91 (3):545–9. doi: 10.1016/j.foodchem.2004.08.036.
- Sethy, P., S. Pratyush, R. Mishra, and S. Behera. 2015. An introduction to Terahertz technology, its history, properties and application.
- Shen, Y., B. Li, G. Li, C. Lang, H. Wang, J. Zhu, N. Jia, and L. Liu. 2022. Rapid identification of producing area of wheat using terahertz spectroscopy combined with chemometrics. Spectrochimica Acta. Part A, Molecular and Biomolecular Spectroscopy 269:120694. doi: 10.1016/j.saa.2021.120694.
- Singh, G. 2010. The Soybean: Botany, Production and Uses. UK: CABI.
- Stefanoudaki, E., F. Kotsifaki, and A. Koutsaftakis. 1997. The potential of HPLC triglyceride profiles for the classification of cretan olive oils. Food Chemistry 60 (3):425–32. doi: 10.1016/S0308-8146(96)00045-3.
- Sun, Y., Y. Li, L. Pan, A. Abbas, Y. Jiang, and X. Wang. 2021. Authentication of the geographic origin of Yangshan region peaches based on hyperspectral imaging. Postharvest Biology and Technology 171:111320. doi: 10.1016/j.postharvbio.2020.111320.
- Takashima, Y., J. Iguchi, A. Namikoshi, Y. Yamashita, and M. Yamashita. 2014. DNA analysis for identification of species and geographical origins of fishery products. Bunseki Kagaku 63 (10):797–807. doi: 10.2116/bunsekikagaku.63.797.
- Tan, K., Y. Chai, W. Song, and X. Cao. 2014. Identification of soybean seed varieties based on hyperspectral image. Transactions of the Chinese Society of Agricultural Engineering 30 (9):235–42.
- Tangendjaja, B. 2020. Nutrient content of soybean meal from different origins based on near infrared reflectance spectroscopy. Indonesian Journal of Agricultural Science 21 (1):39. doi: 10.21082/ijas.v21n1.2020.p39-47.
- Tapp, H. S., M. Defernez, and E. K. Kemsley. 2003. FTIR spectroscopy and multivariate analysis can distinguish the geographic origin of extra virgin olive oils. Journal of Agricultural and Food Chemistry 51 (21):6110–5. doi: 10.1021/jf030232s.
- Tepavčević, V., M. Atanacković, J. Miladinović, D. Malenčić, J. Popović, and J. Cvejić. 2010. Isoflavone composition, total polyphenolic content, and antioxidant activity in soybeans of different origin. Journal of Medicinal Food 13 (3):657–64. doi: 10.1089/jmf.2009.0050.
- Thomas, R. 2008. An overview of ICP mass spectrometry. In Practical Guide to ICP-MS. Boca Raton, USA: CRC Press.
- Timchenko, Y. V. 2021. Advantages and disadvantages of high-performance liquid chromatography (HPCL). Journal of Environmental Analytical Chemistry 8 (10):335.
- Tomás-Barberán, F. A., F. Ferreres, C. García-Vignera, and F. Tomás-Lorente. 1993. Flavonoids in Honey of Different Geographical Origin. Zeitschrift für Lebensmittel-Untersuchung und -Forschung 196 (1):38–44. doi: 10.1007/BF01192982.
- Tres, A., S. P. Heenan, and S. van Ruth. 2014. Authentication of dried distilled grain with solubles (DDGS) by fatty acid and volatile profiling. Lebensmittel-Wissenschaft + [i.e. und] Technologie. Food Science + Technology. Science + Technologie Alimentaire 59 (1):215–21. doi: 10.1016/j.lwt.2014.05.044.
- Tu, S., Z. Wang, G. Liang, W. Zhang, Y. Tang, Y. She, C. Yi, and X. Bi. 2021. A novel approach to discriminate transgenic soybean seeds based on terahertz spectroscopy. Optik 242:167089. doi: 10.1016/j.ijleo.2021.167089.
- Udvardi, B., I. J. Kovács, T. Fancsik, P. Kónya, M. Bátori, F. Stercel, G. Falus, and Z. Szalai. 2017. Effects of particle size on the attenuated total reflection spectrum of minerals. Applied spectroscopy 71 (6):1157–68. doi: 10.1177/0003702816670914.
- Uríčková, V., and J. Sádecká. 2015. Determination of geographical origin of alcoholic beverages using ultraviolet, visible and infrared spectroscopy: A review. Spectrochimica acta. Part A, Molecular and Biomolecular Spectroscopy 148:131–7. doi: 10.1016/j.saa.2015.03.111.
- USDA. 2023a. Oilseeds and Products Update. Oilseeds and Products. BR2022-0070. Brazil: United States DEpartment of Agricultural.
- USDA. 2023b. Oilseeds: World Markets and Trade. USA: United States Department of Agriculture.
- USDA. 2023c. World Agricultural Production. Foreign Agricultural Service. WAP 1-23. USA: United States Department of Agriculture.
- Valentin, J. L., and R. J. Watling. 2013. Provenance establishment of coffee using solution ICP-MS and ICP-AES. Food chemistry 141 (1):98–104. doi: 10.1016/j.foodchem.2013.02.101.
- Vasconcelos, A., P. Bernasconi, V. Guidotti, V. Silgueiro, A. Valdiones, T. Carvalho, H. Bellfield, and L. F. G. Pinto. 2020. “Illegal deforestation and Brazilian soy exports: The case of Mato Grosso” 15.
- Vázquez, J. F., T. Pérez, F. Ureña, E. Gudín, J. Albornoz, and A. Domínguez. 2004. Practical application of DNA fingerprinting to trace beef. Journal of Food Protection 67 (5):972–9. doi: 10.4315/0362-028x-67.5.972.
- Wadood, S. A., G. Boli, Z. Xiaowen, I. Hussain, and W. Yimin. 2020. Recent development in the application of analytical techniques for the traceability and authenticity of food of plant origin. Microchemical Journal 152:104295. doi: 10.1016/j.microc.2019.104295.
- Wakefield, J., K. McComb, E. Ehtesham, R. Van Hale, D. Barr, J. Hoogewerff, and R. Frew. 2019. Chemical profiling of saffron for authentication of origin. Food Control. 106:106699. doi: 10.1016/j.foodcont.2019.06.025.
- Wan, J., C.-M. Liu, W. Liu, Z.-C. Tu, C. Li, and W.-Q. Zhang. 2010. Determination of mineral elements in soybean from different producing areas by ICP-AES [text in Chinese]. Guang pu Xue yu Guang pu Fen xi = Guang pu 30 (2):543–5.
- Wang, H.-P., P. Chen, J.-W. Dai, D. Liu, J.-Y. Li, Y.-P. Xu, and X.-L. Chu. 2022. Recent advances of chemometric calibration methods in modern spectroscopy: Algorithms, strategy, and related issues. TrAC Trends in Analytical Chemistry 153:116648. doi: 10.1016/j.trac.2022.116648.
- Watzka, M., K. Buchgraber, and W. Wanek. 2006. Natural 15N abundance of plants and soils under different management practices in a Montane grassland. Soil Biology and Biochemistry 38 (7):1564–76. doi: 10.1016/j.soilbio.2005.11.007.
- Wei, X., W. Zheng, S. Zhu, S. Zhou, W. Wu, and Z. Xie. 2020. Application of terahertz spectrum and interval partial least squares method in the identification of genetically modified soybeans. Spectrochimica acta. Part A, Molecular and Biomolecular Spectroscopy 238:118453. doi: 10.1016/j.saa.2020.118453.
- Wei, X., S. Zhu, S. Zhou, W. Zheng, and S. Li. 2020. Identification of soybean origin by Terahertz spectroscopy and chemometrics. IEEE Access. 8:184988–96. doi: 10.1109/ACCESS.2020.3029714.
- Wijewardana, C., K. R. Reddy, and N. Bellaloui. 2019. Soybean seed physiology, quality, and chemical composition under soil moisture stress. Food chemistry 278:92–100. doi: 10.1016/j.foodchem.2018.11.035.
- Wilkes, T., G. Nixon, and M. Burns. 2016. “A review of current and emerging dna-based methodologies for the determination of the geographical point of origin of food stuffs.” 19.
- Wilschefski, S. C., and M. R. Baxter. 2019. Inductively coupled plasma mass spectrometry: introduction to analytical aspects. The Clinical Biochemist. Reviews 40 (3):115–33. doi: 10.33176/AACB-19-00024.
- Wilson, I. D., R. Plumb, J. Granger, H. Major, R. Williams, and E. M. Lenz. 2005. HPLC-MS-based methods for the study of metabonomics. Journal of Chromatography. B, Analytical Technologies in the Biomedical and Life Sciences 817 (1):67–76. doi: 10.1016/j.jchromb.2004.07.045.
- Woolfe, M., and S. Primrose. 2004. Food forensics: Using DNA technology to combat misdescription and fraud. Trends in Biotechnology 22 (5):222–6. doi: 10.1016/j.tibtech.2004.03.010.
- Wu, F., H. Zhao, J. Sun, J. Guo, L. Wu, X. Xue, and W. Cao. 2021. ICP-MS-based ionomics method for discriminating the geographical origin of honey of Apis Cerana Fabricius. Food chemistry 354:129568. doi: 10.1016/j.foodchem.2021.129568.
- Wu, H-j., J-c Deng, C-q Yang, J. Zhang, Q. Zhang, X-c Wang, F. Yang, W-y Yang, and J. Liu. 2017. Metabolite profiling of isoflavones and anthocyanins in black soybean [Glycine Max (L.) Merr.] Seeds by HPLC-MS and geographical differentiation analysis in Southwest China. Analytical Methods 9 (5):792–802. doi: 10.1039/C6AY02970A.
- Wu, Y., D. Luo, H. Dong, J. Wan, H. Luo, Y. Xian, X. Guo, F. Qin, W. Han, L. Wang, et al. 2015. Geographical origin of cereal grains based on element analyser-stable isotope ratio mass spectrometry (EA-SIRMS). Food chemistry 174:553–7. doi: 10.1016/j.foodchem.2014.11.096.
- von Wuthenau, K., T. Segelke, M.-S. Müller, H. Behlok, and M. Fischer. 2022. Food authentication of almonds (Prunus Dulcis Mill.). Origin analysis with inductively coupled plasma mass spectrometry (ICP-MS) and chemometrics. Food Control. 134:108689. doi: 10.1016/j.foodcont.2021.108689.
- Xi-Chun, L. U. 2018. Study on origin identification traceability based on contents of soybean fatty acid content components [Language of text: Chinese]. Food Research and Development 39 (16):55–9.
- Xie, C., Q. Wang, and Y. He. 2014. Identification of different varieties of sesame oil using near-infrared hyperspectral imaging and chemometrics algorithms. PloS one 9 (5):e98522. doi: 10.1371/journal.pone.0098522.
- Yang, C. Q., and W. G. Fateley. 1986. The effect of particle size on peak intensities of FT–IR photoacoustic spectra. Journal of Molecular Structure 141:279–84. doi: 10.1016/0022-2860(86)80334-9.
- Yang, S., C. Li, Y. Mei, W. Liu, R. Liu, W. Chen, D. Han, and K. Xu. 2021. Determination of the geographical origin of coffee beans using terahertz spectroscopy combined with machine learning methods. Frontiers in Nutrition 8:680627. doi: 10.3389/fnut.2021.680627.
- Yao, M., D. Wang, and M. Zhao. 2015. Element analysis based on energy-dispersive X-ray fluorescence. Advances in Materials Science and Engineering 2015:e290593–7. doi: 10.1155/2015/290593.
- Yin, W., C. Zhang, H. Zhu, Y. Zhao, and Y. He. 2017. Application of near-infrared hyperspectral imaging to discriminate different geographical origins of Chinese Wolfberries. PloS one 12 (7):e0180534. doi: 10.1371/journal.pone.0180534.
- Zhang, D.-Y., W.-B. Li. 2009. 黑龙江省大豆籽粒异黄酮含量生态差异[Ecologic Difference of isoflavones content in soybean seeds in Heilongjiang Province]. Acta Agronomica SINICA 35 (4):711–7. 作物学 doi: 10.3724/SP.J.1006.2009.00711.
- Zhang, J., Y. Ge, F. Han, B. Li, S. Yan, J. Sun, and L. Wang. 2014. Isoflavone content of soybean cultivars from maturity group 0 to VI grown in Northern and Southern China. Journal of the American Oil Chemists’ Society 91 (6):1019–28. doi: 10.1007/s11746-014-2440-3.
- Zhao, Y., C. Zhang, S. Zhu, P. Gao, L. Feng, and Y. He. 2018. Non-destructive and rapid variety discrimination and visualization of single grape seed using near-infrared hyperspectral imaging technique and multivariate analysis. Molecules 23 (6):1352. doi: 10.3390/molecules23061352.
- Zhou, X., M. Taylor, H. Salouros, and S. Prasad. 2018. Authenticity and geographic origin of global honeys determined using carbon isotope ratios and trace elements. Scientific Reports 8:14639. doi: 10.1038/s41598-018-32764-w.
- Zhou, Y., S.-Y. Kim, J.-S. Lee, B.-K. Shin, J.-A. Seo, Y.-S. Kim, D.-Y. Lee, and H.-K. Choi. 2021. Discrimination of the geographical origin of soybeans using NMR-based metabolomics. Foods 10 (2):435. doi: 10.3390/foods10020435.
- Zhu, L., J. Sun, G. Wu, Y. Wang, H. Zhang, L. Wang, H. Qian, and X. Qi. 2018. Identification of rice varieties and determination of their geographical origin in China using Raman spectroscopy. Journal of Cereal Science 82:175–82. doi: 10.1016/j.jcs.2018.06.010.
- Zhu, S., J. Zhang, M. Chao, X. Xu, P. Song, J. Zhang, and Z. Huang. 2020. A rapid and highly efficient method for the identification of soybean seed varieties: Hyperspectral images combined with transfer learning. Molecules 25 (1):152. doi: 10.3390/molecules25010152.