
ABSTRACT
In vivo skin sensitization assays have to be provided by applicants to the competent authorities in the European Union for the approval of active substances (AS) in pesticides. This study aimed to test the practicability of in silico predictions for AS by freely available (Q)SAR tools to evaluate their use as a time- and cost-effective alternative to animal testing in the context of the 3R concept. Predictions of skin sensitization for 48 selected sensitizing and non-sensitizing AS by the software programs CAESAR, Toxtree, OECD (Q)SAR Toolbox, CASE Ultra, Leadscope and SciQSAR were collected and compared. Different data evaluation methodologies (score definition, mean, weighted mean, threshold score definition) were applied to optimize the predictions. The calculation methods were internally cross-validated and further validated with an additional validation set of 80 AS. Although the presented calculation methodologies are not suitable as a stand-alone method, this study has shown weaknesses and strengths of some prominent (Q)SAR programs and diverse combinatorial options in the prediction of skin sensitization by pesticidal AS. The present study will help to foster discussions on in silico alternatives to animal testing in the pesticide area.
Introduction
Allergic contact dermatitis (ACD) is a type IV hypersensitivity reaction caused by contact of chemicals or haptens with the human skin. The equivalent experimental model in rodents is called contact hypersensitivity (CHS). Skin sensitization is the term that denotes the regulatory hazard of ACD and is composed of two phases: induction and elicitation [Citation1]. Induction of skin sensitization can be divided into several key events (KE) according to the Adverse Outcome Pathway (AOP) concept by the OECD: At first the chemical gets in contact with the skin. A molecular weight limit of 500 Da for penetration of the skin has long been believed [Citation2], but more recently it has been shown that sensitizing chemicals with higher molecular weights exist [Citation3]. Inside the skin the chemicals might react with proteins (KE1). However, this is not a mandatory requirement [Citation4]. The actual allergen that is not necessarily identical to the sensitizing chemical interacts with keratinocytes, epidermal Langerhans cells and dermal dendritic cells. Upon exposure, keratinocytes produce danger signals (KE2) that help dendritic cells (DCs) to become activated (KE3). Activated DCs then migrate to the local lymph nodes, where they encounter naïve T lymphocytes (T-cells). On their cell surface DCs present the allergen on major histocompatibility complex proteins to T-cells which are thereby activated (KE4) and differentiate into specific sub-populations. Primed T-cells migrate back to the skin by the help of imprinted homing receptors. In the course of a second encounter with the sensitizing chemical, adverse reactions are elicited. The specific cytotoxic T-cells lead to skin inflammation and the actual clinical symptoms known as ACD.
ACD affects ~ 20% of the North American and Western European population [Citation5] and is a major occupational disease [Citation6] with increasing trend. ACD is a well-known problem for farmers and rural society that come into contact with chemicals in the form of pesticides routinely [Citation7,Citation8]. Chlorothalonil [Citation9,Citation10] or fluazinam [Citation11] – only to name a few – are pesticidal active substances (AS) which might lead to ACD in exposed workers. To protect farmers and rural society, legal requirements dictate that skin sensitization of pesticides must be investigated by the applicants and assessed by competent authorities prior to market approval.
Pesticides are usually composed of different ingredients, including the AS, that mediate the specific biological activity towards the plant or harmful organism, e.g. as herbicide. In the European Union, the approval of AS is regulated by the Regulation (EC) No 1107/2009 [Citation12]. If approval for the AS is granted, the pesticide as a whole might be authorized in the respective EU member states. In Germany, it is the German Federal Institute for Risk Assessment (BfR) that assesses the health risks of pesticides for humans. To do so, the BfR is provided with necessary data by the applicants who have to submit appropriate dossiers. The mandatory data is laid down in the Commission Regulation (EU) No 283/2013 [Citation13] comprising amongst others a number of toxicological endpoints which have to be tested by means of animal experiments. For pesticidal AS, in vivo assays according to OECD Test Guidelines 406 and 429 (Bühler test, Guinea pig maximization test (GPMT) and Local lymph node assay (LLNA)) are usually accepted for assessment of skin sensitization. For details on the experimental set-up of these tests, please refer to the original OECD Test Guidelines [Citation14,Citation15].
For cosmetic purposes, animal testing for skin sensitization is already banned and a general marketing ban for cosmetic products has existed since 2013 [Citation16]. Efforts to reduce animal testing are also undertaken in the pesticide area, as well as for chemicals regulated under REACH such as substances alone or as components of mixtures and released ingredients of a product. In the scope of the 3R concept [Citation17], it is favourable to replace, reduce, or refine animal testing. Possible alternatives comprise – amongst others – in silico methods such as (Q)SAR ((Quantitative) structure activity relationship) which are especially convenient because of the time and cost effectiveness compared to in vivo or in vitro assays. (Q)SAR models are based upon complex algorithms that correlate a chemical structure or structural features with a physicochemical property or biological activity. Algorithms can be mathematical equations or knowledge-based rules [Citation18]. To develop such algorithms, a training data set consisting of chemicals with known properties/activities is used.
The (Q)SAR programs used in the present study span the prominent freely available software with the skin sensitization prediction ability: VEGA (Virtual models for property Evaluation of chemicals within a Global Architecture) with incorporated CAESAR (Computer Assisted Evaluation of Industrial Chemical Substances According to Regulations) 2.1.6 [Citation19], Danish (Q)SAR Database with predictions of CASE Ultra, Leadscope and SciQSAR [Citation20], Toxtree 2.6.13 [Citation21] and OECD (Q)SAR Toolbox 3.4 [Citation22]. The above-mentioned (Q)SAR programs were originally used to assess general chemicals, pharmaceuticals and cosmetics [Citation23–Citation25] so that training sets consist mainly of such substances. As the assessment of skin sensitization is an important issue in pesticide approval, we wanted to test to what extent (Q)SAR programs are suitable to predict skin sensitization of pesticidal AS. In this study, the predictivity of seven different (Q)SAR models in six freely available (Q)SAR programs (one model in each program and two in the OECD (Q)SAR Toolbox) was assessed with a test set of 48 AS. Predictions were optimized by diverse strategies (transformation of results in uniform scores, mean formation, weighted mean formation, usage of a score threshold). The best calculation method concerning PPV included weighted mean formation of scores from six models/five programs and threshold usage and was 8-fold cross-validated and it could be shown by 8-fold cross-validation that the relative and absolute outcome of the calculation steps are not dependent on single AS, but represent the whole test set. Furthermore, the calculation methods were applied to a balanced set of 80 additional AS for validation purposes.
Materials and methods
Selection of chemicals
AS of pesticides with known sensitizing potential (sensitizing or non-sensitizing) were chosen for evaluation of different (Q)SAR models. The Federal Institute for Risk Assessment is involved in the approval process of AS in pesticides. This way, the authors had access to an internal database on skin sensitization. Available in vivo data (Buehler, GPMT and LLNA) of approved AS were screened according to defined quality criteria (Supplementary Table S1). A balanced set of 24 sensitizing and 24 non-sensitizing AS with a respective data background was selected (Supplementary Table S2). According to the above-mentioned criteria (Supplementary Table S1) the validation data set was selected, subjected to the same quality criteria as the training set and consisted of an additional 40 sensitizing and 40 non-sensitizing AS (Supplementary Table S3). Each sensitizing AS is classified as sensitizing by the EFSA or by ECHA (European Chemicals Agency) according to the Harmonized Classification and Labelling. The non-sensitizing AS are all classified as non-sensitizing by the EFSA. The selected AS were not part of the training datasets of Toxtree and CAESAR [Citation26]. As the models from the Danish (Q)SAR Database are commercial, the training data set is not provided in the downloaded (Q)SAR reports. The training sets of OECD (Q)SAR Toolbox protein reactivity tools as rule-based systems are not known [Citation27] and not accessible. Therefore, no statement can be made about possible inclusion of individual AS in the training sets of the latter (Q)SAR models.
Characterization of active substances
The tool ‘Organic Functional Groups’ inside the OECD (Q)SAR Toolbox was used for chemical characterization of AS. The tool recognizes 506 different structural elements.
(Q)SAR programs
All freely available (Q)SAR programs used for this evaluation were listed for skin sensitization prediction in a recently published guidance document by the European Chemicals Agency [Citation28].
VEGA
The VEGA platform (Virtual models for property Evaluation of chemicals within a Global Architecture) version 2.1.6 provides access to different (Q)SAR programs and their models. Among these, there is the CAESAR (Computer Assisted Evaluation of Industrial Chemical Substances According to Regulations) software with a statistical model for skin sensitization [Citation29]. Chemicals are entered as SMILES-code (Simplified Molecular Input Line Entry Specification) and the prediction result can be output as an Excel-readable txt file. The model differentiates between ‘sensitizer’ and ‘non-sensitizer’. Additionally, a reliability statement by an independent model, ranging from ‘low’ over ‘moderate’ to ‘good’, is included in the results.
Danish (Q)SAR database
The Danish (Q)SAR Database (DQD) version 2017 by the Technical University of Denmark is an online accessible repository of predictions for ~ 600,000 chemicals. The predictions are derived from the programs CASE Ultra 1.4.6.6 64‐bit, Leadscope version 3.1.1‐10 and SciQSAR version 3.1.00 which provide models for different endpoints including skin sensitization. The predictions are abbreviated and do not contain the full information originally provided by the systems. Skin sensitization is predicted as ‘POS’ (positive for skin sensitization), ‘NEG’ (negative for skin sensitization) or ‘INC’ (inconclusive). Additionally, information about the applicability domain is given in the form of an ‘IN’ (inside applicability domain) or ‘OUT’ (outside applicability domain). Predictions outside the applicability domain are not necessarily incorrect and those inside not necessarily correct. This simply provides information about whether the target compound is sufficiently similar to the training set in relevant descriptors. In addition, the DQD provides an overall Battery prediction for each endpoint integrating the predictions of the three single programs. For details on the Battery algorithm, please refer to the original DQD manual [Citation30].
Toxtree
Toxtree [Citation31] v2.6.13 is a rule-based expert system containing model ‘skin sensitization reactivity domains’ to predict five electrophilic reactivity alerts: SNAr electrophiles, Schiff base formers, Michael acceptors, acylating agents, and SN2 electrophiles.
OECD (Q)SAR toolbox
The OECD (Q)SAR toolbox (QTB) is a software application with statistic-based models in the form of tools. Concerning skin sensitization, four tools are most relevant: ‘Protein binding by OASIS v1.4’; ‘Protein binding by OECD v2.3’; ‘Protein binding potency v2.4’; and ‘Protein binding alerts for skin sensitization by OASIS v1.4’. These were used in combination as they all predict the reactivity towards proteins and are referred to as a ‘QTB, reactivity’ model predicting ‘QTB-alerts’. A ‘QTB-alert’ results from one alerting tool independent of the number of alerts, so that an AS can maximally provoke four QTB-alerts (one from each tool).
The QTB also offers the possibility to perform a read-across approach. A target chemical can be profiled by different tools the user can select freely. Groups of chemicals similar to the target in freely chosen properties can then be created. Different groups can be combined with a logical ‘and’ or ‘or’. For skin sensitization and other endpoints, experimental data can be retrieved for the target and/or similar chemicals. We defined a strict way of performing a ‘manual’ read-across: Based on the predicted skin sensitization-related properties by the above-mentioned QTB tools, as well as based on the predicted chemical properties by the tool ‘US EPA New Chemical Categories v2.0’, groups were defined and screened manually for very or partially similar chemicals. ‘Very similar’ was defined with a maximum of one and ‘partially similar’ with a maximum of three differing functional groups between the target and read-across chemicals. The experimental endpoint value for the similar chemicals was assigned to the target as a qualitative result (positive/negative). This procedure is referred to as the ‘QTB, read-across’ model in the following.
Calculations
For each individual AS the score mean of all models (1: CASE Ultra; 2: Leadscope; 3: SciQSAR; 4: CAESAR; 5: Toxtree; 6: QTB, reactivity; 7: QTB, read-across) was calculated according to equation (1). Assignment of scores to the individual output of each model is described in the results section.
Equation (2) shows the calculation for the score mean of all models without one exemplarily for the case of leaving out CASE Ultra.
The weighted score means (WSM) for each individual AS were calculated according to equation (3). For each AS, the weighting factors indexed 1–7 were used for the score of the respective programs 1–7. Assignment of weighting factors to the individual scores of each model is described in the results section.
Equation (4) shows the calculation for the WSM of all models without one exemplarily for the case of leaving out CASE Ultra.
The positive and negative predictive values (PPV and NPV) were calculated according to equations (5) and (6), respectively.
The sensitivity, specificity and accuracy values were calculated according to equations (7), (8) and (9), respectively.
It should be noted that all these performance measures depend on the actual prevalence. Here, they are always given for the artificial prevalence of 50% in the test and validation set.
Statistical analysis and cross-validation
For comparison of score values between sensitizing and non-sensitizing AS, statistical analysis was performed with SigmaPlot 13 version 1. The non-parametric Mann-Whitney U-test was applied. For this purpose, normal distribution was checked and rejected with the Shapiro-Wilk test. Differences between scores of sensitizing and non-sensitizing AS were considered significant when p ≤ 0.05.
Data shown in box plots comprise the following: continuous lines represent median values, dotted lines represent mean values; the bottom and top of the boxes are the 25th and 75th percentiles; the whiskers below and above are the 10th and 90th percentiles. Outliers are shown as small circles above and below the whiskers.
An 8-fold cross-validation was performed to check whether the quality of the prediction with single models and with the different calculation methods was dependent on a few individual substances. Therefore, the dataset of 48 AS was randomly divided into eight sub-sets, each containing the same number of sensitizing and non-sensitizing AS. All calculation steps performed with the whole dataset were repeated with the eight cross-validation-datasets that consisted of the whole set diminished by one of the eight parts, respectively. Mean and standard deviation over all eight cross-validation datasets were calculated.
Results
For description of the predictions, the following terminology will be used: The terms ‘positive’ and ‘negative’ describe skin sensitization properties that were predicted by
(Q)SAR programs, while the terms ‘sensitizing’ and ‘non-sensitizing’ describe properties that were found in animal experiments.
Selection and characterization of active substances
Forty-eight AS (Supplementary Table S2) of pesticides whose in vivo skin sensitization data fitted defined criteria (Supplementary Table S1) were selected for the initial evaluation of (Q)SAR programs. For the validation set (Supplementary Table S3) the selection of an additional 40 sensitizing and 40 non-sensitizing AS was based on classification by EFSA and/or by ECHA according to the Harmonized Classification and Labelling. To identify possible differences in the chemical structure between sensitizing and non-sensitizing AS, chemical characteristics of all AS were identified by the OECD QTB ‘Organic functional groups’ that are able to recognize 506 different structural elements. Ninety-one different organic groups were recognized among the test set and 107 among the validation set. Sixty-seven functional groups were shared between the test and validation set.
The frequency of occurrence of each of the organic groups present in sensitizing and non-sensitizing AS of the two sets was inspected. However, no remarkable differences were identified.
Performance of individual programs
Programs from the Danish (Q)SAR database
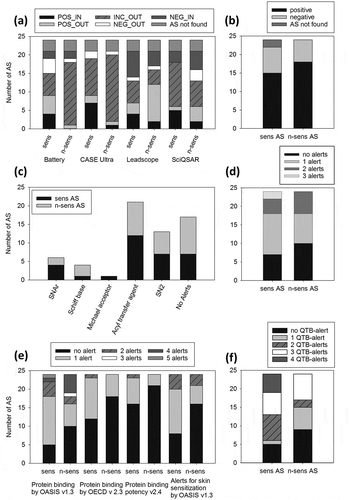
The Danish (Q)SAR database (DQD) comprises three programs: CASE Ultra, Leadscope and SciQSAR. DQD predictions from these programs were downloaded for 42 out of 48 AS, whereas for three sensitizing (Mancozeb, Maneb, Fluazinam) and three non-sensitizing AS (Fenpyrazamine, Fluopyram, Fluxapyroxad) (Q)SAR data were not available from the database (). There were more sensitizing than non-sensitizing AS categorized as POS_IN (predicted sensitizer, inside applicability domain) with all three programs and the Battery prediction. This picture remained unchanged for CASE Ultra and the Battery prediction, when also the POS_OUT (predicted sensitizer, outside applicability domain) predictions were considered, whereas for Leadscope more non-sensitizing than sensitizing AS were predicted positive. Leadscope was also the only program that classified more sensitizing than non-sensitizing AS as NEG_IN, which means more false-negatives than true-negatives. The Battery prediction generated an equal number of NEG_IN-predictions for sensitizing and non-sensitizing AS. CASE Ultra failed to provide any NEG_IN predictions. Only SciQSAR provided two more NEG_IN-predictions for non-sensitizing than sensitizing AS. In combination with the NEG_OUT-predictions SciQSAR performed best among the three programs CASE Ultra, Leadscope and SciQSAR concerning the number of true-negatives. Generally, the number of inconclusively predicted AS was very high (28 with CASE Ultra, 10 with Leadscope, 19 with SciQSAR, 23 with Battery prediction). As the Battery prediction was not superior to the three single programs, it was not included into the later combination of programs.
Figure 1. Predictions of skin sensitization by individual (Q)SAR models for 24 sensitizing and 24 non-sensitizing AS. (a) Via the Danish (Q)SAR database predictions of three different (Q)SAR models were available together with a Battery prediction combining the three individual predictions. CAS numbers of six AS were not found by the software. (b) CAESAR predictions available via the VEGA software are shown. CAS numbers of two AS were not found by the program. Scores are defined in Supplementary Table S4. The individual scores for sensitizers and non-sensitizers are listed in Supplementary Table S5. (c, d) Toxtree predicts five different chemical reactivities (alerts) related to protein binding in the skin sensitization process. The number of sensitizing or non-sensitizing AS provoking the respective alert (c) and the number of alerts that was provoked by sensitizing or non-sensitizing AS (d) are shown. (e) The number of alerts of four different tools inside the (Q)SAR Toolbox (QTB) is shown that were provoked by sensitizing or non-sensitizing AS. (f) The individual alerts of the four QTB tools were merged into one QTB alert parameter. Accordingly for one AS four alerts were maximally possible (one from each of four tools). The number of QTB-alerts provoked by sensitizing or non-sensitizing AS is shown. Sens = sensitizing; n-sens = non-sensitizing. POS/NEG/INC = positive/negative/inconclusive prediction; IN/OUT = inside/outside of the respective applicability domain.
CAESAR
The output of the CAESAR skin sensitization model was a simple statement, whether the substance was a ‘sensitizer’ or a ‘non-sensitizer’. Additionally, information about the degree of reliability was provided, stated as ‘low’, ‘moderate’ or ‘good’. Two out of 24 sensitizing AS (Mancozeb and Maneb) could not be predicted because the SMILES code could not be recognized by the software, probably due to the complexation with manganese and zinc ions. For the remaining AS, the number of positive and negative predictions did not clearly differ between sensitizing and non-sensitizing AS. There were even more non-sensitizing than sensitizing AS that were predicted as positive ().
Toxtree
The Toxtree skin sensitization model does not provide a prediction as direct as the aforementioned programs with their models: Instead, electrophilic protein reactivity alerts (SNAr electrophiles, Schiff base formers, Michael acceptors, acylating agents and SN2 electrophiles) are predicted () that are assumed to correlate with KE1 in the skin sensitization process (covalent interaction with proteins). Four out of the five reaction types were predicted to a similar extent for sensitizing and non-sensitizing AS (), with slightly more sensitizers yielding SNAr electrophile alerts and more non-sensitizers being Schiff base formers. Only sensitizing AS were Michael acceptors. The number of alerts distinguished sensitizing from non-sensitizing AS slightly better (). The maximum observed number of alerts (three) was only reached by two sensitizing AS (Fluxapyroxad and Carfentrazone-ethyl). Further, there were more non-sensitizing AS eliciting no alert.
OECD (Q)SAR toolbox
Four tools from the QTB predict protein reactivity similar to Toxtree, but with a far broader range of mechanistic domains. The maximum observed number of alerts with all tools was five, but most AS elicited no or one alert (). Only with the tool ‘Protein binding by OASIS v1.3’ some AS provoked more than two alerts. The maximally observed number of five alerts was provoked by one sensitizing AS, Tribenuron-methyl. However, four alerts were provoked by more non-sensitizing AS than by sensitizing AS. Similar to the Toxtree model, the QTB tools did not distinguish sensitizing from non-sensitizing AS by the number of alerts. It was tested whether the integration of the individual alerts by the four different tools into one merged QTB alert parameter would improve the correlation between predictions and experimentally determined skin sensitization. For this purpose, one or more alerts by one tool were counted as one QTB-alert. This way an AS could elicit a maximum of four QTB-alerts (one from each tool). Indeed, the highest number of QTB-alerts was only provoked by sensitizing, but not by non-sensitizing AS (). The concept of QTB-alerts was later used in the combination of models. By using QTB it is also possible to perform read-across approaches with defined groups of chemicals which are similar to the target chemical (e.g. the same alert by ‘Protein binding by OASIS v1.3’). However, by this approach similar substances were found for only eight of the 48 substances.
For eight AS very and partially similar chemicals were found inside the created groups () which were all true-positives. However, non-sensitizing AS in the test set could not be predicted by that approach.
Table 1. Active substances (AS) and the similar chemicals found in the OECD (Q)SAR Toolbox by category definition.
Score definition
For comparison of all models, the individual output of each was translated into a uniform score system ranging from 1 (positive) over 0 (inconclusive) to –1 (negative) (Supplementary Table S4), similarly to previous studies [Citation32,Citation33]. Thereby, the sign indicates a sensitizing or non-sensitizing potential. Attention should be paid to the interpretation of the score value: the score value represents the predicted general probability of an AS to be sensitizing, not its sensitization potential.
As the practicability of the models should be assessed, the inability of certain models to generate predictions as a consequence of not recognizing CAS numbers or SMILES codes was counted as an inconclusive prediction (score = 0). Non-recognition might also be due to the way SMILES are written or the presence of salts (not managed in almost all QSAR systems). The four different tools of the QTB were used in combined form, because the combination allowed a clearer prediction for sensitizing AS (see above). Further, the predictions of the models that predicted protein reactivity, but not directly skin sensitization (Toxtree and QTB protein reactivity) were set to achieve the score 1 with the maximal amount of protein reactivity alerts and the score –1 with no alerts. Any further score incrementing might not be meaningful, due to the fact that protein reactivity does not necessarily lead to skin sensitization.
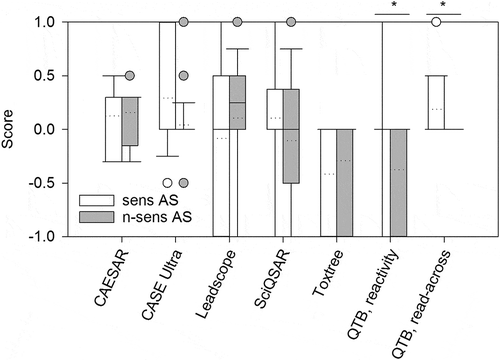
The introduction of scores enabled statistical testing, whether the predictions of sensitizing AS differed significantly from those of non-sensitizing AS ( ; scores for each AS can be found in Supplementary Table S5). Significant differences were only observed with ‘QTB, reactivity’ and ‘QTB, read-across’. However, with ‘QTB, reactivity’ the scores of sensitizing AS were homogenously distributed from –1 to 1, so that positive predictions for sensitizing AS cannot be considered certain. The approach ‘QTB, read-across’ did not yield any predictions for non-sensitizing AS. As the statistical significance was not found to be a measure for good predictivity, it was not the main focus for optimizing predictive performance.
Figure 2. Comparison of score values from sensitizing and non-sensitizing AS derived of different (Q)SAR predictions. The dotted line denotes the mean of the score values, respectively. Sens = sensitizing; n-sens = non-sensitizing. * p ≤ 0.05.
Combination of models by mean
The mean value of all scores by the different models was calculated for each AS to test whether the combination of all models would result in more robust and clear predictions. Further, the mean value with all models without one was determined to exclude that predictions of one program would have a special impact. On average, the score mean calculations yielded higher numbers of true-positives and -negatives () compared to the individual models. Only the program CAESAR yielded more true-positives, but at the same time also less true-negatives. The score means without one showed that there was no individual model that was considerably more favorable to predict skin sensitization than the other models (). Generally, the most striking difference between individual and combined programs is the accuracy that is nearly doubled (). The score mean without Leadscope, for example, reached an accuracy of 60%. Additionally, the averaged sensitivity and specificity of the mean calculations was 49% and 59%, while for the individual programs it was only 30% and 21%, respectively (not shown). However, the PPV and NPV are decreased compared to some individual programs (). In general, performance measures such as sensitivity, specificity, etc. () have to be interpreted with care in the present context: for instance, a PPV of 100% may result from less than 10 predictions (e.g. QTB, reactivity: 5 predictions; QTB, read-across: 8 predictions) and is very probably combined with very low values in other categories (accuracy, etc.). Besides, these performance measures were originally intended to describe binary classification systems predicting only ‘positive’ and ‘negative’. Here they are used to describe a ternary classification system that additionally includes ‘inconclusive’ predictions.
Table 2. Number of true and false predictions as well as some characteristic numbers of the individual models and the different combinations are shown. The number of sensitizing AS with scores > 0 (true-positive), < 0 (false-negative) and of non-sensitizing AS with scores < 0 (true-negatives), > 0 (false-positive) are shown.
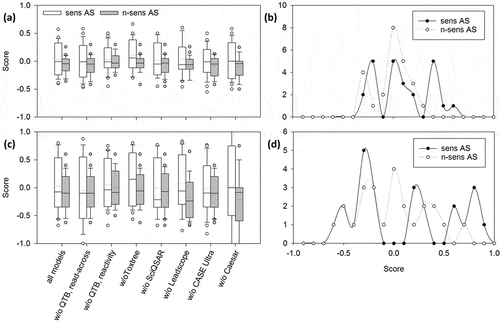
Figure 3. Comparison of score means and weighted score means. (a and c) For each AS the (weighted) mean of the score values of all (Q)SAR models or all minus one was calculated. Dotted lines denote the mean of the score values for all sensitizing or non-sensitizing AS, respectively. (b and d) Distribution of (weighted) score mean values from sensitizing and non-sensitizing AS is shown. Sens = sensitizing; n-sens = non-sensitizing. * p ≤ 0.05.
A dual combination of the programs CAESAR and CASE Ultra and a ternary combination of CEASAR, CASE Ultra, and ‘QTB, read-across’ was calculated as well (data not shown). These programs were selected because of their comparatively high sensitivity. However, these combinations could not exceed the specificity or accuracy of combinations of all programs and all without one. As the combination of six or seven models is expected to be more robust, this approach was pursued for performance optimization.
The prediction of non-sensitizing AS with all score mean variants was better compared to those of sensitizing AS, because ~ 50% (marked by the boxes in the box plots in ) of AS had a score value of < 0 (i.e. showed a tendency for negative prediction), while half of the sensitizing AS had predictions with score values ~ 0 (i.e. no clear tendency for positive prediction). The distribution of score values () showed that the clear predictions of a few models for certain AS were counteracted by inconclusive predictions of other models when the mean was calculated. This way, most of the mean score values for all AS ranged around 0. The few clear predictions were not limited to an individual program, as can be seen when leaving out one system: the differences between the mean and the ‘mean without one’ calculations were not remarkable ().
Combination of models by weighted mean
To combine the conclusive predictions of all models for each AS, weighting factors for the scores of each program were applied, followed by subsequent calculation of the mean of the weighted individual scores. Weighting factors different from the default weighting of 1 were applied under certain conditions: a weighting factor of 0 was assigned to a score of 0 so that all inconclusive predictions were excluded. In case an AS was scored with the value 0 by all models, the weighting factor was set to 1 because otherwise no mean could be calculated.
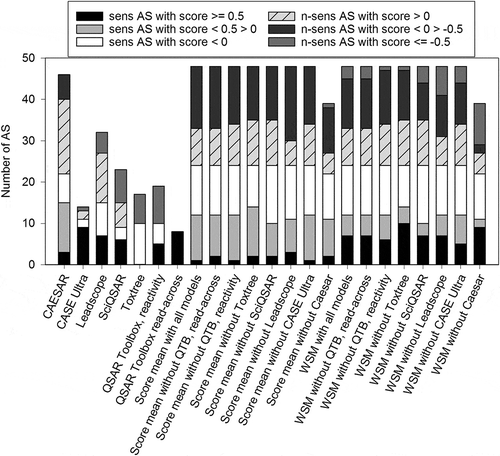
By applying weighting factors, it was possible to yield higher scores for sensitizing AS and lower scores for non-sensitizing AS ( and ) compared to the mean without weighting ( and ). Although the weighting did not result in a change in the numbers of true and false predictions as compared to the simple mean calculation, a difference was clearly visible: The number of AS with predictions that provided a clear and correct statement (sensitizing AS with score values ≥ 0.5 and non-sensitizing AS with score values ≤ –0.5) () was higher with the weighting than without. Mean with all models resulted in one sensitizing AS with a score ≥ 0.5 and no non-sensitizing AS with a score ≤ 0.5, while the weighted mean with all models resulted in nine sensitizing AS with scores ≥ 0.5 and two non-sensitizing AS with a score ≤ 0.5. Nonetheless, there were still a considerable number of false predictions (total of 21; sensitizing AS with scores < 0 and non-sensitizing AS with scores > 0) ( and ).
Figure 4. Comparison of the prediction quality of the individual models, of the mean values and the weighted mean values (WSM). Sensitizing AS with scores ≥ 0.5 and non-sensitizing AS with scores ≤ –0.5 are considered clearly correctly predicted. Sensitizing AS with scores < 0.5 > 0 and non-sensitizing AS with scores < 0 > –0.5 are considered correctly predicted. Sensitizing AS with scores < 0 and non-sensitizing AS with scores > 0 are considered false-negatives and false-positives, respectively. Mean and weighted mean were calculated by using the scores of all models for each AS and by excluding scores of one program at a time. Sens = sensitizing; n-sens = non-sensitizing.
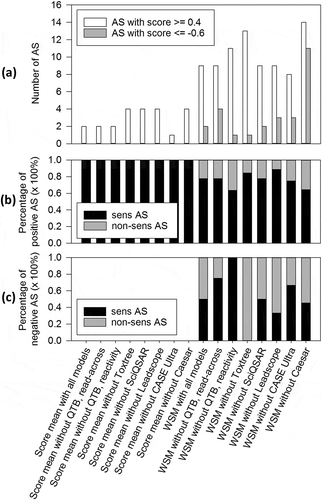
Performance of threshold value application
To reduce the number of false predictions and improve the PPV, threshold scores were set. Positive and negative thresholds were determined. These are set score values above or below which a prediction can be considered as truly positive or negative with a high probability, respectively. A positive threshold score of 0.4 and a negative threshold score of –0.6 provided the best results. When applying these threshold definitions, the thresholded weighted score means (WSM) had much improved PPV, but at the expense of the total number of true predictions (accuracy) compared to non-thresholded WSM, which is also reflected in sensitivity and specificity (). With 27%, the thresholded WSM without Toxtree yielded the second highest percentage of positive predictions scored ≥ 0.4 (), of which 85% were true-positives () (for comparison please refer to the PPV values presented in ). Using the same mean calculation, only 2.1% of all AS were predicted as negative (). That is only a small percentage compared to the possible 50% and corresponds to only one AS, but this prediction was true-negative (). The thresholded WSM without CEASAR resulted in higher numbers of negative predictions with better specificity, but the positive predictions were less certain, with a PPV of only 64% (). Although WSM without Leadscope yielded the highest PPV with 89%, accuracy and NPV of WSM without Toxtree is higher. Therefore, the latter calculation method is considered as the ‘best’.
Figure 5. Comparison of prediction quality of score mean and WSM values by applying threshold scores. Threshold scores defining a certain score above or below a prediction are considered positive (≥ 0.4) or negative (≤ –0.6). (a) The percentages of AS with positive or negative predictions according to thresholds are shown. (b) The percentage of true- and false-positives of all positive predictions is shown. (c) The percentage of true- and false-negatives of all negative predictions is shown. Sens = sensitizing; n-sens = non-sensitizing.
Internal validation
To prove that the relative (values such as PPV, NPV, etc. of one calculation method in relation to individual programs/other calculations) and absolute (absolute values such as PPV, NPV, etc.) results of the different calculation variants were not dependent on some few AS, an 8-fold cross-validation was performed. For this purpose, the dataset of 48 AS was randomly divided into eight sub-sets of six substances. All sub-sets contained an equal number of sensitizing and non-sensitizing AS. All mean values and WSM values were calculated with each individual dataset, and the thresholds were applied as defined above. The resulting standard deviations were small (< 20% of the mean values) so that it can be assumed that the results represent the whole dataset and not only some individual AS (Supplementary Figure S1). The calculation of the thresholded WSM without Toxtree still achieved the most true-positive predictions when applying the positive threshold of 0.4 (Supplementary Figures S1A and B). Among the WSM calculation methods, this method was also the one that allowed the fewest false-positive and -negative predictions (non-sensitizing AS with scores ≥ 0.4 and sensitizing AS with scores ≤ –0.6).
External validation
An external validation was performed with an independent set of 80 AS (Supplementary Table S6). Results are presented in Supplementary Figure S2 and Table S7 (cp. with for the results from the different sets of AS). The performance of the individual models CASE Ultra and ‘QTB, reactivity’ was slightly different compared to the test set: for the validation set CASE Ultra predicted fewer sensitizing AS as positive within the application domain, as compared to non-sensitizing AS. Nonetheless, the total of positive predictions (within and outside the application domain) was still higher for sensitizing AS. Furthermore, there were less sensitizing AS, with four QTB-alerts in the validation set than in the test set. This way, the calculation of mean and WSM with threshold application yielded not exactly the same absolute results with the test and validation set (Supplementary Figure S3). Nonetheless, using the threshold application WSM without Toxtree led to the best prediction concerning PPV and NPV of 60% and 86% (Supplementary Table S7), respectively.
Discussion
The present study was aimed at the evaluation of the suitability of six freely available (Q)SAR programs/seven (Q)SAR models (one from each program, but two from the program QTB) to predict skin sensitization caused by AS in pesticides.
Discussion on the feasibility of (Q)SAR programs
Skin sensitization is a very complex endpoint involving the formation of, in most cases, an unknown allergen and a cascade of highly specific interactions. Therefore, it may be too simple to correlate individual functional groups or small structural elements with skin sensitization. Concordantly, an analysis of functional groups in the AS performed in the present study did not reveal remarkable differences between sensitizing and non-sensitizing AS. Two programs – namely Toxtree and QTB – predict skin sensitization indirectly in the form of protein reactivity alerts. These protein reactivity alerts aim to correlate directly with skin sensitization as the training data set consists of LLNA data, at least in the case of Toxtree [Citation26,Citation31]. In the case of QTB, the protein reactivity tools used are directly recommended as relevant to skin sensitization by the OECD [Citation34]. Protein reactivity follows skin penetration in the skin sensitization process and, therefore, tends to correlate with the in vivo measurable endpoint contact hypersensitivity. However, as there are also chemicals that are reactive towards proteins and do not elicit skin sensitization, it is generally difficult to deduce skin sensitization potential directly from protein reactivity. The reactive chemistry as an absolute requirement for skin sensitization elicitation is doubted by experts [Citation4]. In the case of AS in pesticides, protein reactivity alerts did not necessarily correlate with skin sensitization. The results have shown that neither the number nor the type of protein reactivity alert could clearly distinguish sensitizing from non-sensitizing AS. The sensitivity of the ‘QTB, reactivity’ approach was very poor, with 21% for the test set and 5% for the validation set. Nonetheless, others have shown that protein reactivity alerts have informative value for other substance classes [Citation3].
An approach that appeared applicable is the ‘QTB, read-across’, as all positive predictions were true-positive for the test set in this study (). For the validation set, the PPV was 75%, with six true-positive predictions. The read-across approach is based on the transfer of an endpoint value from a structurally very similar chemical to the chemical of interest. The program QTB provides the possibility to perform such an approach, but there are still major problems with the feasibility of the procedure as it is intended: According to the QTB tutorials [Citation34], a read-across is performed by predicting the missing endpoint value of the target with the experimental data of the five most similar chemicals within the group that was created with the help of the profiling tools. The number of similar chemicals (default: 5) which are used for read-across as well as the descriptor defining the similarity can be chosen by the user. Additionally, the number and sort of chemicals in the created group depend on the user. Our preliminary investigations showed that the broad range of possible adjustments resulted in arbitrary predictions in the case of AS in pesticides. The insufficient accuracy with unstructured use of the OECD (Q)SAR Toolbox has been mentioned earlier [Citation35], referring to version 1.1. No significant improvement was found with version 3.4 used here, as the results were still user-dependent. Independently from the intended read-across procedure, the manual read-across alternative used here also bears some problems. Group creation with the tools is difficult because the tools can only be used for group creation when the AS has provoked an alert (with protein reactivity tools) or was sorted into a group (with ‘US EPA New Chemical Categories v2.0’). Technically, a group can be created with the tools nonetheless. However, such a group would then consist of all chemicals inside the QTB database that did not provoke an alert or could not be categorized with the respective tool. That, of course, does not mean that these chemicals possess any similarities among each other. In the case of the protein reactivity tools, a group consisting of chemicals with no protein reactivity would be reasonable, but the absence of an alert cannot be interpreted as the absence of protein reactivity. The absence of an alert can also mean the inability of the tool to recognize the chemical structure or to detect a respective structural feature. The tools are anyhow not expected to reflect all existing possibilities of protein reactivity. This way, the creation of a group with an appropriate size that enables manual scanning was not possible in every case. Nonetheless, by defining strict parameters for chemical similarity, the read-across approach performed here is user-independent.
Another problem with the read-across approach is the lack of sufficiently similar chemicals in the databases. The typical training datasets do not include AS, but focus on common chemicals and cosmetic ingredients. A review article by Patlewicz and Worth [Citation36] describes commonly used data sets for development of (Q)SARs: 270 in vivo skin sensitization tests (mainly GPMT) [Citation37], animal and human studies for 1034 compounds [Citation38], the BgVV (Bundesinstitut für gesundheitlichen Verbraucherschutz und Veterinärmedizin) list of 264 categorized chemicals according to literature data (human data and animal experiments) [Citation39, Citation40], LLNA data for 106 chemicals [Citation41], LLNA data for 41 chemicals [Citation42], 211 chemicals [Citation26] and 93 chemicals [Citation43]. The Gerberick dataset from 2005 was used for building the CAESAR model for skin sensitization [Citation29] and also the Toxtree skin sensitization domains [Citation31]. Although some skin sensitization (Q)SARs are based on the same training data sets, the developed algorithms are different. That leads to divergent results with testing chemicals outside the training set, whereas the applicability domain should be the same, based on the identity of the training sets. When creating new training sets from in vivo data, attention should be paid to chemical diversity of the compounds and development of local models. This will make skin sensitization prediction by (Q)SARs applicable to a broader range of chemicals or more specific, respectively. Based on this, the demand for high quality data that has been mentioned by other parties [Citation35] is supported by this study.
A problem encountered with many (Q)SAR models are salts. The test set used here included two ionic AS: Mancozeb and Maneb. Although both Mancozeb and Maneb are very similar and only differ in the complexation with metal ions (Mancozeb is complexed with manganese and zinc ions, Maneb is complexed only with manganese ions), they are treated as independent AS in regulatory issues. Due to the different cations it is indeed possible that the mechanism of action in skin sensitization is different. However, it was not possible to obtain predictions for Mancozeb or Maneb with CAESAR, CASE Ultra, Leadscope, and SciQSAR. Similarly, the ionic substances of the validation set Diquat-dibromide, Metam-sodium, Propineb, and Ziram did no yield predictions with CAESAR. DQD did not provide predictions for Diquat-dibromide and Metam-sodium directly, but Diquat and Metam as structures are abbreviated in some cases by removal of ions [Citation30]. It is not clear whether the DQD programs are unable to recognize ionic substances or the ions are simply not taken into account. The only software that was able to provide predictions was the QTB. Toxtree could recognize the SMILES, but did not provide any alerts. Thus, although the read-across procedure in the QTB still leaves room for substantial improvement, as discussed above, it is a valuable in silico approach, as it seems to be one of the few approaches available so far able to predict the sensitizing potential of ionic substances, given that other compounds with sufficient structural similarity are available in the databases for comparison.
Discussion on the applicability of (Q)SAR programs
During the evaluation process of the present study it became obvious that the accuracy of predictions by individual models is very limited – the best value was 44% for CAESAR (test set). Each program had strengths and weaknesses with regard to the ability to correctly identify a number of individual AS as sensitizing or not (). Calculation of the mean of the scores of all models still resulted in high numbers of false-positives and -negatives, while the accuracy was nearly doubled – both for the test and the validation set. Fewer false results were achieved by applying weighting factors. An additional application of thresholds yielded a remarkable reduction of false predictions which was reflected especially in PPV. With the latter calculation method, the WSM without Toxtree showed the best predictive performance, but on the expense of the total number of true predictions. This was also the case when performing a cross-validation or a validation with an additional set of 80 AS. In general, the (Q)SAR methods can be evaluated based on performance measures such as accuracy, etc., dependent on the individual aim of the user. If the reliability of the positive predictions is especially important, the thresholded WSM without Toxtree showed the highest PPV but performed less well in other respects. If another parameter is of special interest, another calculation method or an individual program might be favored.
In this study, the ‘best’ calculation method for combining the predictions of several individual (Q)SAR models (thresholded WSM without Toxtree) yielded a PPV of 85% (test set) and 60% (validation set), based on 11 and 12 true-positive AS, respectively. Nonetheless, the accuracy was only 25% (test set) and 23% (validation set). Accordingly, the method would be well suitable to reduce animal testing by classifying pesticidal AS yielding scores greater than or equal to the threshold of 0.4 as potential sensitizers. However, for the AS with inconclusive results or negative predictions, conventional skin sensitization assays would still be necessary in either case. The aberrances between test and validation set outcome could be explained by the not completely identical chemical properties between the two sets. As chemical similarity is an important criterion for the predictive values of (Q)SARs in general, this might be the most probable reason, but also indicates that further evaluation is necessary.
The weighting system could be extended by correlating certain weighting factors with structural properties. We also investigated whether false predictions (here: sensitizing AS with a score < 0 or non-sensitizing AS with a score > 0) were linked to certain functional groups in the AS. To do so, the occurrence of all functional groups between true-positives and false-positives, as well as between true-negatives and false-negatives with each program was compared. The wide range of different functional groups did significantly differ between true-positive/-negative and false-positive/-negative AS, respectively (data not shown). Besides, such a weighting should be applied with care to avoid overfitting of the test set.
In the future, combination of in silico and in vitro assays might possibly result in enhanced predictivity. In vitro assays may include, for example, the Direct Peptide Reactivity Assay (DPRA, OECD Test Guideline 442C), ARE-Nrf2 Luciferase Test Method (KeratinoSensTM, OECD Test Guideline 442D) and the Human Cell Line Activation Test (h-CLAT, OECD Test Guideline 442E) covering the first three KEs in the AOP concept of skin sensitization. Compared to in silico methods, these assays are of course more time-consuming and costly, so that a combination of both would allow minimizing in vitro testing by prioritizing further testing using in silico methods. A combination of different assays has already been proposed by others [Citation35,Citation44–Citation47]. DPRA, KeratinoSensTM, h-CLAT, as well as the two in vitro assays MUSST and LuSens and a protein reactivity predicting QTB tool were differently combined, yielding accuracy values ranging between 80% and 90% [Citation48]. However, the compounds analyzed in the latter study included none of the AS used here. A combination of currently available alternative test methods agreed upon by the OECD has lately also been recommended in the European Chemicals Legislation [Citation49,Citation50]. A recent publication about state of the art non-animal approaches also reviews integrated testing strategies (ITS), sequential testing strategies (STS) and integrated approaches to testing and assessment (IATA) [Citation51]. Most of the approaches include only in vitro tests. The few approaches that include (Q)SAR programs employ primarily commercial programs such as DEREK Nexus or TIMES. According to OECD, commercial models do not ensure the same level of transparency as publicly available models, which might represent a barrier for regulatory acceptance [Citation52].
There have been several studies assessing (Q)SAR tools or evaluating their feasibility. To the best of our knowledge, however, no study exists which has evaluated so many freely available (Q)SAR models for skin sensitization prediction of AS in pesticides. Further, a combination of models by weighted mean with a similar weighting system has not been applied before. The handling of VEGA, amongst others, was extensively described with three example compounds [Citation53], but for bioconcentration factor prediction, not for the prediction of sensitization. Another study evaluated Toxtree, QTB and VEGA with pesticides, but was focused on different endpoints, namely the prediction of carcinogenicity, mutagenicity and reproductive toxicity [Citation54]. There is an extensive review about (Q)SARs [Citation55] that includes the endpoint skin sensitization, but does not focus on pesticides or the programs used here. Another study assessing Toxtree and QTB for skin sensitization prediction with a test set of 45 sensitizing and 55 non-sensitizing substances (not including pesticides) used a kind of weighting system [Citation27]. This depended on the majority of programs predicting the same result, but yielded, nonetheless, a high false-positive rate of 47%. We also applied that approach to our test set (data not shown) yielding similar sensitivity, PPV and NPV like the score mean method, but with lower specificity (21%) and accuracy (35%). The standardization of different programs by translating the individual output into scores has been used for the endpoints genotoxicity and carcinogenicity predicted by DEREK and Topkat® for heat-generated food contaminants [Citation32,Citation33], but, to the best of our knowledge, not yet in the field of skin sensitization.
Pesticides have been rather neglected in the development of (Q)SARs so that resulting models are not yet optimal to predict skin sensitization for pesticidal AS. At the moment, for the purpose of AS risk assessment in the field of cosmetics and REACH chemicals rather combinatory approaches of in silico with in chemico and in vitro methods are under development. For the endpoint skin sensitization, integrated approaches to testing and assessment (IATA) were published by OECD and optimized combinations are concluded as so called defined approaches with a fixed data interpretation procedure [Citation56]. However, the choice of the individual methods depends on the group of chemicals selected. The in silico methods used in these IATAs comprise the local approach QSAR, global models and expert systems such as TOPKAT, MCASE, TIME-SS and Derek Nexus. Although these chemicals are in focus of regulatory and public interest, approaches specific for pesticides are not reported up to now. Therefore, our study could contribute by presentation of predictions by combination of QSAR tools to develop specific and optimized IATAs for pesticides.
Although the presented calculation methodologies are not suitable as a stand-alone method, we have shown weaknesses and strengths of some prominent (Q)SAR programs and diverse combinatorial options in the prediction of skin sensitization for pesticidal AS. We hope that the present study will help to foster discussions on in silico alternatives to animal testing in the pesticide area.
Supplement.pdf
Download PDF (974.7 KB)Acknowledgements
The authors thank Dr Thorsten Buhrke and Dr Falko Frenzel from the Department of Food Safety, BfR for helpful discussions.
Supplementary material
Supplementary material for this article can be accessed at: https://doi.org/10.1080/1062936X.2018.1518261
Disclosure statement
The authors report no conflict of interests. The views expressed in this experimental article are those of the authors and do not necessarily represent the views or policies of BfR.
Related Research Data
References
- OECD, The adverse outcome pathway for skin sensitisation initiated by covalent binding to proteins; Part 1: Scientific evidence, OECD, Paris, France, 2012.
- J.D. Bos and M.M. Meinardi, The 500 Dalton rule for the skin penetration of chemical compounds and drugs, Exp. Dermatol. 9 (2000), pp. 165–169.
- T. Luechtefeld, A. Maertens, D.P. Russo, C. Rovida, H. Zhu, and T. Hartung, Analysis of publically available skin sensitization data from REACH registrations 2008–2014, Altex 33 (2016), pp. 135–148.
- D.A. Basketter and I. Kimber, Allergic contact dermatitis: Is the reactive chemistry of skin sensitizers the whole story?, Contact Dermatitis 68 (2013), pp. 244–245.
- J.P. Thyssen, A. Linneberg, T. Menne, and J.D. Johansen, The epidemiology of contact allergy in the general population–prevalence and main findings, Contact Dermatitis 57 (2007), pp. 287–299.
- T.L. Diepgen, Occupational skin-disease data in Europe, Int. Arch. Occup. Environ. Health 76 (2003), pp. 331–338.
- C.E. Irby, B.A. Yentzer, Q.M. Vallejos, T.A. Arcury, S.A. Quandt, and S.R. Feldman, The prevalence and possible causes of contact dermatitis in farmworkers, Int. J. Dermatol. 48 (2009), pp. 1166–1170.
- J.L. Del Prado-Lu, Insecticide residues in soil, water, and eggplant fruits and farmers’ health effects due to exposure to pesticides, Environ. Health Prevent. Med. 20 (2015), pp. 53–62.
- D.P. Bruynzeel and W.G. Vanketel, Contact-dermatitis due to chlorothalonil in floriculture, Contact Dermatitis 14 (1986), pp. 67–68.
- C. Liden, Facial dermatitis caused by chlorothalonil in a paint, Contact Dermatitis 22 (1990), pp. 206–211.
- C.J.W. Vanginkel and N.N. Sabapathy, Allergic contact-dermatitis from the newly introduced fungicide fluazinam, Contact Dermatitis 32 (1995), pp. 160–162.
- European Community, Regulation (EC) No 1107/2009 of the European Parliament and of the Council of 21 October 2009 concerning the placing of plant protection products on the market and repealing Council Directives 79/117/EEC and 91/414/EEC, Official Journal of the European Union 309 (2009), pp. 1–50. Available at: http://data.europa.eu/eli/reg/2009/1107/oj.
- European Community, Commission Regulation (EU) No 283/2013 of 1 March 2013 setting out the data requirements for active substances, in accordance with Regulation (EC) No 1107/2009 of the European Parliament and of the Council concerning the placing of plant protection products on the market (1), Official Journal of the European Union 93 (2013), pp. 1–84.
- OECD, Test No. 406: Skin Sensitisation, OECD, Paris, France, 1992.
- OECD, Test No. 429: Skin Sensitisation, OECD, Paris, France, 2010.
- European Community, Regulation (EC) No 1223/2009 of the European Parliament and of the Council of 30 November 2009 on cosmetic products (Text with EEA relevance), Official Journal of the European Union 342 (2009), pp. 152–302. Available at: http://data.europa.eu/eli/reg/2009/1223/oj.
- W.M.S. Russell and R.L. Burch, The principles of humane experimental technique, Vol. 1, Methuen, London, 1959.
- IGHRC, Predictive approaches to chemical hazard identification and characterisation: Current use by UK Government Departments and Agencies, IGHRC ed., Institute of Environment and Health, Cranfield University, UK, 2013.
- E. Benfenati, A. Manganaro, and G. Gini, VEGA software download. Available at: http://www.vega-qsar.eu/download.html, 2013.
- DTU, Danish (Q)SAR Database access, DTU, Lyngby, Denmark, 2016. Available at: http://qsardb.food.dtu.dk/db/index.html.
- Toxtree, Software download, IDEA consult, Bourgas, Bulgaria, 2015. Available at: https://sourceforge.net/projects/toxtree/.
- OECD QSAR Toolbox for grouping chemicals into categories, OECD, Paris, France, 2016, https://www.QSARtoolbox.org/.
- G.R. Verheyen, E. Braeken, K. Van Deun, and S. Van Miert, Evaluation of in silico tools to predict the skin sensitization potential of chemicals, SAR QSAR Environ. Res. 28 (2017), pp. 59–73.
- J.M. Fitzpatrick, D.W. Roberts, and G. Patlewicz, An evaluation of selected (Q)SARs/expert systems for predicting skin sensitisation potential, SAR QSAR Environ. Res. 29 (2018), pp. 439–468.
- S.J. Canipa, M.L. Chilton, R. Hemingway, D.S. Macmillan, A. Myden, J.P. Plante, R.E. Tennant, J.D. Vessey, T. Steger-Hartmann, J. Gould, J. Hillegass, S. Etter, B.P.C. Smith, A. White, P. Sterchele, A. De Smedt, D. O’Brien, and R. Parakhia, A quantitative in silico model for predicting skin sensitization using a nearest neighbours approach within expert-derived structure-activity alert spaces, J. Appl. Toxicol. 37 (2017), pp. 985–995.
- G.F. Gerberick, C.A. Ryan, P.S. Kern, H. Schlatter, R.J. Dearman, I. Kimber, G.Y. Patlewicz, and D.A. Basketter, Compilation of historical local lymph node data for evaluation of skin sensitization alternative methods, Dermatitis 16 (2005), pp. 157–202.
- W. Teubner, A. Mehling, P.X. Schuster, K. Guth, A. Worth, J. Burton, B. van Ravenzwaay, and R. Landsiedel, Computer models versus reality: How well do in silico models currently predict the sensitization potential of a substance, Regul. Toxicol. Pharmacol. 67 (2013), pp. 468–485.
- ECHA, Practical Guide 5 How to use and report (Q)SARs, European Chemicals Agency, Helsinki, Finland, March 2016.
- Q. Chaudhry, N. Piclin, J. Cotterill, M. Pintore, N.R. Price, J.R. Chrétien, and A. Roncaglioni, Global QSAR models of skin sensitisers for regulatory purposes, Chem. Cent. J. 4 (2010), pp. 1–6.
- DTU, Danish QSAR database User manual, DTU, Lyngby, Denmark, 2016 Available at: http://qsardb.food.dtu.dk/Danish_QSAR_Database_Draft_User_manual.pdf.
- S.J. Enoch, J.C. Madden, and M.T. Cronin, Identification of mechanisms of toxic action for skin sensitisation using a SMARTS pattern based approach, SAR QSAR Environ. Res. 19 (2008), pp. 555–578.
- F. Frenzel, T. Buhrke, I. Wenzel, J. Andrack, J. Hielscher, and A. Lampen, Use of in silico models for prioritization of heat-induced food contaminants in mutagenicity and carcinogenicity testing, Arch. Toxicol. 99 (2017), pp. 3157–3174.
- J.V. Cotterill, M.Q. Chaudhry, W. Matthews, and R.W. Watkins, In silico assessment of toxicity of heat-generated food contaminants, Food Chem. Toxicol. 46 (2008), pp. 1905–1918.
- OECD, Step-by-step example on how to predict the skin sensitisation potential of a chemical by read-across based on an analogue approach, OECD, Paris, France, 2015. Available at: http://www.oecd.org/env/ehs/risk-assessment/Tutorial_1_TB%203.3_SkinSens%20ReadAcross.pdf.
- D. Basketter, J. Crozier, B. Hubesch, I. Manou, A. Mehling, and J. Scheel, Optimised testing strategies for skin sensitization–the LLNA and beyond, Regul. Toxicol. Pharmacol. 64 (2012), pp. 9–16.
- G.Y. Patlewicz and A. Worth, Review of data sources, QSARs and integrated testing strategies for skin sensitisation, JRC Scientific & Technical Report, Luxembourg, 2008.
- M.T. Cronin and D.A. Basketter, Multivariate QSAR analysis of a skin sensitization database, SAR QSAR Environ. Res. 2 (1994), pp. 159–179.
- C. Graham, R. Gealy, O.T. Macina, M.H. Karol, and H.S. Rosenkranz, QSAR for allergic contact dermatitis, Quant. Struct.-Act. Relat. 15 (1996), pp. 224–229.
- E. Schlede, W. Aberer, T. Fuchs, I. Gerner, H. Lessmann, T. Maurer, R. Rossbacher, G. Stropp, E. Wagner, and D. Kayser, Chemical substances and contact allergy–244 substances ranked according to allergenic potency, Toxicology 193 (2003), pp. 219–259.
- D. Kayser and E. Schlede, Chemikalien und Kontaktallergie - Eine bewertende Zusammenstellung, Verlag Urban & Vogel, München, Germany, 2001.
- J. Ashby, D.A. Basketter, D. Paton, and I. Kimber, Structure activity relationships in skin sensitization using the murine local lymph node assay, Toxicology 103 (1995), pp. 177–194.
- G.F. Gerberick, C.A. Ryan, P.S. Kern, R.J. Dearman, I. Kimber, G.Y. Patlewicz, and D.A. Basketter, A chemical dataset for evaluation of alternative approaches to skin-sensitization testing, Contact Dermatitis 50 (2004), pp. 274–288.
- E. Estrada, G. Patlewicz, M. Chamberlain, D. Basketter, and S. Larbey, Computer-aided knowledge generation for understanding skin sensitization mechanisms: The TOPS-MODE approach, Chem. Res. Toxicol. 16 (2003), pp. 1226–1235.
- C. Bauch, S.N. Kolle, E. Fabian, C. Pachel, T. Ramirez, B. Wiench, C.J. Wruck, B. van Ravenzwaay, and R. Landsiedel, Intralaboratory validation of four in vitro assays for the prediction of the skin sensitizing potential of chemicals, Toxicol. In Vitro 25 (2011), pp. 1162–1168.
- I.R. Jowsey, D.A. Basketter, C. Westmoreland, and I. Kimber, A future approach to measuring relative skin sensitising potency: A proposal, J. Appl. Toxicol. 26 (2006), pp. 341–350.
- J.S. Jaworska, A. Natsch, C. Ryan, J. Strickland, T. Ashikaga, and M. Miyazawa, Bayesian integrated testing strategy (ITS) for skin sensitization potency assessment: A decision support system for quantitative weight of evidence and adaptive testing strategy, Arch. Toxicol. 89 (2015), pp. 2355–2383.
- J. Strickland, Q. Zang, N. Kleinstreuer, M. Paris, D.M. Lehmann, N. Choksi, J. Matheson, A. Jacobs, A. Lowit, D. Allen, and W. Casey, Integrated decision strategies for skin sensitization hazard, J. Appl. Toxicol. 36 (2016), pp. 1150–1162.
- C. Bauch, S.N. Kolle, T. Ramirez, T. Eltze, E. Fabian, A. Mehling, W. Teubner, B. van Ravenzwaay, and R. Landsiedel, Putting the parts together: Combining in vitro methods to test for skin sensitizing potentials, Regul. Toxicol. Pharmacol. 63 (2012), pp. 489–504.
- European Community, Regulation (EC) No 1907/2006 of the European Parliament and of the Council of 18 December 2006 concerning the Registration, Evaluation, Authorisation and Restriction of Chemicals (REACH), establishing a European Chemicals Agency, amending Directive 1999/45/EC and repealing Council Regulation (EEC) No 793/93 and Commission Regulation (EC) No 1488/94 as well as Council Directive 76/769/EEC and Commission Directives 91/155/EEC, 93/67/EEC, 93/105/EC and 2000/21/EC, Official Journal of the European Union 396 (2006), pp. 1–849. Available at: http://data.europa.eu/eli/reg/2006/1907/oj.
- European Community, Commission Regulation (EU) 2017/706 of 19 April 2017 amending Annex VII to Regulation (EC) No 1907/2006 of the European Parliament and of the Council on the Registration, Evaluation, Authorisation and Restriction of Chemicals (REACH) as regards skin sensitisation and repealing Commission Regulation (EU) 2016/1688 (Text with EEA relevance), Official Journal of the European Union 104 (2017), pp. 8–11. Available at: http://data.europa.eu/eli/reg/2017/706/oj.
- J. Ezendam, H.M. Braakhuis, and R.J. Vandebriel, State of the art in non-animal approaches for skin sensitization testing: From individual test methods towards testing strategies, Arch. Toxicol. 90 (2016), pp. 2861–2883.
- OECD, Guidance Document on the Validation of (Quantitative) Structure-Activity Relationship [(Q)SAR] Models, OECD, 2007.
- E. Benfenati, S. Pardoe, T. Martin, R. Gonella Diaza, A. Lombardo, A. Manganaro, and A. Gissi, Using toxicological evidence from QSAR models in practice, Altex 30 (2013), pp. 19–40.
- A. Rybacka, C. Ruden, and P.L. Andersson, On the use of in silico tools for prioritising toxicity testing of the low-volume industrial chemicals in REACH, Basic Clin. Pharmacol. Toxicol. 115 (2014), pp. 77–87.
- M.T. Cronin, J.C. Dearden, J.D. Walker, and A.P. Worth, Quantitative structure-activity relationships for human health effects: Commonalities with other endpoints, Environ. Toxicol. Chem. 22 (2003), pp. 1829–1843.
- OECD, Guidance Document on the Reporting of Defined Approaches and Individual Information Sources to be Used within Integrated Approaches to Testing and Assessment (IATA) for Skin Sensitisation, OECD Series on Testing & Assessment 256 (2017), pp. 1–317.