
Abstract
Chemoembolization for hepatocellular carcinoma (HCC) is often suboptimal due to multiple involved signaling and lack of effective drugs. Arsenic trioxide (ATO) is a potent chemotherapeutic agent, which can target multiple signaling and have substantial efficacy on HCC. However, its usage is limited due to systemic toxicity. Using ATO-eluting beads/microspheres for chemoembolization can have locoregional drug delivery and avoid systemic exposure but will require high drug load, which has not been achieved due to low solubility of ATO. Through an innovative approach, we generated the transiently formed ATO microcrystals via micronization and stabilized these microcrystals by solvent exchange. By encapsulating ATO microcrystals, but not individual molecules, with poly(lactide-co-glycolic acid) (PLGA), we developed microspheres cored with extremely high dense ATO. The molar ratio between ATO and PLGA was 157.4:1 and drug load was 40.1%, which is 4–20 fold higher than that of reported ATO nano/microparticles. These microspheres sustainably induced reactive oxygen species, apoptosis, and cytotoxicity on HCC cells and reduced tumor growth by 80% via locoregional delivery. Chemoembolization on mice model showed that ATO-microcrystal loaded microspheres, but not ATO, inhibited HCC growth by 60–75%, which indicates ATO within these microspheres gains the chemoembolizing function via our innovative approach.
Introduction
Chemoembolization, often via transarterial chemoembolization (TACE), is the mainstay for the treatment of unresectable hepatocellular carcinoma (HCC) (Lencioni et al., Citation2013; Daher et al., Citation2018; Facciorusso, Citation2018). By delivering drug via blood stream to occlude vessels at tumor, it can reach locoregional cytotoxicity and other antitumoral effects (Lencioni et al., Citation2013; Nam et al., Citation2016; Facciorusso, Citation2018). Currently, conventional TACE is facing technical issues of the escape of the chemotherapeutic agent from the treated portion of liver (Lencioni et al., Citation2013; Facciorusso, Citation2018). Therefore, drug eluting bead TACE has been introduced and widely used clinically. By using chemotherapeutic drugs-load microspheres, drug eluting bead TACE can improve local drug releasing and reduce systemic exposure while provide the same therapeutic efficacy as conventional TACE (Lencioni et al., Citation2013; Nam et al., Citation2016; Facciorusso, Citation2018). However, the efficacy of TACE remains suboptimal with low response rate (often <50%) (Lencioni et al., Citation2013; Piscaglia & Ogasawara, Citation2018). The main reasons causing therapeutic failure on HCC treatment, including TACE, are multiple aberrant signaling pathways, high resistance rate to chemotherapy, and limited effective drugs (Daher et al., Citation2018).
Arsenic trioxide (ATO) is a chemotherapeutic agent mainly used for acute promyelocytic leukemia (Lengfelder et al., Citation2012; Kritharis et al., Citation2013). Numerous studies using cell and animal models have demonstrated that ATO is also a strong chemotherapeutic agent to solid tumors, such as HCC, colorectal, lung, bladder, breast, and pancreatic cancer (Kritharis et al., Citation2013; Hoonjan et al., Citation2018). ATO has its function through multiple pathways, while induction of apoptosis and inhibition of proliferation are considered as the two main mechanisms. ATO can induce the intracellular reactive oxygen species (ROS) and then activate caspases for apoptosis (Miller et al., Citation2002; Kritharis et al., Citation2013; Hoonjan et al., Citation2018). Additionally, other targeted molecules, such as survivin, have been found to involve ATO-induced apoptosis (Hoonjan et al., Citation2018). ATO can also induce G2/M arrest and therefore inhibit tumor cell proliferation (Miller et al., Citation2002; Hoonjan et al., Citation2018). ATO has anti-angiogenesis effects and can block blood supply to tumor mass (Miller et al., Citation2002; Kritharis et al., Citation2013; Hoonjan et al., Citation2018). ATO is an antagonist of the Hedgehog pathway, which is crucial for the growth of tumor stem cell (Kritharis et al., Citation2013). Multiple signaling molecules and transcriptional factors, such as protein kinase JNK, PKC, MAP kinase, tyrosine phosphatases, NF-κB, and AP-1, have been found involving in these changes (Miller et al., Citation2002; Lengfelder et al., Citation2012; Kritharis et al., Citation2013; Hoonjan et al., Citation2018). Noticeably, ATO can also inhibit HCC cells stemness and epithelial–mesenchymal transition, which are the crucial mechanisms causing resistance to chemotherapy and tumor progression (Huang et al., Citation2019; Wang et al., Citation2019).
Despite these promising preclinical data, ATO is still mainly used for leukemia. The clinical usage of ATO for solid tumors, including HCC, is inconclusive. A study of advanced HCC with limited number of patients did not show improved treatment effect (Lin et al., Citation2007). However, two clinical trials showed synergistic treatment of TACE and ATO on HCC had better efficacy on preventing metastases and prolonging survival (Wang et al., Citation2015; Hu et al., Citation2017). The low solubility and quick elimination of ATO from blood stream are the main reasons that limit ATO to have adequate chemotherapeutic effect at the tumor site (Akhtar et al., Citation2017). On the other hand, people are reluctant to use high dose of ATO for prolonged period. Often identified as a natural toxin, ATO can accumulate in liver, lung, heart, and kidneys and cause damage in these organs (Falchi et al., Citation2016). ATO also has strong genotoxic effect. While this function can be used for the treatment of cancer cells, it can also cause carcinogenesis in some normal cells under prolonged exposure (Kritharis et al., Citation2013).
Nanoparticles and microspheres are effective tools for sustained drug delivery and multiple studies on ATO nanoparticles and microspheres have shown improved antitumor effects (Zhou et al., Citation2005; Yang et al., Citation2009; Zhou et al., Citation2012; Kalepu & Nekkanti, Citation2015; Akhtar et al., Citation2017; Ellison et al., Citation2017; Lu et al., Citation2018; Duan et al., Citation2019; Hu et al., Citation2019; Lian et al., Citation2019; Wu et al., Citation2020). The drug loading of ATO and its releasing pattern in these particles are essential for therapeutic efficacy. Many materials, including liposome, polymersomes, magnetic complex, albumin, and silica, have been used to optimize the constructs. Nevertheless, the low solubility of ATO is still an obstacle for achieving high drug load (Yang et al., Citation2009; Akhtar et al., Citation2017). Chemoembolization with drug eluting bead would be an ideal application of ATO microsphere since this procedure can locoregionally deliver drug to tumor and largely avoid the systemic exposure. Therefore, generating ATO microsphere with high drug load is especially critical to promote ATO microsphere into a phase closing to clinical usage.
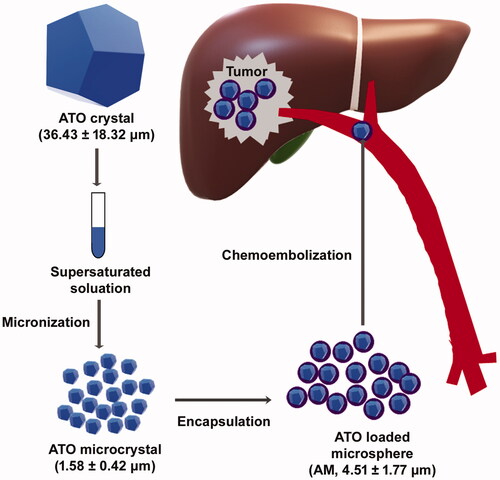
In current study, we achieved high drug-load of ATO in microspheres through an innovative approach: generating transiently formed ATO microcrystals and encapsulating ATO microcrystals but not individual ATO molecules (). These microspheres contain high dense ATO microcrystals, have sustained antitumoral effects and potent chemoembolizing capacity on HCC ().
Figure 1. Schematic diagram of chemoembolizing arsenic trioxide (ATO) microcrystal-loaded microsphere. ATO crystal (36.43 ± 18.32 μm; data: mean ± SD) was micronized to ATO microcrystal (1.58 ± 0.42 μm), which was encapsulated with PLGA to generate ATO-microcrystal loaded microsphere (AM) (4.51 ± 1.77 μm). Chemoembolizing AM on HCC mice model significantly inhibited tumor growth.
Materials and methods
Reagents and cell line
Poly(d,l-lactide-co-glycolide) lactide:glycolide (PLGA) 50:50, molecular weight 30,000–60,000, was from Lactel (Birmingham, AL). Arsenic trioxide and dichloromethane (DCM) were from Fisher Scientific (Hampton, NH). Vitamin E-TPGS was from Sigma (St. Louis, MO). Calcein AM, Dulbecco's modified Eagle medium (DMEM) media, trypsin–EDTA, and streptomycin and penicillin antibiotics were from Thermo Fisher (Waltham, MA). Fetal bovine serum was from Atlanta Biologicals (Atlanta, GA). Growth factor reduced Matrigel was from Corning (Corning, NY). l-Luciferin was from Goldbio (St. Louis, MO). Phosphate-buffered saline (PBS), pH = 7.4, was from Thermo Fisher (Waltham, MA). All other reagents are purchased from Fisher Scientific (Hampton, NH). The human HCC cells with luciferase gene, Huh7-luc, was purchased from Japanese Collection of Research (Tokyo, Japan).
Generation of ATO microcrystal
Supersaturated ATO solution was made by slowly dissolving ATO to 1 M NaOH at the room temperature. The supersaturated solution was quickly mixed with 60 μl of acetic acid. The mixture is under constant sonication with ice-water bath for one minute. After the mixture reached opaque, 1 ml of DCM was quickly added and the mixture was briefly centrifuged at 2000×g. Water above the DCM was removed and more DCM was added, and the mixture was sonicated with ultrasonic probe (Q700 sonicator, Qsonica, Newtown, CT) for 10 seconds under ice-water bath. The mixture was briefly centrifuged at 2000×g. Most of DCM was removed but minimal amount was kept to protect the microcrystal.
Preparation ATO-loaded PLGA microspheres (AM) and vacant PLGA microspheres
ATO microcrystal in DCM was mixed with 1 ml of DCM containing 150 mg of PLGA and 2 ml of 0.15% vitamin E-TPGS and emulsified with a 700 W ultrasonic processor, at 10% of amplification power, for five seconds. The resulting emulsion was diluted with 50 ml of 0.15% vitamin E-TPGS. The mixture was centrifuged at 2000×g for five minutes. The pellet was mixed with water under sonication and centrifuged at 2000×g for five minutes. The pellet was then mixed with 30 ml of sutured CaCl2 solution and the mixture was centrifuged at 5000×g for 20 minutes. The resulting pellet was washed with water three times and microspheres in the pallet after final wash were collected. To make vacant microspheres, 150 mg of PLGA was mixed with 2 ml of 0.15% vitamin E-TPGS, and emulsified. The emulsion was further mixed with extra volume of vitamin E-TPGS, constant stirred, and centrifuged at 2000×g to get the pellet. The pellet was washed with water to get vacant microspheres.
Characterization of AM, vacant PLGA microspheres, and ATO microcrystal
The morphology of microspheres as well as ATO large and microcrystal was evaluated under scanning electron microscope (Hitachi TM-1000 and Hitachi S-3700N, Hitachi, Tokyo, Japan) and the size distribution was analyzed by ImageJ (Bethesda, MD). Some microspheres were also undergone a quick degradation process by freeze–thaw cycle and evaluated under electron microscope. The zeta potential was determined by Zetaview (Particle Metrix, Meerbusch, Germany). Quantification of ATO was performed by using inductively coupled plasma mass spectrometry (ICP-MS, Thermo Fisher, Waltham, MA) and Quantofix (Sigma, St. Louis, MO). The following formula was used to calculate drug loading rate and encapsulation efficiency. Drug loading rate (%)=amount of ATO in the microspheres/amount of microsphere × 100. Encapsulation efficiency (%)=amount of ATO in the microspheres/amount of ATO microcrystal initially taken to prepare the microspheres × 100.
The Fourier-transform infrared spectroscopy (FT-IR) on AM, vacant PLGA microspheres and ATO was performed by using a Bruker IFS 66 v/s infrared spectrometer (Bruker, Karlsruhe, Germany), in transmittance mode, with the wavenumber range from 400 to 4000 cm−1 and with a resolution of 4 cm−1. The KBr pellet technique was adopted to prepare samples for recording the IR spectra.
ATO release assay was done as follows: AM was added to PBS to make concentration of ATO to 50 μg/ml in 10 ml of total volume at pH 5.8, 6.5, or 7.4. The experiments were conducted at the room temperature. At various time points, microsphere-free aliquots were removed and ATO was measured as described above.
Cell viability assay
Huh7-luc cells were allowed to grow to 30% confluence on 24-well plate and divided into four groups: AM, ATO, PLGA, and control (CT). For ATO group, cells were treated with ATO at the concentration range from 0.25 μM to 4 μM. For AM group, AM with equal amount of ATO to that of 0.25–4 μM of ATO-treatment group was added to medium, respectively. For PLGA group, cells were treated with vacant PLGA microspheres (same molar amount of PLGA to that of 4 µM of AM-treatment group). For CT group, PBS (same volume of PBS to that of PLGA-treatment group) was added to cell medium. At various time points, the treatment with medium were removed, and cells were gently with PBS and then incubated with 250 μl of 1 μM calcein-AM at 37 °C under 5% CO2 for 30 min. Fluorescence was quantified on microplate reader (Synergy H1, BioTek, Winooski, VT) at excitation/emission wavelengths of 485/528 nm. The fluorescent signals in CT group were used as the baseline. The relative viability index was calculated by using the following formula: fluorescent signals in AM, ATO, or PLGA group/baseline × 100. Three wells for each treatment and the experiment was repeated twice.
Reactive oxygen species detection
Huh7-luc cells were allowed to grow to 30% confluence on 24-well plate and divided into four groups: AM, ATO, PLGA, and CT. For ATO group, cells were treated with ATO at the concentration of 0.25 μM or 0.5 μM. For AM group, AM with equal amount of ATO to that of 0.25 or 0.5 μM ATO-treatment group was added to medium, respectively. For PLGA group, cells were incubated with vacant PLGA microsphere (same molar amount of PLGA to that of 4 µM of AM-treatment group). For CT group, PBS (same volume of PBS to that of PLGA-treatment group) was added to cell medium. Three or 6 days after the incubation, ROS levels were measured by using the Abcam ROS Detection Kit (ab113851, Cambridge, MA). Briefly, cells were washed with serum-free media and incubated with 20 μM of 2′,7′-dichlorofluorescein (DCF) at 37 °C for 30 min. Cells were then washed with manufacturer's buffer. Cellular ROS levels were evaluated by EVOS Imagin-g System (Thermo Fisher, Waltham, MA) on green fluorescent channel. For quantification assay, fluorescence intensity was determined by microplate reader (Synergy H1, BioTek, Winooski, VT) at excitation/emission wavelengths of 485/528 nm and the fluorescent signals were adjusted by cell number. The signals in CT group were used as baseline. The relative ROS index was calculated by the following equation: adjusted fluorescent intensity in AM, ATO, or PLGA group/baseline × 100. Three wells for each treatment and the experiment was repeated twice.
The fluorescent signals of cells with the treatment of AM, ATO, PLGA, or CT were also captured on green fluorescent channel with EVOS FL microscope (Thermo Fisher, Waltham, MA). The images were further analyzed by using ImageJ (NIH, Bethesda, MD).
Apoptosis assay
Cell apoptosis was evaluated by Caspase-3 Assay Kit from Abcam (ab39401, Cambridge, MA). Briefly, Huh7 cells were seeded in six-well plate and divided into four groups: AM, ATO, PLGA, and CT. For ATO group, cells were treated with ATO at the concentration of 0.25 μM or 0.5 μM. For AM group, AM with equal amount of ATO to that of 0.25 or 0.5 μM ATO-treatment group was added to medium, respectively. For PLGA group, vacant PLGA microsphere (same molar amount of PLGA to that of 4 µM of AM-treatment group) was used. For CT group, PBS (same volume of PBS to that of PLGA-treatment group) was added to cells medium. After incubation for six days, cells were processed following manufacture’s instruction and caspase-3 activity was measured using colorimetric assay. The signals in CT was used as baseline. The relative caspase 3 activity was generated by using the following equation: caspase 3 activity in AM, ATO, or PLGA groups/baseline. Three wells for each treatment and the experiment was repeated twice.
Animals
The animal protocols were performed in accordance with the guidelines approved by the Institutional Animal Care and Use Committee of Medical University of South Carolina. The athymic nude mice and NSG mice were from Jackson Laboratories (Bar Harbor, ME) or bred in-house.
HCC subcutaneous xenograft model and locoregional delivery of drugs
Fifty microliters of ice-cold growth factor reduced Matrigel was mixed with 50 μl of 2.5 × 10⁶ Huh7-luc cell in PBS and subcutaneously inoculated to 5- to 8-weeks athymic nude mice. Growth of tumor was routinely checked. The tumor volume was calculated by using the following equation: volume = [length×(width)2]/2. Mice began to receive treatment when the volume of tumor reached 50–150 mm3. First, the impact of PLGA on tumor growth was studied. Mice were randomly assigned into two groups: CT or PLGA. For PLGA group, mice were given vacant PLGA microspheres (same molar amount of PLGA to that of AM in the AM group in the subcutaneous experiment, see below) in PBS (total volume 100 µl). For CT group, mice were given 100 µl of PBS. PLGA or PBS were intratumorally injected into tumor parenchyma every other two days for two weeks. The size of tumor was monitored along the treatment. Mice were sacrificed at the end of the experiment. Tumors were harvested, weighted, and fixed in 10% formalin. Six tumor foci for each treatment condition and experiments were repeated twice. Next, the impact of AM or ATO treatment on tumor growth was studied. Mice were randomly assigned into three groups when tumor volume reached 50–150 mm3: AM, ATO, or PLGA. The dose of ATO in ATO group and also AM group was 2 mg/kg. For PLGA group, mice were given vacant PLGA microspheres (same molar amount of PLGA to that of AM group). Drugs were given through intratumoral injected every other two days for 15 days. The volume for each injection is 100 µl. The mice and tumor were monitored, animal were sacrificed at the end, and tumors were harvested as just described. Six tumor foci for each treatment condition and experiments were repeated twice.
Immunohistochemical stains
Immunohistochemical stains were performed on harvested tumor from the subcutaneous model. Briefly, the sections were deparaffinized, hydrated, and underwent antigen retrieval. The sections were blocked with 5% bovine serum albumin and incubated with anti-Ki-67 (Abcam, cat# 15580, Cambridge, MA) or anti-cleaved caspase-3 (Cell Signaling, cat #9661, Beverly, MA) overnight. Next, sections were rinsed and incubated with biotin-conjugated anti-rabbit antibody followed by incubation with streptavidin conjugated with horseradish peroxidase by using Avidin-Biotin Complex Kit (Vector Lab, Burlingame, CA). Sections were stained with hematoxylin, coverslipped, and visualized under a light microscope.
Establishing HCC liver orthotopic xenograft model and chemoembolization
Five- to 8-week old NSG mice were anesthetized and a median laparotomy was performed. 5 × 10⁵ of Huh7-luc cells in PBS (pH = 7.4) suspension were injected into the portal vein by using 33 G needle. The abdominal wall was closed, and mice were closed monitor for totally recovery from the operation and then routinely checked. To monitor tumor growth, mice were intraperitoneally injected with d-luciferin (Cat# LUCNA, Goldbio, St. Louis, MO) and the luminescent signaling was monitored with in vivo bioluminescence scanner (IVIS 200, PerkinElmer, Waltham, MA). After tumor grew, the impact of PLGA on tumor growth was first studied. Mice were randomly assigned into two groups, CT and PLGA groups, for chemoembolization. For PLGA group, mice were given vacant PLGA microspheres (same molar amount of PLGA to that of AM in the AM group in the liver experiment, see below). For CT group, mice were given 100 μl of PBS. Mice were anesthetized, and a median laparotomy was performed. After the exposure of portal vein, 100 μl of PBS or vacant PLGA microsphere in PBS was delivered via portal vein. The abdominal wall was closed. Mice were closely monitored and tumor signaling was checked with in vivo bioluminescence in next three weeks. Five mice for each group and experiments were repeated twice. For chemoembolization with AM or ATO, mice were randomly assigned into three groups: AM, ATO, or CT after tumor grew. Briefly, mice were anesthetized and a median laparotomy was performed. After the exposure of portal vein, 100 μl of AM, ATO, or vacant PLGA microsphere (equal molar amount of PLGA to that of AM) in PBS (pH = 7.4) was delivered via portal vein. The dose of ATO in AM and ATO was 2 mg/kg. After the delivery of drugs, the abdominal wall was closed. Mice were closely monitored and tumor signaling was checked with in vivo bioluminescence in next three weeks. Five mice for each group and experiments were repeated twice. Bioluminescent data were analyzed by using Aura Imaging (Spectral Instruments, Tucson, AZ).
Statistical analysis
Quantitative results were expressed as the mean ± SD. The level of significance was determined by one-way ANOVA (analysis of variance). A p value <.05 was statistically significant, and p<.01 was strong statistically significant.
Results
Generation and stabilization of ATO microcrystal
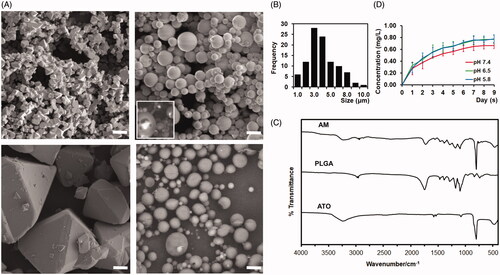
ATO microcrystal was formed via an optimized and controlled micronization process: neutralizing the supersaturated ATO solution under constant sonication. In the aqueous solution, ATO microcrystal was unstable and rapidly grew to large crystal with average size 36.43 ± 18.32 µm (, left-lower panel and ). To avoid the precipitation of ATO and formation of large crystal, the aqueous solution was replaced by DCM soon after the formation of microcrystal. As shown in the scanning electron microscopy, ATO microcrystal was stabilized within DCM (, left-upper panel). The average size of ATO microcrystal is 1.58 ± 0.42 μm ( left-upper panel and ).
Figure 2. Developing and charactering arsenic trioxide (ATO) microcrystal-loaded microspheres (AM). (A). Representative electron microscope images of ATO microcrystal (left upper), AM (right upper), ATO large crystal (left lower), and vacant microsphere (right lower). Inset panel of right upper quadrant: Degrading AM to show the encapsulated ATO microcrystal. Bar = 5 μm. (B) Distribution of the size of AM. (C) Fourier-transform infrared spectroscopy (FT-IR) spectra of ATO, vacant PLGA microsphere, and AM. (D). Drug releasing curve of AM in PBS (pH = 5.8, 6.5, or 7.4) (data: mean ± SD).
Formulation and characterization PLGA microsphere loaded with ATO microcrystal
The AM is formulated by employing the double emulsion with the stabilized ATO microcrystal, PLGA, and vitamin E-TPGS. The AM were spherical without hollows or aggregation (, right-upper panel). To visualize the encapsulated ATO microcrystal, AM was through a rapid and transient freezing–thawing procedure, hnece the surface is partially degraded and the ATO core was exposed. As shown in (the inset panel of right-upper panel), ATO microcrystal was successfully encapsulated within AM. Additionally, no growing of encapsulated microcrystal to large crystal was noticed. The particle size was 4.51 ± 1.77 μm ( and ). Approximately, 50% of AM are in the range of 3–5 μm, 20% of the AM are smaller than 3 μm and 30% of the AM are larger than 5 μm (). Approximately, 48% of microspheres are larger than 4.3 μm (). The zeta potential was −40.41 ± 12.54. The drug load of AM was 40.1%±8.5%. The mole ratio of ATO:PLGA is 157.4:1. The encapsulation efficiency was 21.6 ± 3.1%.
The functional groups of the AM, vacant PLGA microsphere, and ATO material were analyzed by FT-IR (). The PLGA vacant microsphere showed the C–H stretching vibration at 2997 and 2948 cm−1, the characteristic stretching vibration of the carboxyl group at 1762 cm−1 and C–O stretching vibration between 1490 and 1020 cm−1 (). The FTIR spectrum of the ATO showed the characteristic band of As–O at 802 cm−1 (). These function groups of PLGA and ATO were also observed in the AM (). The drug release studies of AM at the pH range from 5.8 to 7.4 showed a short burst release within first 24 hours, and then a sustained manner during the nine-day period of the experiment (). The plateau phase was researched at day 5–6 for all pH conditions (). After the start of ATO releasing, the average values of ATO concentration in the solution were higher at pH 5.8 and 6.5 than at pH 7.4 from day-1 to day-9, though no statistical significance was detected ().
The vacant PLGA microspheres were made by using the same procedure without ATO and had similar size and zeta potential as that of AM ( right-lower panel and data not shown).
AM demonstrating sustained cytotoxicity to HCC cells in vitro
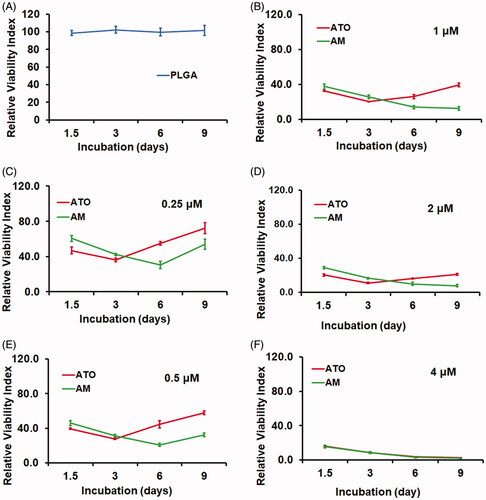
We next investigated the in vitro cytotoxicity by using the Calcein-AM assay. The Huh7 HCC cells were incubated with AM, ATO, vacant PLGA microsphere (PLGA), or PBS as CT for nine days. Compared to CT, cells received PLGA treatment showed similar viability (). On the other hand, both AM and ATO demonstrated significant cytotoxicity on Huh7 cells in a dose dependent manner from 0.25 to 4 μM (). There was no difference between AM and ATO at 4 μM. But at the dose range from 0.25 to 2 μM, AM demonstrated sustained and more profound cytotoxicity. As shown in , ATO had higher cytotoxic effect in the first three days and reached the peak at day 3. In contrast, AM showed increased cytotoxicity along the time course and reached the peak at day 6 for 0.25 and 0.5 μM, and day 9 for 1 and 2 μM, respectively. Additionally, AM had higher cytotoxicity compared to ATO at the dose range from 0.25 to 2 μM ().
Figure 3. AM demonstrated sustained and more profound cytotoxicity than ATO on Huh7 HCC cells. Huh7 cells were seeded and allowed to grow for 24 hours and then were treated with PBS as control (CT), vacant PLGA microsphere (PLGA), AM (0.25–4 μM), or ATO (0.25–4 μM) for nine days. The cytotoxicity was evaluated by Calcein AM assay (data: mean ± SD). (A) PLGA did not cause cytotoxicity during the entire treatment. (B–F) Cytotoxicity caused by AM and ATO at the dose range from 0.25 μm to 4 μm. Both AM and ATO had cytotoxicity in a dose-dependent manner. ATO (0.25–2 μM) reached the lowest viability signal at day 3 of incubation. Comparing to ATO, AM treatment at the dose range of 0.25–2 μM showed sustained and more profound cytotoxic effect. At the concentration of 4 μM, AM and ATO showed same level of cytotoxicity along the time course.
AM but not ATO sustainably induced ROS and apoptosis in HCC cells in vitro
We then focused the effect of AM and ATO on the induction of ROS. Cells were treated with AM, ATO, vacant PLGA microsphere, or PBS. DCF assay was used and fluorescent signals were visualized under microscope (). Quantified signals were also captured by microplate reader and calculated based on cell numbers and ratio to CT group (). As shown in , there was no difference between CT and PLGA in term of ROS activity at both three-day and six-day post-treatment.
Figure 4. AM but not ATO demonstrated sustained induction reactive oxygen species (ROS) and apoptosis on Huh7 HCC cells. Huh7 cells were treated with 0.25–0.5 μM of AM, ATO, vacant PLGA microsphere (PLGA), or PBS as control (CT) for 3 or 6 days for ROS assay and six days for apoptosis assay. (A). Representative images of ROS levels by using converted dichlorofluorescein (DCF) (green fluorescence) as a surrogated marker. Bar = 50 μm. (B) ROS levels were measured by quantifying DCF fluorescent signals (adjusted by cell numbers and corrected with signals in CT; data: mean ± SD). No induction of ROS in cells treated with PLGA. After three days of incubation, both AM and ATO induced ROS in a dose-dependent manner (0.25–0.5 μM) (**p<.01). At the same concentration of drug, no difference was observed between AM and ATO in term of ROS induction at day 3. After six days of incubation, the induction of ROS in AM group was remained; but the induction of ROS in ATO group was abolished and reduced to the baseline (##p<.01). (C). Apoptosis was evaluated by using caspase-3 activity as a biomarker (data: mean ± SD). At day 6 of incubation, no induction of apoptosis was observed in cells treated with PLGA or ATO (0.25–0.5 μM). Induced apoptotic activity was observed in cells treated with AM (0.25–0.5 μM) (##p<.01). 0.5 μM of AM had higher proapoptotic activity than 0.25 μM of AM (**p<.01).
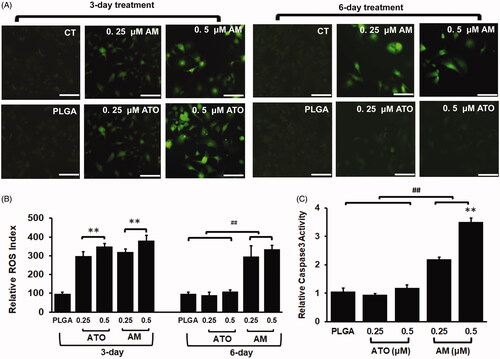
On the other side, three-day incubation of AM and ATO significantly induced ROS in a dose-dependent manner from 0.25 to 0.5 μM (). No difference was found between AM and ATO at the same drug concentration at day 3. However, in cells with prolonged ATO treatment (six-day incubation), ROS dropped to the baseline. In contrast, six-day incubation of AM remained the similar level of ROS induction as that of three-day incubation (). For the induction of ROS at day 6, there was no statistical difference between 0.25 and 0.5 μM of AM, though ROS appears higher in cells treated with 0.5 μM of AM (). These data indicated sustainable induction of ROS by AM.
Based on findings on ROS assay, we postulated that AM could induce apoptosis in a sustainable pattern. We then used caspase-3 activity as a biomarker to assess apoptosis. As we postulated, the induction of apoptosis could be detected with prolonged incubation (six days) of AM but not ATO (). The effects of AM on apoptosis was dose-dependent at the concentration range from 0.25 μM to 0.5 μM. In addition, vacant PLGA microsphere did not induce apoptosis (). These data indicated that AM but not ATO could sustainably induce HCC cells apoptosis. Additionally, the sustainable patterns of AM on the induction of ROS, apoptosis, and cytotoxicity, as well as drug releasing were consistent with each other ().
The locoregional delivery of AM and ATO on HCC subcutaneous xenograft model demonstrated significant antitumoral effect
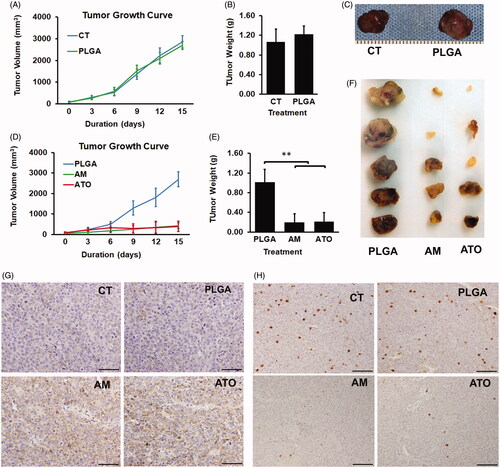
We next evaluated the locoregional antitumoral effect of AM and ATO via intratumoral injection of drugs on Huh7 subcutaneous nude mouse model. We first investigated whether vacant PLGA microsphere itself had any impact on tumor growth. Consistent with in vitro studies, subcutaneous HCC xenograft experiments showed that PLGA did not inhibit tumor growth. Both PLGA and CT groups showed the same tumor growth patterns in term of tumor volume along the experiment and tumor weight at the end point (). We next then focused on the antitumoral effects of AM and ATO by intratumoral injection of AM, ATO, or vacant PLGA microsphere for two weeks and compared tumor growth in AM and ATO groups to that in PLGA group. The results showed, after nine days and 12 days of treatment, tumor in AM and ATO groups had significant less volume than that of PLGA group: 255 ± 181 mm3 and 305 ± 222 mm3 vs. 1290 ± 445 mm3 for day 9; and 363 ± 284 mm3 and 331 ± 281 mm3 vs. 1710 ± 544 mm3 for day 12, respectively (). The inhibitory effect of AM and ATO on tumor growth in term or tumor volume were 80.2 ± 14.0% and 76.4 ± 17.2% for day 9 and 78.8 ± 16.6% and 80.6 ± 16.4% for day 12, respectively. Tumor weight at harvest demonstrated the same patterns (). Tumor weight in AM and ATO groups is significantly less than that in PLGA group: 0.20 ± 0.17 g and 0.22 ± 0.18 g vs. 1.02 ± 0.31 g, respectively. Correspondingly, the inhibitory effects on tumor growth in term of weight were 80 ± 21% and 78 ± 19% for AM and ATO, respectively. There was no difference between AM and ATO groups on tumor volume and tumor weight (). These results demonstrated locoregional delivery of AM and ATO could significantly inhibit HCC tumor growth in vivo.
Figure 5. Locoregional delivery of AM and ATO on Huh7 HCC subcutaneous model significantly inhibited tumor growth through induction of apoptosis and inhibition of proliferation. The locoregional delivery of AM (2 mg/kg), ATO (2 mg/kg), vacant microsphere (PLGA), or PBS as control (CT) was through intratumoral injection (every three days for 15 days) on Huh7 subcutaneous mice model. (A–C). PLGA did not inhibit tumor growth as indicated in (A) tumor volume, (B) tumor weight at the time of harvest, and (C) representative picture of tumor at the time of harvest (data: mean ± SD; **p<.01). (D–E) Both AM and ATO demonstrated markedly antitumoral effects as indicated in (D) tumor volume, (E) tumor weight at the time of harvest, and (F) representative picture of the tumor at the time of harvest (data: mean ± SD; **p<.01). No difference on tumor volume and weight was noticed between AM and ATO. The effects of AM and ATO on apoptosis and proliferation were evaluated by immunohistochemical stains of (G) caspase-3 and (H) Ki-67 on tumor tissue. Both CT and PLGA showed the same caspase-3 and Ki-67 signal intensity. Compared to CT and PLGA, AM, and ATO significantly induced caspase-3 activity and inhibited Ki-67 expression. No difference between AM and ATO in term of caspase-3 activation and Ki-67 expression. Bar = 100 μm.
Locoregional delivery of AM and ATO induced apoptosis and inhibited proliferation on HCC subcutaneous xenograft model
We then evaluated apoptosis and cell proliferation in tumor harvested from the subcutaneous locoregional delivery experiments by using caspase-3 activation and Ki-67 expression as biomarkers, respectively. As showed in , there was no difference between CT and PLGA groups in term of caspase-3 activity and Ki-67 expression. In contrast, tumors in AM and ATO groups had significantly higher level of caspase-3 activation and lower level of Ki-67 expression, respectively (). Consistent with the results on tumor volume and weight, no difference between AM and ATO on caspase-3 activation and Ki-67 expression was observed.
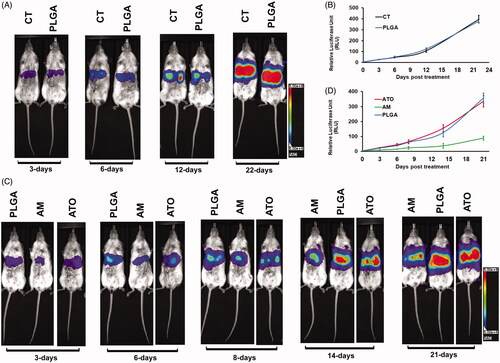
Chemoembolizing with AM significantly inhibited tumor growth on HCC orthotopic xenograft model
We next evaluated the chemoembolization effect of AM. For this purpose, we conducted a chemoembolization procedure on Huh7-luc liver orthotopic mouse model to mimic the procedure on patients. The drugs were delivered via intraportal vein one time when tumor entered rapid growth phase. Tumor signals were monitored via the bioluminescent signals for three weeks. As we expected, there was no difference on tumor growth between CT (PBS treatment) and PLGA (vacant PLGA microsphere treatment) groups (). Comparison of chemoembolization effect of AM, ATO, and vacant PLGA microsphere was then conducted in the next step. There was not difference between the treatments of ATO and vacant PLGA microsphere (). In contrast, chemoembolizing with AM significantly inhibited tumor growth by 58.5%, 60.6%, 60.8%, 70.5%, and 75.1% at three-day, six-day, eight-day, 14-day, and 21-day post procedure, respectively (). Our data indicated that chemoembolizing with AM but not ATO could markedly inhibit HCC tumor growth.
Figure 6. AM but not ATO demonstrated significant antitumoral effect as a chemoembolization agent. Chemoembolization was conducted by delivering of AM, ATO, vacant PLGA microsphere (PLGA), or PBS as control (CT) in PBS via portal vein on HCC orthotopic mice model. The dose of arsenic trioxide in AM and ATO was 2 mg/kg. The tumor signal was followed up by bioluminescence for 21–22 days. (A, B) CT and PLGA showed the same tumor burden at 3, 6, 12, and 22 days post the procedure. (A) Representative bioluminescence scanning pictures. (B) Quantified bioluminescent signals from mice received PBS as CT or PLGA treatment (data: mean ± SD). (C, D) Chemoembolizing with AM significantly inhibited tumor growth by 58.5%, 60.6%, 60.8%, 70.5%, and 75.1% at 3-day, 6-day, 8-day, 14-day, and 21-day post the procedure. Chemoembolizing with ATO did not inhibit tumor growth as compared to PLGA. (C) Representative bioluminescence scanning pictures. (D) Quantified bioluminescent signals from mice received AM, ATO, or PLGA treatment (data: mean ± SD).
Discussion
Our initial approach to reach high drug load was to encapsulate ATO molecules by fabricating microspheres and neutralizing saturated solution at the same time. However, most of ATO precipitated once the procedure started and the drug load was low (<1%, data not shown). Interestingly, we observed ATO microcrystals were transiently formed. This observation shed the light that encapsulating ATO microcrystals, but not individual molecules, could be a pathway to achieve high drug load. Previous studies on photochemical etching industry reported that ATO microcrystals could be transiently formed under delicate and highly dynamic electrochemical conditions but were not stable (Li & Bohn, Citation2000; Udupa et al., Citation2018). We developed a straightforward but well-controlled crystallization procedure to generate ATO microcrystal: neutralizing the supersaturated solution under constant sonication. Consistent with previous studies (Li & Bohn, Citation2000; Udupa et al., Citation2018), microcrystal was unstable and rapidly grew to large crystal in aqueous solution. To solve this issue, we replaced the solvent with hydrophobic reagent, DCM, which not only stabilized microcrystal but also made it ready for microsphere fabrication. Through encapsulating ATO microcrystal, we developed PLGA microsphere cored with extremely high density of ATO (ATO:PLGA = 157.4:1, molar ratio). FT-IR showed AM kept the function groups of PLGA and ATO, which confirmed the successful ATO encapsulation (). The encapsulated microcrystal did not grow to large crystal but was stabilized within microsphere for sustained release (). The drug load was over 40%, which is 5–6 folds higher than that of reported ATO-microspheres (Zhou et al., Citation2005, Citation2012) and 4–20 folds higher than that of reported ATO-nanoparticles (Yang et al., Citation2009; Ellison et al., Citation2017; Lu et al., Citation2018; Hu et al., Citation2019; Lian et al., Citation2019). The encapsulation efficiency was 21.6%, which was at the similar level as previously reported studies (Lu et al., Citation2018; Lian et al., Citation2019).
Our studies showed that AM could sustainably release ATO (). Alteration of the environment from the neutral condition (pH 7.4) to acidic condition (pH 6.5 and 5.8) did not have influence on the drug releasing patterns. However, we observed higher concentration of the released ATO from AM at the acidic environment (pH 5.8 and 6.5) from day-1 to day-9. Even though statistical analysis did not show these differences were significant, our observation during the entire time course might imply that acid environment could potentially help to reduce the unreleased fraction of ATO in the microspheres. Our further characterizing studies showed that AM could sustainably induce HCC cells cytotoxicity, which is likely through the induction of ROS and apoptosis ( and ). In subcutaneous experiments, we chose to deliver drugs via intratumoral injection to avoid the drug distribution to other body compartments so we could study the locoregional effects. Our data showed that AM had potent locoregionally antitumoral effects: inducing tumor cell apoptosis, inhibiting tumor cell proliferation, and inhibiting HCC tumor growth by ∼80% (). Interestingly, unlike in vitro data, we did not observe the difference between AM and ATO on their antitumoral effects in subcutaneous experiments. This is probably due to fibrosis induced by repetitive local drug injection, which was observed in many tumor masses (data not shown). Fibrosis could confine non-sustained drugs focally and slow down drug elimination. This would cause drug accumulation at tumor and therefore maintain relatively stable concentration for prolonged period. These changes could alter the pharmacokinetics features of non-sustained formulae, such as ATO, and make them behavior more like sustained formulae, such as AM. Therefore, even though we observed strong antitumoral effect of AM on the subcutaneous model, we decided to further test the chemoembolizing effects of AM and ATO on HCC liver orthotopic xenograft mice model, a procedure designed to mimic the procedure in patients. On our HCC liver orthotopic xenograft model, one chemoembolizing procedure with AM markedly inhibited tumor growth by 60–75% (). The inhibiting effect was 58.5% at day-3 post treatment, and was getting strengthened and reached 75.1% by day-21 post treatment. In contrast to AM, ATO, or vacant PLGA microsphere did not inhibit tumor growth. These data indicated that encapsulating ATO-microcrystal to generate AM is an effective way to make ATO gain the function to chemoembolizing HCC.
We conducted the chemoembolization via portal vein but not hepatic artery due to concerns on high mortality rate caused by the minute size of hepatic artery based on previously published research (Kim et al., Citation2017) and our observation. Portal vein is a well-accepted route in HCC studies and believed the most suitable alternative route if hepatic artery could not be used in animal studies (Bagi & Andresen, Citation2010). Clinically, chemoembolization agents are highly selectively delivered to the hepatic artery branch nourishing tumor by the assistance of radiology (Ueda et al., Citation1998; Lencioni et al., Citation2013; Nam et al., Citation2016; Facciorusso, Citation2018). Due to the diminished size of blood vessel within mice liver, we could not selectively deliver drugs to the branch of blood vessel nourishing tumor but had to use the main stem of portal vein. Even with this relatively unselective route, AM still showed very potent chemoembolization capacity, which is not observed on ATO or the vacant PLGA microsphere. We postulated that AM can reach even higher chemoembolization capacity if we could use more selective route, which could further increase locoregional concentration and reduce drug escaping. As a continue of this work, we plan to further test AM on large animal as the next step. Two recent studies reported the using of ATO microspheres for chemoembolization on rabbit models: one used PLGA microsphere and another one used CalliSpheres® microsphere (Duan et al., Citation2019; Wu et al., Citation2020). Both studies showed promising results, but the inhibitory effects on tumor were not as profound as that of our studies. Therefore, rabbit model would be a suitable model for our next step studies.
While non-resorbable beads are currently used for chemoembolization on clinic, resorbable drug-eluting beads gained a lot of focus as they have advantages of transient embolization, not interfering repeat chemoembolization, and complete drug releasing (Marelli et al., Citation2007; Weng et al., Citation2011; Choi et al., Citation2015; Lee et al., Citation2018). PLGA is a biocompatible and biodegradable polymer and Yang et al. used modified PLGA to form ATO-loaded nanoparticles and reached drug load of 10.08%, the highest previously reported value (Yang et al., Citation2009). In current study, we chose PLGA to make ATO-loaded microspheres and did not observe any adverse effect from PLGA. AM in our study is 4.51 μm in average. Even though we see strong chemoembolization effect of AM, considering the size of liver sinusoid is around 4.3 μm or larger on mice (Yoon et al., Citation2013; Chen et al., Citation2014) and ∼50% of AM made in our study are smaller than that size, large portion of AM still could escape through the sinusoid due to the smaller size. We plan to increase the size of AM for our next step of large animal study. Currently, most of beads used clinically are in the range of 100–300 μm. However, recent clinical studies showed many new generation beads with smaller sizes (∼30 μm) were able to embolize tumor ‘deeper’ and had additional benefit to patients (Malagari et al., Citation2014; Greco et al., Citation2017). Similar result was also found on rat model with smaller size beads (Lee et al., Citation2018). Therefore, it is still inconclusive yet about the optimized size of bead for chemoembolization. Testing different size of AM on large animal would also provide insight for optimizing bead size for TACE.
In this study, we generated and stabilized ATO microcrystal through a novel approach (). By encapsulating ATO microcrystals but not individual molecules, we developed microspheres containing with extremely high density of ATO. FT-IR confirmed the microspheres kept the function groups of PLGA and ATO. The drug load is 40.1%, which is 4–20 folds higher than any reported ATO nano/microparticles. The encapsulation efficiency was 21.6%. Our in vitro and in vivo studies showed AM had strong antitumoral effect. Importantly, chemoembolization with AM but not ATO strongly inhibited tumor growth on HCC orthotopic xenograft model, which indicates the gain-of-function of ATO as a potent chemoembolizing reagent was achieved via our innovative approach.
Acknowledgements
The authors appreciate Drs. Nicolas I. Batalis, MD, Bradley A. Schulte PhD, David A. Lewin, MD, Jody Longo, PhD, and Hongkuan Fan, PhD for their continuous support. The authors thank Ann-Marie Broome, MBA, PhD and Dean Connor, PhD of Animal Imaging Unit and Jessica Welter, BS and Shelby Carter, BS of MUSC Histology and IHC Lab for their technique support.
Disclosure statement
Degang Kong, Tao Jiang, Steven L. Carroll, and Gong Feng are inventors for the pending USA patent entitled ‘Arsenic trioxide microcrystal-load microspheres’, which depicts some of the concepts presented herein. This pending patent is owned by Medical University of South Carolina.
Additional information
Funding
References
- Akhtar A, Xiaoyan Wang S, Ghali L, et al. (2017). Recent advances in arsenic trioxide encapsulated nanoparticles as drug delivery agents to solid cancers. J Biomed Res 31:177–88.
- Bagi CM, Andresen CJ. (2010). Models of hepatocellular carcinoma and biomarker strategy. Cancers (Basel) 2:1441–52.
- Chen J, King K, Zhang JX. (2014). Effect of caloric restriction on hepatic sinusoidal system and stellate cells in mice. J Aging Res 2014:670890.
- Choi JW, Park JH, Baek SY, et al. (2015). Doxorubicin-loaded poly(lactic-co-glycolic acid) microspheres prepared using the solid-in-oil-in-water method for the transarterial chemoembolization of a liver tumor. Colloids Surf B Biointerfaces 132:305–12.
- Daher S, Massarwa M, Benson AA, Khoury T. (2018). Current and future treatment of hepatocellular carcinoma: an updated comprehensive review. J Clin Transl Hepatol 6:69–78.
- Duan XH, Li H, Ren JZ, et al. (2019). Hepatic arterial chemoembolization with arsenic trioxide eluting callispheres microspheres versus lipiodol emulsion: pharmacokinetics and intratumoral concentration in a rabbit liver tumor model. Cancer Manag Res 11:9979–88.
- Ellison PA, Chen F, Goel S, et al. (2017). Intrinsic and stable conjugation of thiolated mesoporous silica nanoparticles with radioarsenic. ACS Appl Mater Interfaces 9:6772–81.
- Facciorusso A. (2018). Drug-eluting beads transarterial chemoembolization for hepatocellular carcinoma: current state of the art. World J Gastroenterol 24:161–9.
- Falchi L, Verstovsek S, Ravandi-Kashani F, Kantarjian HM. (2016). The evolution of arsenic in the treatment of acute promyelocytic leukemia and other myeloid neoplasms: moving toward an effective oral, outpatient therapy. Cancer 122:1160–8.
- Greco G, Cascella T, Facciorusso A, et al. (2017). Transarterial chemoembolization using 40 µm drug eluting beads for hepatocellular carcinoma. World J Radiol 9:245–52.
- Hoonjan M, Jadhav V, Bhatt P. (2018). Arsenic trioxide: insights into its evolution to an anticancer agent. J Biol Inorg Chem 23:313–29.
- Hu HT, Yao QJ, Meng YL, et al. (2017). Arsenic trioxide intravenous infusion combined with transcatheter arterial chemoembolization for the treatment of hepatocellular carcinoma with pulmonary metastasis: long-term outcome analysis. J Gastroenterol Hepatol 32:295–300.
- Hu J, Dong Y, Ding L, et al. (2019). Local delivery of arsenic trioxide nanoparticles for hepatocellular carcinoma treatment. Signal Transduct Target Ther 4:28.
- Huang Y, Zhou B, Luo H, et al. (2019). ZnAs@SiO2 nanoparticles as a potential anti-tumor drug for targeting stemness and epithelial–mesenchymal transition in hepatocellular carcinoma via SHP-1/JAK2/STAT3 signaling. Theranostics 9:4391–408.
- Kalepu S, Nekkanti V. (2015). Insoluble drug delivery strategies: review of recent advances and business prospects. Acta Pharm Sin B 5:442–53.
- Kim M, Fisher DT, Powers CA, et al. (2017). Novel mouse models of hepatic artery infusion. J Surg Res 219:25–32.
- Kritharis A, Bradley TP, Budman DR. (2013). The evolving use of arsenic in pharmacotherapy of malignant disease. Ann Hematol 92:719–30.
- Lee SY, Choi JW, Lee JY, et al. (2018). Hyaluronic acid/doxorubicin nanoassembly-releasing microspheres for the transarterial chemoembolization of a liver tumor. Drug Deliv 25:1472–83.
- Lencioni R, Petruzzi P, Crocetti L. (2013). Chemoembolization of hepatocellular carcinoma. Semin Intervent Radiol 30:3–11.
- Lengfelder E, Hofmann WK, Nowak D. (2012). Impact of arsenic trioxide in the treatment of acute promyelocytic leukemia. Leukemia 26:433–42.
- Li X, Bohn PW. (2000). Arsenic oxide microcrystals in anodically processed GaAs electrochemical growth, spectroscopy, and morphology. J Electrochem Soc 147:1740–6.
- Lian Y, Wang X, Guo P, et al. (2019). Erythrocyte membrane-coated arsenic trioxide-loaded sodium alginate nanoparticles for tumor therapy. Pharmaceutics 12:21.
- Lin CC, Hsu C, Hsu CH, et al. (2007). Arsenic trioxide in patients with hepatocellular carcinoma: a phase II trial. Invest New Drugs 25:77–84.
- Lu Y, Han S, Zheng H, et al. (2018). A novel RGDyC/PEG co-modified PAMAM dendrimer-loaded arsenic trioxide of glioma targeting delivery system. Int J Nanomedicine 13:5937–52.
- Malagari K, Pomoni M, Moschouris H, et al. (2014). Chemoembolization of hepatocellular carcinoma with HepaSphere 30–60 μm. Safety and efficacy study. Cardiovasc Intervent Radiol 37:165–75.
- Marelli L, Stigliano R, Triantos C, et al. (2007). Transarterial therapy for hepatocellular carcinoma: which technique is more effective? A systematic review of cohort and randomized studies. Cardiovasc Intervent Radiol 30:6–25.
- Miller WH, Jr., Schipper HM, Lee JS, et al. (2002). Mechanisms of action of arsenic trioxide. Cancer Res 62:3893–903.
- Nam HC, Jang B, Song MJ. (2016). Transarterial chemoembolization with drug-eluting beads in hepatocellular carcinoma. World J Gastroenterol 22:8853–61.
- Piscaglia F, Ogasawara S. (2018). Patient selection for transarterial chemoembolization in hepatocellular carcinoma: importance of benefit/risk assessment. Liver Cancer 7:104–19.
- Udupa A, Yu X, Edwards L, Goddard LL. (2018). Selective area formation of arsenic oxide-rich octahedral microcrystals during photochemical etching of n-type GaAs. Opt Mater Express 8:289–94.
- Ueda K, Matsui O, Kawamori Y, et al. (1998). Hypervascular hepatocellular carcinoma: evaluation of hemodynamics with dynamic CT during hepatic arteriography. Radiology 206:161–6.
- Wang H, Liu Y, Wang X, et al. (2015). Randomized clinical control study of locoregional therapy combined with arsenic trioxide for the treatment of hepatocellular carcinoma. Cancer 121:2917–25.
- Wang HY, Zhang B, Zhou JN, et al. (2019). Arsenic trioxide inhibits liver cancer stem cells and metastasis by targeting SRF/MCM7 complex. Cell Death Dis 10:453.
- Weng L, Le HC, Lin J, Golzarian J. (2011). Doxorubicin loading and eluting characteristics of bioresorbable hydrogel microspheres: in vitro study. Int J Pharm 409:185–93.
- Wu Y, Du D, Chen J, Liu C. (2020). Preparation of PLGA microspheres loaded with 10-hydroxycamptothecin and arsenic trioxide and their treatment for rabbit hepatocellular carcinoma. Biomed Pap Med Fac Univ Palacky Olomouc Czech Repub.
- Yang GF, Li XH, Zhao Z, Wang WB. (2009). Preparation, characterization, in vivo and in vitro studies of arsenic trioxide Mg–Fe ferrite magnetic nanoparticles. Acta Pharmacol Sin 30:1688–93.
- Yoon YJ, Chang S, Kim OY, et al. (2013). Three-dimensional imaging of hepatic sinusoids in mice using synchrotron radiation micro-computed tomography. PLoS One 8:e68600.
- Zhou J, Wang QH, Liu JH, Wan YB. (2012). Effects of Tat peptide on intracellular delivery of arsenic trioxide albumin microspheres. Anticancer Drugs 23:303–12.
- Zhou J, Zeng F, Xiang G, et al. (2005). Preparation of arsenic trioxide albumin microspheres and its release characteristics in vitro. J Huazhong Univ Sci Technolog Med Sci 25:310–2, 319.