
Abstract
Although the etoposide and carboplatin (EP) combination strategy has been the first-line chemotherapy, patients with extensive-stage disease small-cell lung cancer (SCLC) still have poor survival outcomes. Our retrospective analysis revealed that 46 patients with SCLC only achieved medium overall survival (OS) of 11.6 months after treated by EP. Recently, it was demonstrated that combination therapy of PD1/PD-L1 immune checkpoint blocker and EP could significantly improve the OS of SCLC patients. However, the serious treatment-related toxicity leaded to a high rate of treatment-discontinuation or even death. In the present study, we have developed a novel TPP1-conjugated nanocomplex, abbreviated as TPP1NP-EP, which was co-loaded with carboplatin (CBP) and etoposide (VP16). The TPP1 was a PD-L1 targeting peptide and conjugated on the surface of nanocomplex by a matrix metalloproteinase (MMP-2/9)-cleavable peptide linker sequence PLGLAG. For dual-loading of CBP and VP16, the CBP was chemically conjugated with poly(ethylene glycol) (PEG)–poly(caprolactone) (PCL) by pH-sensitive hydrazone bond and the VP16 was physically encapsulated by emulsion-solvent evaporation method. In vitro and in vivo experiments demonstrated an excellent anti-tumor effect of TPP1NP-EP on SCLC and improved safety. In conclusion, the present study has provided a promising strategy for treatment of malignant SCLC.
1. Introduction
Small-cell lung cancer (SCLC) is one of the most aggressive cancer types which accounts for 10–15% of lung cancer cases (Waqar & Morgensztern, Citation2017; Siegel et al., Citation2021). Among patients with SCLC, 70% of patients present with extensive-stage disease (ED-SCLC) characterized by rapid doubling time and sensitivity to both chemotherapy and radiation (Ou et al., Citation2009; Zhou et al., Citation2020; Tapan et al., Citation2021). Platinum-based chemotherapy of etoposide plus either cisplatin or carboplatin (EP) is currently the first-line standard of care for SCLC (Okamoto et al., 2007). Although high initial response rates were obtained by EP treatments, most of patients with ED-SCLC experience rapid progression and resulted in a poor overall survival (OS) time (Heigener et al., Citation2009; Gao et al., Citation2014). Additionally, high incidence rate of toxic effects such as neutropenia and anemia significantly impaired the final treatment effects (Karam et al., Citation2015; Jones et al., Citation2020). Consistent with previously reports (Heigener et al., Citation2009; Gao et al., Citation2014), our retrospective analysis revealed that patients with SCLC only achieved medium OS of 11.6 months after treated by EP. Besides, most of the patients discontinued the treatments because of serious toxic effects.
Although multiple other chemotherapeutic agents have been evaluated on patients with ED-SCLC, they were failed to achieve a significant improvement in OS over EP (Kubota et al., Citation2014; Goto et al., Citation2016; Kenmotsu et al., Citation2020). Recently, use of immunotherapy in SCLC has been rationalized by several lines of evidence (Calles et al., Citation2021). The high frequency of somatic mutations in SCLC, along with the presence of autoimmune paraneoplastic syndromes, suggests that SCLC is an immunogenic tumor type (Melosky et al., Citation2020). Immunotherapy targeting the programmed cell death 1 (PD-1, also known as PDCD1) and programmed cell death ligand 1 (PD-L1, also known as CD274) pathway has demonstrated clinical activity for patients with ES-SCLC (Saleh et al., Citation2019; Konala et al., Citation2020; Ragavan & Das, Citation2020). However, mono-therapy of malignant cancer by immune checkpoint inhibitors is always blamed for insufficient treatment efficacy.
Currently, chemo-immunotherapy is becoming one of the most promising and encouraging strategies to improve the survival outcomes of SCLC (Farid & Liu, Citation2020; Zhang et al., Citation2020; Chen et al., Citation2021). It has been demonstrated that most of chemotherapeutics were able to enhance the toll-like receptor activity and promote the DCs activation (Rocco et al., Citation2019). Based on this, multiple trials involving chemo-immunotherapy combinations have been conducted and results demonstrated that it could significantly improve OS of patients with extensive SCLC (Paz-Ares et al., Citation2019; Facchinetti et al., Citation2020; Galluzzi et al., Citation2020). However, severe toxicities due to off-target effects always occurred in patients who received such combination therapies (Gomez et al., Citation2001).
Extensive preclinical researches have demonstrated that nanotechnology can overcome some of the challenges that currently limit chemo-immunotherapy combination (Kadiyala et al., Citation2019; Guo et al., Citation2020; Yang et al., Citation2020). In the present study, a novel nanocomplex abbreviated as TPP1NP-EP was developed for chemo-immunotherapy of SCLC. To achieve that goal, the CBP was chemically conjugated with poly(ethylene glycol) (PEG)–poly(caprolactone) (PCL) by pH-sensitive hydrazone bond followed by preparation of drugs-loaded nanocomplexes. Simultaneously, the VP16 was physically encapsulated into the inner hydrophobic core by emulsion-solvent evaporation method to form the EP nanocomplexes (NP-EP). TPP1 is a PD-L1 targeting peptide and previous study has demonstrated that it possessed excellent tumor affinity and ability to inhibit tumor growth by blocking the PD-1/-D-L1 axis (Li et al., Citation2018). In this case, the surface of NP-EP was further decorated with TPP1 peptides for realizing tumor targeting drug delivery and immunotherapy. Importantly, the peptides were conjugated on the surface of nanocomplexes by the MMP-2/9-cleavable linker sequence PLGLAG (Olson et al., Citation2010). By this way, the anti-tumor effect of TPP1 could be completely released after entrapped into the inner tumor.
2. Materials and methods
2.1. Materials
The carboplatin-conjugated R-carboxyl–poly(ethylene glycol)–poly(caprolactone) (CBP-PCL-PEG-COOH) was synthesized by Seebio Co., Ltd. (Shanghai, China). Etoposide and carboplatin were purchased from Xi’an Sanjiang Bio-Engineering Co. Ltd. (Xi’an, China). Functionalized TPP1 peptide with sequence of SGQYASYHCWCWRDPGRSGGSKPLGLAG-NH2 was provided by GL Biochem (Shanghai, China). The Annexin V-FITC Apoptosis Detection kit was purchased from BD PharMingen (Heidelberg, Germany). The CD31 primary antibody and Alexa flour 488-labeled goat anti-rabbit secondary antibody were provided by Abcam (Cambridge, UK). 1,1′-dioctadecyl-3,3,3′,3′-tetramethylindotricarbocyanine iodide (DiR), 3-[4,5-dimethylthiazol-2-yl]-2,5-diphenyl tetrazolium bromide (MTT), and 4,6-diamidino-2-phenylindole (DAPI) were obtained from Sigma-Aldrich (St. Louis, MO). All the other chemical reagents and solvents were obtained from Sinopharm Chemical Reagent Co., Ltd. (Shanghai, China) unless specified otherwise.
2.2. Cell lines and animals
The human small cell lung cancer cells (NCI-H69) were obtained from Chinese Academy of Sciences Cell Bank (Shanghai, China). Cells were cultured in DMEM supplemented with 10% FBS and 1% penicillin–streptomycin solution under 5% CO2 at 37 °C. The male nude mice (6 weeks old around and weight of 20 ± 2 g) were obtained from Slac Animal Ltd. (Shanghai, China) and raised under standard housing conditions. All animal experiments were performed in accordance with guidelines evaluated and approved by Yancheng Hospital.
2.3. Retrospective analysis of ED-SCLC patients treated with EP
In the first part of this study, we have retrospectively enrolled 46 patients referred with pathologically confirmed small cell lung cancer. All the patients were received with platinum and etoposide combination regimens. For anti-tumor effect evaluation, OS was determined. Besides, the safety profiles of these patients after EP treatment were also evaluated.
2.4. Development of immunoconjugates nanocomplexes
2.4.1. Development of NP-EP
Dual drugs-loaded nanocomplexes were prepared using the previously reported emulsion-solvent evaporation method with slight modification (Feng et al., Citation2015). In brief, 40 mg CBP-PCL-PEG-COOH and 0.4 mg VP16 were dissolved in 4 mL of dichloromethane. Then, the solution was poured into 4 mL of 1% sodium cholate solution followed by ultrasonication at 260 W for 3 min using the probe sonicator (Ningbo Scientz Biotechnology Co. Ltd., Ningbo, China). Then, the formed nanocomplex solution was poured into 10 mL 0.5% sodium cholate solution. After mixing for 10 min, the solution was evaporated by the ZXB98 rotavapor (Shanghai Institute of Organic Chemistry, Shanghai, China) to remove the residual organic solvent. Finally, the NP-EP were purified by centrifugation at 14,000 rpm for 1 h with the supernatant removed.
2.4.2. TPP1 peptides conjugation
Conjugation of TPP1 peptides on the surface of NP-EP was realized using the classical amidation reaction (Feng et al., Citation2015). The collected NP-EP were dissolved by 4 mL distilled water and co-incubated with NHS (100 mM) and EDC (200 mM) for 1 h. Then, TPPI peptide solution was added and incubated with NP-EP solution at a molar ratio of 3:1. After 6 h of reaction, the developed TPP1NP-EP were purified by centrifugation at 14,000 rpm for 1 h.
2.5. Characterization of TPP1NP-EP
2.5.1. Physicochemical characterization of TPP1NP-EP
The particle sizes and zeta potentials of NP-EP and TPP1NP-EP were determined using the dynamic light scattering detector (Zetasizer, Nano-ZS, Malvern, UK). For morphology examination, both of NP-EP and TPP1NP-EP were stained with 1% uranyl acetate solution followed by observation under the transmission electron microscope (JEOL Ltd., Tokyo, Japan).
2.5.2. Stability study
The stability of TPP1NP-EP was evaluated by incubation of nanocomplexes in DMEM containing 10% FBS at 37 °C. Then, the particle size changes of TPP1NP-EP were investigated. At predetermined time points in week (1, 2, 3, 4, 5, 6, and 7 days), 2 mL nanocomplexes solution was obtained for particle size examination using the dynamic light scattering analysis. For comparison, the stability of NP-EP was investigated as well. Besides the particle size, zeta-potential changes of NP-EP and TPP1NP-EP were determined as well.
2.5.3. Drug release
Drug release behaviors of TPP1NP-EP were respectively investigated in pH 6.0 (mimics the acidic tumor microenvironment) and pH 7.4 (normal physiological environment). For experiments, TPP1NP-EP were dissolved by 1 mL release medium and then poured into a dialysis bag. After that, the samples were immerged into 50 mL release medium and incubated on a shaker with a speed of 120 rpm for 48 h. At predetermined time points, 200 μL of release samples were collected for drug concentration detection.
2.6. Cell uptake assay
2.6.1. Qualitative and quantitative analyses of cellular association of nanocomplexes
For cell uptake assay, both of NP-EP and TPP1NP-EP were labeled with FITC for visualization of nanocomplexes. NCI-H69 cells were seeded in 96-well plates at the density of 5 × 10³ cells/well and allowed to grow for 24 h. Then, the cells were respectively incubated with 100 μg/mL or 200 μg/mL of NP-EP and TPP1NP-EP. After 2 h or 4 h incubation, the cells were washed twice by cold PBS and fixed by 4% paraformaldehyde. Finally, the cells were analyzed under the fluorescent microscopy (Leica DMI4000 B, Wetzlar, Germany). Quantitative analysis was performed using the Flow Cytometer system (BD Biosciences, Franklin Lakes, NJ).
2.6.2. Cell uptake mechanisms study
For cell uptake mechanisms study, NCI-H69 cells were seeded in 96-well plates at the density of 5 × 10³ cells/well. After 24 h of culture, various endocytosis inhibitors were added and incubated with cells for 1 h. Then, the old medium was removed and cells were washed twice by cold PBS. After that, the cells were respectively incubated with 100 μg/mL of NP-EP and TPP1NP-EP. One-hour later, the cells were washed with cold PBS again and collected for further quantitative analysis by the Flow Cytometer system.
2.6.3. Lysosomal co-location assay
Lysosomal co-location assay was performed to investigate the distribution of nanocomplexes within cells. NCI-H69 cells were seeded in 24-well plates at the density of 1 × 10⁴ cells/well and allowed to grow for 24 h. Then, the cells were respectively incubated with 100 μg/mL of NP-EP and TPP1NP-EP. After incubation for 2 h or 4 h, each well of the plates was supplemented with 50 nmol/L Lysotracker Red and incubated for 30 min. Finally, the cells were washed twice by cold PBS and fixed by 4% formaldehyde before analyzing through the confocal microscope (TCS SP5, Leica, Wetzlar, Germany).
2.7. Anti-tumor effect of TPP1NP-EP in vitro
2.7.1. Anti-proliferation assay
NCI-H69 cells were seeded in 96-well plates at the density of 5 × 10³ cells/well and cultured for 24 h. Then, the cells in plates were respectively treated with 100 μg/mL of NP, NP-EP, and TPP1NP-EP. The untreated cells were used as the control group. After incubation for 0, 12, 24, or 48 hours, 100 μL MTT solution (5 mg/mL) was added into each well and incubated with cells for 4 h. Then, 150 μL dimethylsulfoxide was added and reacted with cells for 10 min followed by detection at 70 nm by a microplate reader (PerkinElmer, Waltham, MA).
2.7.2. Cell apoptosis assay
Apoptosis of NCI-H69 cells induced by TPP1NP-EP was determined using the PE Annexin V Apoptosis Detection Kit I (BD, San Diego, CA). For experiments, NCI-H69 cells were seeded in 24-well plates at the density of 1 × 10⁴ cells/well. After 24 h of culture, 100 μg/mL of NP-EP and TPP1NP-EP were respectively added into each well and allowed to incubation with cells for 24 h. For qualitative analysis, the cells were washed twice by cold PBS and fixed by 4% formaldehyde followed by detection under the fluorescent microscopy. For quantitative analysis, cells were harvested and washed twice by cold PBS followed by pouring into 500 μL of binding buffer. After incubation with annexin V, the cells were analyzed using the Flow Cytometry system.
2.7.3. Cell migration assay
Lateral migration and vertical migration were respectively evaluated by wound healing assay and trans-well assay. For wound healing assay, NCI-H69 cells were seeded in 96-well plates at the density of 1 × 10⁴ cells/well and allowed to grow for 95% confluence. Then, a linear scratch was created on the cell monolayer surface by a 150 μL sterile pipette tip. After that, the cells in plates were respectively treated with 100 μg/mL of NP, NP-EP, and TPP1NP-EP for 24 h. The untreated cells were used as the control group. Lateral migration of cells was evaluated by determination of wound healing rate.
For trans-well assay, 1 × 10⁴ NCI-H69 cells were cultured in the top chamber while the lower chamber was coated with 1 mL of fresh medium. After 24 h of incubation, the unattached cells were removed and migrated cells were fixed with 4% paraformaldehyde. For visualization of the migrated cells, 0.5% crystal violet was added and incubated with cells for 10 min. Finally, the migrated cells were qualitatively analyzed under an inverted light microscope followed by semi-quantitative analysis.
2.8. Tumor targeting ability of TPP1NP-EP in vivo
2.8.1. Establishment of tumor-bearing mice models
The SCLC-bearing mice models were prepared by the previously reported subcutaneous transplantation method with slightly modification (Feng et al., Citation2016). 5 × 10⁶ NCI-H69 cells were resuspended by 100 µL FBS free DMEM. Then, the cell solution was subcutaneously injected into the right flanks of mice. The tumor-bearing mice were raised under standard condition with free access to water and food.
2.8.2. In vivo imaging of drug distribution
When the transplanted tumors grow to 100–200 mm3, the tumor-bearing mice were randomly grouped (n= 6) and treated by NP-EP and TPP1NP-EP, respectively. For visualization of nanocomplexes, both NP-EP and TPP1NP-EP were labeled with DiR. Then, the distribution of nanocomplexes in vivo was monitored at different time points (6 h, 12 h, and 24 h) by an In Vivo IVIS spectrum imaging system (PerkinElmer, Waltham, MA). Twenty-four hours later, mice in each group were euthanized and primary organs (heart, liver, spleen, lung, and kidney) and tumor tissues were obtained for qualitative and semi-quantitative analyses.
2.8.3. Distribution of TPP1NP-EP in tumor tissues
The tumor-bearing mice with tumor volume of 100–200 mm3 were randomly grouped (n = 6) and treated by FITC-labeled NP-EP and TPP1NP-EP. Three hours later, all mice were anesthetized with tumor tissues were collected and immerged in 4% paraformaldehyde. After overnight, 14 µm tumor slides were prepared and treated with 0.2% Triton X-100 followed by incubation with primary rabbit anti-CD31 antibodies for an overnight. Finally, Alexa555®-conjugated goat anti-rabbit IgG secondary antibodies were added and incubated with the slides for 1 h before detection under a confocal microscope.
2.9. Anti-tumor effect in vivo
For evaluation of anti-tumor effect in vivo, tumor-bearing mice with tumor volume of 100–200 mm3 were randomly grouped (n = 10) and treated by NP, NP-EP, and TPP1NP-EP. Then, the tumor growth assay, survival evaluation, and other relative experiments were performed as below.
2.9.1. Tumor growth assay
For tumor growth assay, the above treated mice were raised under the standard condition with tumor volume changes of each mouse carefully calculated by the formula: Volume = 0.5 × length×(width)2. The tumor volume changes were recorded every three days in a month.
2.9.2. Survival evaluation
For survival evaluation, the deaths in each group were carefully recorded for finally Kaplan–Meier’s curve analysis. At the end of tumor growth experiments, the mice were euthanized with tumor tissues collected for further analysis.
2.9.3. Western blot assay
Cells or tumor tissues were obtained after the above experiments were conducted. Then, the obtained samples were completely homogenized and lysed in radioimmunoprecipitation assay lysis buffer. After two-hour incubation in ice, the protein concentrations were quantified by a bovine serum albumin standard line. Then, the protein samples were separated using sodium dodecyl sulfate polyacrylamide gel electrophoresis followed by transferring to polyvinylidene fluoride membranes. After that, the samples were incubated with 5% skimmed milk for 4 h before incubation with anti-PD-L1 (1:1000; Sigma-Aldrich, St. Louis, MO). After an overnight incubation, secondary antibodies were added and incubated with samples for 1 h. Finally, qualitative and semi-quantitative analyses were performed by an ECL plus chemiluminescence kit (Millipore, Bedford, MA).
2.10. Safety evaluation in vivo
Safety evaluation of the developed nanocomplexes in vivo was performed on normal mice by investigating the histiocytic injury of primary organs and hematologic and biochemical parameters after various treatments. For experiments, the randomly grouped normal mice (n = 10) were treated by NP, NP-EP, and TPP1NP-EP. The mice injected with saline were used as the control. After a total of three times treatment in a week, blood samples were obtained for serum collection by centrifugation (3000 rpm for 10 min). Subsequently, the major hematological and biochemical parameters including white blood cell (WBC) count, red blood cell (RBC) count, platelet (PLT) count, alanine aminotransferase (ALT) levels, aspartate aminotransferase (AST) levels, blood urea nitrogen (BUN) levels, and creatinine (CREA) levels, and others were examined. Besides, primary organs of the treated mice including heart, liver, spleen, lung, and kidney were collected for histiocytic injury analysis by H&E staining.
2.11. Statistical analysis
All the data were presented as mean ± standard deviation. Unpaired Student’s t-test was used for between two-group comparison and one-way ANOVA with Bonferroni’s tests for multiple-group analysis. Statistical significance was defined as p<.05.
3. Results and discussion
3.1. Retrospective analysis of ED-SCLC patients treated with EP
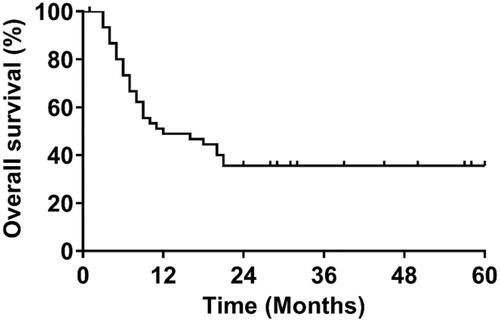
The patient characteristics are shown in . Of the 46 patients that received systemic EP combination treatment, 26 (56.5%) were less than 65 years old, 25 (54.3%) were male, 42 (91.3%) had stage III–IV disease, and 36 (78.3%) had an initial extensive disease. For treatments, 16 (34.8%) patients received four or less cycles of EP treatments while 11 (23.9%) and 19 (41.3%) patients received 5 and 6 cycles of EP treatments, respectively. The average treatment cycle was 4.98. At the time of data cutoff, 39 (84.8%) of 46 patients had disease progression or died with a median OS of 11.6 months ().
Table 1. Patient characteristics (N = 46).
For safety evaluation, adverse events of any cause and grade occurred in 45 (98%) of 46 patients while grade 3 or 4 adverse events occurred in 34 (74%) patients. Treatment discontinuation and death due to adverse events occurred in eight (17%) patients and four (8%) patients, respectively. The most common grade 3 or 4 adverse events were neutropenia and anemia.
3.2. Characterization of TPP1NP-EP
Use of nano-vehicles for targeting drug delivery has been one of the most clinically important applications of cancer nanotechnology (Wagner et al., Citation2006). Past decades have witnessed that extensive studies were conducted in the field of tumor targeting therapy by biodegradable polymeric nanoparticles (Liu et al., Citation2018; Chen et al., Citation2019; Qiao et al., Citation2019). Due to the unique characteristics of biodegradable, biocompatible, and functionable, PCL has been widely used in the formulation of drug delivery systems for tumor targeting therapy (Gou et al., Citation2011; Danafar et al., Citation2017). In the present study, a novel CBP-conjugated co-polymer was first developed based on the PEG-PCL. Then, dual-drugs loaded nanocomplexes were formed by emulsion-solvent evaporation method and its surface were functionalized with PD-L1 targeting peptides TPP1.
Figure 1. Kaplan–Meier’s curve of overall survival.
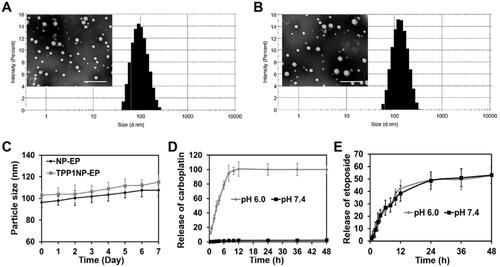
NMR characterization of co-polymer confirmed the successful synthesis of CBP-PCL-PEG-COOH with conjugation efficiency of 71.5% (Supplemented Figure S1). For nanocomplexes characterization, it was revealed that NP-EP showed an average particle size of 96.36 nm. For TPP1NP-EP, the particle size was 103.21 nm which indicated that conjugation of TPP1 peptides did not significantly change the particle size (). Zeta potentials were further examined and results showed that there were no significant differences between the values of NP-EP (–21.63 mV) and TPP1NP-EP (–18.77 mV). Additionally, the stabilities of NP-EP and TPP1NP-EP were subsequently determined in the medium of DMEM. As shown in , both NP-EP and TPP1NP-EP displayed excellent stability with no significant particle size changes during one-week incubation. Moreover, the stability of zeta potentials of NP-EP and TPP1NP-EP was determined as well. Results show that no significant changes were observed for both NP-EP and TPP1NP-EP during a week of incubation (Supplemented Figure S2), further confirmed a relatively good stability for those prepared nanocomplexes.
Figure 2. Physicochemical properties of nanocomplexes characterized in vitro. (A) TEM image and particle size distribution of NP-EP. The bar represents 200 μm. (B) TEM image and particle size distribution of TPP1NP-EP. The bar represents 200 μm. (C) Stabilities of NP-EP and TPP1NP-EP investigated by incubation of nanocomplexes in DMEM and the particle size changes were determined at every day in a week. (D) The release behavior of carboplatin was respectively investigated in medium of pH 6.0 and pH 7.4. (E) The release behavior of etoposide was respectively investigated in medium of pH 6.0 and pH 7.4.
3.3. Release behavior of TPP1NP-EP in vitro
In the present study, to ensure the conjugated carboplatin can completely release from TPP1NP-EP, the carboplatin was conjugated with PCL polymer by the pH-sensitive hydrazone bond. In this case, the release behavior of TPP1NP-EP was respectively investigated in pH 6.0 and pH 7.4. As shown in , negligible signal of carboplatin was detected in the release medium of pH 7.4. However, burst release behavior was obtained in the medium of pH 6.0 with more than 95% of carboplatin released from TPP1NP-EP within 6 h. Furthermore, the release behavior of etoposide was evaluated as well. It was revealed that similar cumulative etoposide release was obtained in the medium of pH 6.0 than the pH 7.4 (). Besides, controlled-release behavior of etoposide was observed in both of pH 6.0 and pH 7.4.
3.4. Cell uptake of nanocomplexes in vitro
3.4.1. Quantitative and quantitative analysis of cellular association of nanocomplexes
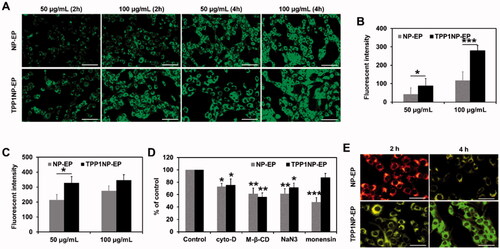
Cellular association of TPP1NP-EP was determined on the NCI-H69 cell lines and compared with NP-EP. As shown in , the fluorescent intensity in the TPP1NP-EP group was significantly stronger than the NP-EP group at any nanocomplex concentrations or incubation time. These results indicated that TPP1NP-EP have higher tumor cell affinity than NP-EP due to the modification of TPP1 peptides. Further, semi-quantitative analysis was subsequently performed. After incubation of cells with nanocomplexes for 2 h, cell uptake of TPP1NP-EP was 2.76 and 1.23 folds of the NP-EP at concentration of 50 and 100 μg/mL, respectively (). However, there was no significant difference between the group of NP-EP and TPP1NP-EP after incubation of 100 μg/mL nanocomplexes with cells for 4 h (). It was mainly because excess incubation time saturated the cellular association of nanocomplexes.
Figure 3. Cell uptake of nanocomplexes on NCI-H69 cell lines. (A) Qualitative analysis of cell uptake of nanocomplexes at different concentrations and times. The nanocomplexes were labeled with FITC for visualization. The bar represents 100 μm. (B) Quantitative analysis of cell uptake of nanocomplexes at different concentrations after incubation for 2 h. (C) Quantitative analysis of cell uptake of nanocomplexes at different concentrations after incubation for 4 h. (D) Cell uptake mechanisms investigated by incubation cells with nanocomplexes in the presence of various endocytosis inhibitors (including cyto-D, M-β-CD, NaN3, and monensin). (E) Distribution of nanocomplexes in cells was evaluated by the lysosomal co-location assay. The bar represents 50 μm.
3.4.2. Investigation of cell uptake mechanisms
Cell uptake of nano-vehicles is a complex process which always involves multiple mechanisms such as caveolae-mediated endocytosis and caveolae-independent endocytosis (Liu & Shapiro, Citation2003). In the present study, the underlying cell uptake mechanism was determined by pretreating cells with various endocytic inhibitors. As shown in , cell uptake of NP-EP and TPP1NP-EP was both significantly inhibited by the cyto-D, methyl-β-cyclodextrin (M-β-CD), and NaN3, indicating that cell uptake of NP-EP and TPP1NP-EP was both clathrin and lipid raft-mediated, microtubule involved, and energy-dependent. Importantly, it was further revealed that cell uptake of NP-EP while not TPP1NP-EP was significantly restricted by monensin which suggested that endosomes were involved in the cellular association of NP-EP while not TPP1NP-EP.
3.4.3. Lysosomal colocalization study
As demonstrated above, cellular association of NP-EP was dramatically restricted by monensin pretreatment. However, the inhibition effect was almost eliminated after modification of TPP1 peptides on the surface of NP-EP suggesting TPP1 decoration might contribute to the lysosomes escape. For verification, lysosomal colocalization study was subsequently investigated. As demonstrated in , it was observed that most nanocomplexes were coexisted with endosomes in the group of NP-EP while not TPP1NP-EP.
3.5. Antitumor effect of TPP1NP-EP in vitro
3.5.1. Anti-proliferation assay
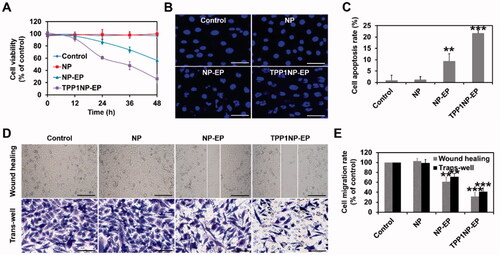
Proliferation of NCI-H69 cells after different treatments was determined using the MTT assay. As profiled in , cells receiving treatment of blank NP displayed negligible anti-proliferation effect compared with control group which indicated an excellent biocompatibility for NP prepared here at cellular level. However, after loaded with EP, the anti-proliferation effect was dramatically elevated with cell viability being significantly decreased. Moreover, modification of TPP1 peptides further dramatically increased the anti-proliferation effect with cell viability down-regulated to the lowest level.
Figure 4. Anti-tumor effect of nanocomplexes in vitro evaluated on NCI-H69 cell lines. (A) Cell viability of NCI-H69 cells post treatment of NP, NP-EP, and TPP1NP-EP. The cells only incubated with medium were used as the control group. (B) Qualitative analysis of cell apoptosis induced by different nanocomplexes. The bar represents 100 μm. (C) Quantitative analysis of cell apoptosis rate induced by different nanocomplexes. (D) Lateral migration and vertical migration ability of NCI-H69 cells post different treatments determined by the wound-healing assay and trans-well assay, respectively. The bar represents 100 μm. (E) Semi-quantitative analysis of migration rate of NCI-H69 cells post different treatments. **p<.01, and ***p<.001 indicate the statistical difference versus control group.
3.5.2. Cytotoxicity of nanocomplexes to NCI-H69 cells
Cytotoxicity of nanocomplexes to NCI-H69 cells was evaluated by qualitative and quantitative analyses. As shown in , negligible signal of fragmentation was detected in the group of control and NP group. Conversely, after treated by NP-EP, the fragmentation of nuclei was dramatically increased than the control group. Moreover, the segmentation and unsharp borders were further elevated after incubation cells with TPP1NP-EP. Such results were further confirmed by quantitative analysis with the cells treated by TPP1NP-EP achieving the highest apoptosis rate, followed by NP-EP ().
3.5.3. Lateral migration ability evaluated by the wound-healing assay
Motility of tumor cells is generally associated with cancer metastasis. In the present study, the lateral motility of NCI-H69 cells was evaluated by wound healing assay. As shown in , the cells treated with blank NP exhibited the fast wound-healing rate and confluence to nearly 100% of the control group. However, wound-healing rate was significantly down-regulated in the group of NP-EP. After modification of TPP1, lateral migration inhibition effect was further markedly enhanced.
3.5.4. Vertical migration ability determined by the trans-well experiments
Furthermore, vertical motility of NCI-H69 cells was evaluated by trans-well assay. As shown in , the cells treated with blank NP exhibited the fast vertical migration rate. In the group of NP-EP, relative less amount of crystal violet was observed than the blank NP and control group. After modification of TPP1 peptides, the vertical migration ability of cells was further significantly inhibited with lowest amount of crystal violet obtained.
3.5.5. Inhibition of PD-L1 expression by treatment of TPP1NP-EP
The TPP1 peptide was designed to target PD-1/PD-L1 axis. Previous study has demonstrated excellent anti-tumor activity of TPP1 by inhibition of PD-L1 expression (Li et al., Citation2018). In the present study, TPP1 modified nanocomplexes displayed super anti-tumor ability on cellular levels than the NP-EP. To verify the PD-L1 inhibition effect of TPP1, cells post various treatments were collected for molecule detection. As shown in Supplemented Figure S3, the cells treated by TPP1NP-EP displayed the lowest level of PD-L1. Conversely, a relative higher level of PD-L1 was detected in the NP-EP group than control or NP group.
3.6. Tumor targeting assay on SCLC-bearing mice models
3.6.1. Biodistribution of TPP1NP-EP in vivo
Generally, tumor targeting drug delivery in vivo was affected by multiple factors such as the macrophages of the reticuloendothelial system existing in blood circulation (Moghimi & Hunter, Citation2001). In the present study, tumor targeting ability of TPP1NP-EP in vivo was investigated on the prepared SCLC-bearing mice models and compared with NP-EP. As demonstrated by in vivo IVIS spectrum imaging system, stronger fluorescent signal was observed at the tumor tissues from the group of TPP1NP-EP than the NP-EP at any time points (). Semi-quantitative analysis further confirmed that the amount of TPP1NP-EP accumulated at tumor sites was 3.48 folds of the NP-EP (). Besides, accumulation of TPP1NP-EP at normal tissues (mainly including the heart, liver, spleen, lung, and kidney) was slightly lower than the NP-EP in spite of no significant differences.
Figure 5. In vivo tumor targeting assay was performed on SCLC-bearing mice models. (A) In vivo imaging of SCLC-bearing mice after respectively injected with DiR-labeled NP-EP and TPP1NP-EP. (B) Ex vivo imaging of dissected organs (heart, liver, spleen, lung, kidney, and tumor) at 24 h post injection of nanocomplexes. (C) Semi-quantitative analysis of bio-distribution of nanocomplexes in SCLC-bearing mice models. (D) Distribution of nanocomplexes in tumor tissues with the red represents vessels stained with CD-31, the blue represents nuclei stained with DAPI, and the green represents nanocomplexes labeled with FITC. The bar represents 200 μm. ***p<.001 indicates the statistical difference versus NP-EP group.
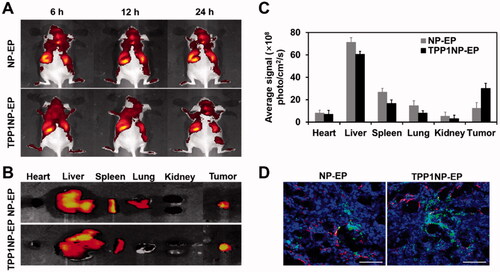
3.6.2. Distribution of nanocomplexes in tumor tissues
Despite the reticuloendothelial system, limited tumor tissue penetration and vascular permeability of therapeutic agents represents other obstacles for successful treatment of cancer (Minchinton & Tannock, Citation2006; Jiang et al., Citation2013). The distribution of nanocomplexes in tumor tissues was evaluated here. As demonstrated in , stronger fluorescent intensity was observed in the group of TPP1NP-EP than NP-EP. Additionally, most of NP-EP was only accumulated around vascular with limit penetration into tumor tissue inner. However, most of TPP1NP-EP detected in tumor parenchyma indicated TPP1NP-EP was able to deliver drug into the interior of tumor tissues.
3.7. Anti-tumor effect of TPP1NP-EP on SCLC-bearing mice models
3.7.1. Tumor growth inhibition
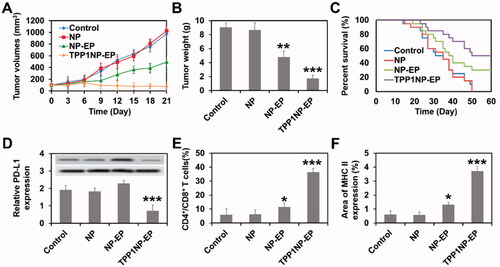
As shown in , tumor growth rate in the group of control was fast with average tumor volume growth from 103.26 mm3 to 980.33 mm3 within 21 days. Similar tumor growth rate in control group was obtained for blank NP treated mice. However, the tumor growth was significantly inhibited after NP was loaded with EP with average tumor weight down-regulated from 8.6 g (NP group) to 4.8 g (). Importantly, highest anti-tumor effect was achieved in mice treated by TPP1NP-EP due to the higher accumulation of drugs at tumor site and increased cytotoxicity by the synergetic chemo-immunotherapy.
Figure 6. Anti-tumor effect of TPP1NP-EP evaluated on SCLC-bearing mice models. (A) Tumor growth after treated with blank NP, NP-EP, and TPP1NP-EP. (B) Tumor weight of mice from each group at 21 days post injection of various nanocomplexes. (C) Kaplan–Meier’s survival analysis of SCLC-bearing mice post treatment with blank NP, NP-EP, and TPP1NP-EP. (D) Relative PD-L1 expression in tumor tissues from each group after treatment of various nanocomplexes. (E) The percentages of CD4+ and CD8+ T cells in tumor tissues after treatment of various nanocomplexes. (F) Relative MHC II expression in tumor tissues after treatment of various nanocomplexes.
3.7.2. Kaplan–Meier’s survival analysis
Medium survival time of SCLC-bearing mice post various treatments was evaluated by Kaplan–Meier’s survival analysis. As shown in , similar Kaplan–Meier’s survival curve was observed between the group of control and NP with medium survival time 19.5 days and 21.0 days (not significant), respectively. In the group of NP-EP, the Kaplan–Meier survival curve was significantly prolonged with medium survival time improved from 21.0 days (NP group) to 35.5 days. Of great importance, the SCLC-bearing mice received combination chemo-immunotherapy (TPP1NP-EP) achieving the longest survival time of 51.5 days.
3.7.3. Reprograming tumor immune microenvironment
In spite of tumor targeting ability, TPP1 was also designed to reprogram tumor immune microenvironment by blocking PD-1/PD-L1 interaction (Li et al., Citation2018). To evaluate the effect of TPP1 functionalized nanocomplexes on reprograming SCLC immune microenvironment, tumor tissues were obtained after above tumor growth experiments for molecule detection. As demonstrated in , tumor tissues in mice treated by TPP1NP-EP exhibited the lowest level of PD-L1 indicating a down-regulation effect of TPP1NP-EP on the expression of PD-L1. Interestingly, tumor tissues in mice treated by NP-EP have a slightly higher but not significant level of PD-L1 than control or NP group which suggested that chemotherapy was facilitated to the expression of immunotherapy biomarkers.
Furthermore, it was previously reported that TPP-1 was able to attenuate the inhibitory effect of PD-L1 on T cells and finally activating the T cells by increasing the levels of IFNγ (Li et al., Citation2018). For verification, tumor tissues from each group were obtained for further analysis. As shown in , percentages of CD4+ and CD8+ T cells in tumor tissues from the group of NP and control were nearly same. After treatment of NP-EP, the percentages of CD4+ and CD8+ T cells were increased and higher than control or NP group. Moreover, highest level of CD4+ and CD8+ T cells was achieved by treating mice with TPP1NP-EP with the average percentage increased from 11.32% (NP-EP) to 36.34%. Besides, the proinflammatory cytokines IFNγ was determined as well. Similar results are obtained in with highest levels of IFNγ secretion obtained in the group of TPP1NP-EP. These results together confirmed that TPP1NP-EP was able to reprogram tumor immune microenvironment.
3.8. Safety evaluation in vivo
Finally, safety evaluation in vivo was performed by determination of multiple serum biochemical indicators after different treatments. As shown in , treatment of TPP1NP-EP did not induce significant changes on hematological index (RBC, WBC, PLT, HGB, MPV, and PDW) and hepatorenal function (ALT, AST, ALP, BILT, BUN, and CRE). However, in the group of NP-EP, the hematological index and hepatorenal function were impaired slightly with relative indexes slightly increased compared with control or NP group. It was mainly because NP-EP was accumulated more at normal tissues than TPP1NP-EP.
Table 2. Safety evaluation in vivo investigated by determination of multiple serum biochemical indicators after different treatments.
For H&E staining, results confirmed that there were no significant microscopic changes of main organs in normal mice at the current therapeutic dosage (Supplemented Figure S2). These results together demonstrated that developed TPP1NP-EP possess excellent biocompatibility and good safety for drug delivery in vivo.
4. Conclusions
To achieve the goal of chemo-immunotherapy of SCLC, a novel nanocomplex abbreviated as TPP1NP-EP was developed here. To ensure the conjugated TPP1 and CBP could completely release from TPP1NP-EP, the TPP1 and CBP were respectively conjugated with polymer by MMP-2/9-cleavable peptide linker sequence PLGLAG and pH-sensitive hydrazone bond. Both in vitro and in vivo experiments demonstrated an excellent anti-tumor effect of TPP1NP-EP on SCLC. Additionally, the developed TPP1NP-EP possess excellent biocompatibility and good safety for drug delivery in vivo with no significant effect on the histiocytic injury of primary organs and hematologic and biochemical parameters. In conclusion, the present study has provided a promising strategy for treatment of malignant SCLC.
Supplemental Material
Download MS Word (2.8 MB)Disclosure statement
The authors declare no competing financial interests.
References
- Calles A, Aguado G, Sandoval C, Álvarez R. (2021). Immunotherapy in small cell lung cancer: one step at a time: a narrative review. Transl Lung Cancer Res 10:1571–87.
- Chen CY, Chen WC, Hung CM, Wei YF. (2021). Chemotherapy or chemo-immunotherapy as first-line treatment for extensive-stage small-cell lung cancer: a meta-analysis. Immunotherapy 13:1165–77.
- Chen L, Zhou L, Wang C, et al. (2019). Tumor-targeted drug and CpG delivery system for phototherapy and docetaxel-enhanced immunotherapy with polarization toward M1-type macrophages on triple negative breast cancers. Adv Mater 31:e1904997.
- Danafar H, Sharafi A, Kheiri Manjili H, Andalib S. (2017). Sulforaphane delivery using mPEG-PCL co-polymer nanoparticles to breast cancer cells. Pharm Dev Technol 22:642–51.
- Facchinetti F, Di Maio M, Tiseo M. (2020). Adding PD-1/PD-L1 inhibitors to chemotherapy for the first-line treatment of extensive stage small cell lung cancer (SCLC): a meta-analysis of randomized trials. Cancers 12:2645.
- Farid S, Liu SV. (2020). Chemo-immunotherapy as first-line treatment for small-cell lung cancer. Ther Adv Med Oncol 12:1758835920980365.
- Feng X, Jiang D, Kang T, et al. (2016). Tumor-homing and penetrating peptide-functionalized photosensitizer-conjugated PEG-PLA nanoparticles for chemo-photodynamic combination therapy of drug-resistant cancer. ACS Appl Mater Interfaces 8:17817–32.
- Feng X, Yao J, Gao X, et al. (2015). Multi-targeting peptide-functionalized nanoparticles recognized vasculogenic mimicry, tumor neovasculature, and glioma cells for enhanced anti-glioma therapy. ACS Appl Mater Interfaces 7:27885–99.
- Galluzzi L, Humeau J, Buqué A, et al. (2020). Immunostimulation with chemotherapy in the era of immune checkpoint inhibitors. Nat Rev Clin Oncol 17:725–41.
- Gao R, Zhang Y, Wen XP, et al. (2014). Chemotherapy with cisplatin or carboplatin in combination with etoposide for small-cell esophageal cancer: a systemic analysis of case series. Dis Esophagus 27:764–9.
- Gomez GG, Hutchison RB, Kruse CA. (2001). Chemo-immunotherapy and chemo-adoptive immunotherapy of cancer. Cancer Treat Rev 27:375–402.
- Goto K, Ohe Y, Shibata T, et al. (2016). Combined chemotherapy with cisplatin, etoposide, and irinotecan versus topotecan alone as second-line treatment for patients with sensitive relapsed small-cell lung cancer (JCOG0605): a multicentre, open-label, randomised phase 3 trial. Lancet Oncol 17:1147–57.
- Gou M, Wei X, Men K, et al. (2011). PCL/PEG copolymeric nanoparticles: potential nanoplatforms for anticancer agent delivery. Curr Drug Targets 12:1131–50.
- Guo J, Yu Z, Das M, Huang L. (2020). Nano codelivery of oxaliplatin and folinic acid achieves synergistic chemo-immunotherapy with 5-fluorouracil for colorectal cancer and liver metastasis. ACS Nano 14:5075–89.
- Heigener DF, Manegold C, Jäger E, et al. (2009). Multicenter randomized open-label phase III study comparing efficacy, safety, and tolerability of conventional carboplatin plus etoposide versus dose-intensified carboplatin plus etoposide plus lenograstim in small-cell lung cancer in "extensive disease" stage. Am J Clin Oncol 32:61–4.
- Jiang X, Xin H, Gu J, et al. (2013). Solid tumor penetration by integrin-mediated pegylated poly(trimethylene carbonate) nanoparticles loaded with paclitaxel. Biomaterials 34:1739–46.
- Jones GS, Elimian K, Baldwin DR, et al. (2020). A systematic review of survival following anti-cancer treatment for small cell lung cancer. Lung Cancer 141:44–55.
- Kadiyala P, Li D, Nuñez FM, et al. (2019). High-density lipoprotein-mimicking nanodiscs for chemo-immunotherapy against glioblastoma multiforme. ACS Nano 13:1365–84.
- Karam I, Jiang SY, Khaira M, et al. (2015). Outcomes of small cell lung cancer patients treated with cisplatin–etoposide versus carboplatin–etoposide. Am J Clin Oncol 38:51–4.
- Kenmotsu H, Niho S, Tsuboi M, et al. (2020). Randomized phase III study of irinotecan plus cisplatin versus etoposide plus cisplatin for completely resected high-grade neuroendocrine carcinoma of the lung: JCOG1205/1206. J Clin Oncol 38:4292–301.
- Konala VM, Madhira BR, Ashraf S, Graziano S. (2020). Use of immunotherapy in extensive-stage small cell lung cancer. Oncology 98:749–54.
- Kubota K, Hida T, Ishikura S, et al. (2014). Etoposide and cisplatin versus irinotecan and cisplatin in patients with limited-stage small-cell lung cancer treated with etoposide and cisplatin plus concurrent accelerated hyperfractionated thoracic radiotherapy (JCOG0202): a randomised phase 3 study. Lancet Oncol 15:106–13.
- Li C, Zhang N, Zhou J, et al. (2018). Peptide blocking of PD-1/PD-L1 interaction for cancer immunotherapy. Cancer Immunol Res 6:178–88.
- Liu J, Shapiro JI. (2003). Endocytosis and signal transduction: basic science update. Biol Res Nurs 5:117–28.
- Liu Q, Chen F, Hou L, et al. (2018). Nanocarrier-mediated chemo-immunotherapy arrested cancer progression and induced tumor dormancy in desmoplastic melanoma. ACS Nano 12:7812–25.
- Melosky B, Cheema PK, Brade A, et al. (2020). Prolonging survival: the role of immune checkpoint inhibitors in the treatment of extensive-stage small cell lung cancer. Oncologist 25:981–92.
- Minchinton AI, Tannock IF. (2006). Drug penetration in solid tumours. Nat Rev Cancer 6:583–92.
- Moghimi SM, Hunter AC. (2001). Capture of stealth nanoparticles by the body's defences. Crit Rev Ther Drug Carrier Syst 18:527–50.
- Okamoto H, Watanabe K, Kunikane H, et al. (2007). Randomised phase III trial of carboplatin plus etoposide vs split doses of cisplatin plus etoposide in elderly or poor-risk patients with extensive disease small-cell lung cancer: JCOG 9702. Br J Cancer 97:162–9.
- Olson ES, Jiang T, Aguilera TA, et al. (2010). Activatable cell penetrating peptides linked to nanoparticles as dual probes for in vivo fluorescence and MR imaging of proteases. Proc Natl Acad Sci U S A 107:4311–6.
- Ou SH, Ziogas A, Zell JA. (2009). Prognostic factors for survival in extensive stage small cell lung cancer (ED-SCLC): the importance of smoking history, socioeconomic and marital statuses, and ethnicity. J Thorac Oncol 4:37–43.
- Paz-Ares L, Dvorkin M, Chen Y, et al. (2019). Durvalumab plus platinum–etoposide versus platinum–etoposide in first-line treatment of extensive-stage small-cell lung cancer (CASPIAN): a randomised, controlled, open-label, phase 3 trial. Lancet 394:1929–39.
- Qiao H, Chen X, Chen E, et al. (2019). Folated pH-degradable nanogels for the simultaneous delivery of docetaxel and an IDO1-inhibitor in enhancing cancer chemo-immunotherapy. Biomater Sci 7:2749–58.
- Ragavan M, Das M. (2020). Systemic therapy of extensive stage small cell lung cancer in the era of immunotherapy. Curr Treat Opt Oncol 21:64.
- Rocco D, Della Gravara L, Battiloro C, Gridelli C. (2019). The role of combination chemo-immunotherapy in advanced non-small cell lung cancer. Expert Rev Anticancer Ther 19:561–8.
- Saleh K, Khalife-Saleh N, Kourie HR. (2019). Finally, after decades, immune checkpoint inhibitors dethroned the standard of care of small-cell lung cancer. Immunotherapy 11:457–60.
- Siegel RL, Miller KD, Fuchs HE, Jemal A. (2021). Cancer Statistics, 2021. CA Cancer J Clin 71:7–33.
- Tapan U, Furtado VF, Qureshi MM, et al. (2021). Racial and other healthcare disparities in patients with extensive-stage SCLC. JTO Clin Res Rep 2:100109.
- Wagner V, Dullaart A, Bock AK, Zweck A. (2006). The emerging nanomedicine landscape. Nat Biotechnol 24:1211–7.
- Waqar SN, Morgensztern D. (2017). Treatment advances in small cell lung cancer (SCLC). Pharmacol Ther 180:16–23.
- Yang Z, Ma Y, Zhao H, et al. (2020). Nanotechnology platforms for cancer immunotherapy. Wiley Interdiscip Rev Nanomed Nanobiotechnol 12:e1590.
- Zhang S, Li S, Cheng Y. (2020). Efficacy and safety of PD-1/PD-L1 inhibitor plus chemotherapy versus chemotherapy alone as first-line treatment for extensive-stage small cell lung cancer: a systematic review and meta-analysis. Thorac Cancer 11:3536–46.
- Zhou T, Zhang Z, Luo F, et al. (2020). Comparison of first-line treatments for patients with extensive-stage small cell lung cancer: a systematic review and network meta-analysis. JAMA Netw Open 3:e2015748.