
Abstract
Rheumatoid arthritis (RA) is a chronic systemic autoimmune disease, which is characterized by synovial inflammation and autoimmunity. The main cause of the disease is the imbalance of the proportion of pro-inflammatory macrophages (M1-type) and anti-inflammatory macrophages (M2-type) in the synovial tissues of the joint. To restore this balance, in our study, the interleukin-10 encoding anti-inflammatory cytokines (IL-10 pDNA) and chemotherapeutic drug dexamethasone sodium phosphate (DSP) were co-loaded into human serum albumin (HSA) preparing pDNA/DSP-NPs to actively target macrophages in synovium tissue to promote M1-M2 polarization. Confocal laser scanning microscope and western blot were used to demonstrate the targeting ability of co-delivery nanoparticles. In vivo, the real-time fluorescence imaging system and HPLC were used to study the tissue distribution and pharmacokinetics of nanoparticles, and the results showed that the accumulation of nanoparticles in the inflammatory joint site was higher. Its pharmacodynamics were evaluated in collagen-induced arthritis (CIA) rat model, and it demonstrated that the pDNA/DSP-NPs significantly reduced the expression of serum inflammatory factors and alleviated joint swelling and bone erosion, suggesting the favorable therapeutic effect. The synergistic treatment effect of IL-10 pDNA and DSP in this system was achieved by reducing the secretion of pro-inflammatory factors (TNF-α, IL-1β) and increasing the expression of anti-inflammatory factors (IL-10) to promote the M1-M2 polarization of macrophages. Our strategy is promising for co-delivery of gene drugs and chemical drugs by biomimetic natural materials to promote macrophages polarization so that to achieve synergically treatment of inflammatory disease.
1. Introduction
Rheumatoid arthritis (RA) is a chronic, systemic inflammatory disease characterized by inflammation of the joints and destruction of cartilage and bone, affecting about 1% of people in the world (van der Woude & van der Helm-van Mil, Citation2018; Sparks, Citation2019). Although the cause of RA induction is unknown, it is characterized by the infiltration of activated macrophages (namely M1-type macrophage), into the synovial space, leading to the secretion and release of pro-inflammatory factors, including TNF-α, IL-1β, IL-6, metalloproteinase, and active oxides, which ultimately aggravate progress of the disease (Pandey et al., Citation2017). However, in RA the anti-inflammatory macrophage is called M2-type macrophage, which could secret IL-10 that has anti-inflammatory effect. Therefore, inhibiting the level of pro-inflammatory factors and enhancing anti-inflammatory factors so as to facilitate macrophage polarization from M1 to M2-type showed a promising strategy for RA treatment.
The study showed that glucocorticoids (GCs) are the most widely used first-line therapy drugs for RA treatment in clinics for their desirable anti-inflammatory effects (Baschant et al., Citation2012). It’s proved that GCs can inhibit the secretion of pro-inflammatory factors, as well as up-regulate the level of anti-inflammatory factors such as IL-4, IL-10, which further inhibit the production of pro-inflammatory factors (Barnes, Citation1998; Vandewalle et al., Citation2018). However, due to the nonspecific targeting of GCs, they always result in adverse reactions after long-term administration, such as osteoporosis, muscle atrophy, and impaired immune function, greatly limiting their clinical use (Wang et al., Citation2016; Wang & Sun, Citation2017). Targeting drug delivery system based on nanoparticles has great potential for selectively accumulating drugs to the disease site, and it also shows the advantages of reducing dose and side effects.
Since the microenvironment of RA is complex, it’s difficult for a single glucocorticoid to achieve an anti-inflammatory effect effectively. Previous studies have been devoted to the development of the combination therapy of nucleic acid drugs and chemical drugs, to improve the therapeutic effect and reduce the toxicity of chemical drugs(Li et al., Citation2020; Zhong et al., Citation2022). It’s reported that IL-10 is a major anti-inflammatory and immunosuppressive cytokine produced primarily by activated M2-type mononuclear macrophages (Fickenscher et al., Citation2002; Mosser & Zhang, Citation2008). However, the stability, short half-life, and enzymatic degradation of genetic drugs such as IL-10 limited their clinical application and required high doses and frequent administration (Fosgerau and Hoffmann, Citation2015). It has been shown that wrapping IL-10 plasmid DNA into uncoagulated alginate nanoparticles can effectively repolarize macrophages from the M1 to the M2 state (Jain et al., Citation2015; Degboé et al., Citation2019). IL-10 inhibits the release of pro-inflammatory cytokines produced by macrophages, including TNF-α, IL-1β, and IL-6 (Fickenscher et al., Citation2002; Teng et al., Citation2011). Therefore, it plays an important role in inflammatory and autoimmune diseases and is a potential therapeutic agent for rheumatoid arthritis (Mosser & Zhang, Citation2008; Castillo & Kolls, Citation2016). The pORF5-mIL-10 plasmid DNA (IL-10 pDNA) is an anti-inflammatory IL-10 cytokine encoding plasmid DNA, which could efficiently express IL-10 in the cell. To this end, it is beneficial to combine one of the widely used GCs dexamethasone sodium phosphate (DSP) with IL-10 pDNA to synergistic therapy RA through multiple mechanisms to inhibit pro-inflammatory factors and increase anti-inflammatory factor levels and achieve the macrophage polarization from M1 to M2-type. For effectively delivery DSP and plasmid to intra-cellular, it’s beneficial to deliver that by targeting the drug delivery system.
Human serum albumin (HSA) is one of the fascinating vectors not only for its characteristics such as water-soluble, non-toxicity, biodegradation, and non-immunogenicity, but it can also camouflage as endogenous cells, which can escape the capture of immune cells and prolong the cycle time(Yan et al., Citation2019; Lyu et al., Citation2021). It’s reported that glycoprotein SPARC (secreting a protein acidic and rich in cysteine) levels, a member of the stromal cell component family of the extracellular matrix (ECM) in inflammatory joints may increase with inflammatory cell invasion, neovascularization, and bone erosion (Liu et al., Citation2019). In RA, the overexpression of SPARC promotes the accumulation of drugs in the inflammatory microenvironment due to the high affinity of SPARC for albumin, which contributes to the active targeting of albumin-based nanoparticles (Mi et al., Citation2017; Zhao et al., Citation2018). In addition, because synovial cell metabolism is upregulated, arthritic joints metabolize more albumin as a source of nitrogen and energy than healthy tissues (Rall et al., Citation1996). Fast metabolism increases albumin demand in RA joints, which can further facilitate bionic delivery of HSA-based nanoparticles to these sites. It has been shown that the albumin-loaded drug delivery system accumulates and remains for a longer time in arthritic joints (Liu et al., Citation2019; Zhong et al., Citation2022). Inspired by this fact, it’s reasonable to engage HSA to be both a carrier and a targeting ligand developing active targeting drug delivery.
In this study, we prepared human serum albumin-loaded IL-10 pDNA and DSP nanoparticles (pDNA/DSP-NPs) for biomimetic drug delivery aiming at RA treatment (Scheme 1). Western blot and immunohistochemical staining confirmed that human serum albumin could actively target the synovial tissues, and simultaneously cell uptake proved that activated macrophages could effectively absorb Cy5-pDNA-NPs. The real-time fluorescence imaging system in vivo verified that DID-labeled human serum albumin nanoparticles could accumulate in inflammatory joints, due to the active targeting effect of albumin. The synergistic treatment of IL-10 pDNA and DSP exhibited significant therapeutic efficacy in collagen-induced arthritis rats compared with other treatment groups. Our research holds potential value for the co-delivery of IL-10 pDNA and DSP by natural materials for the treatment of inflammatory disease.
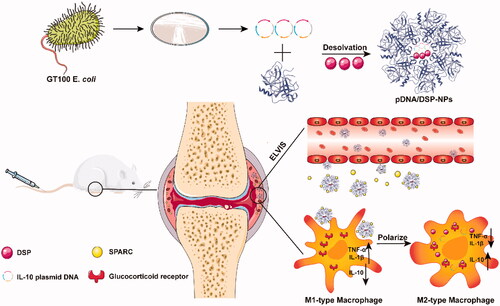
Scheme 1. Schematic of preparation and anti-inflammatory therapy of human serum albumin nanoparticles targeting macrophages. pDNA/DSP-NPs in rheumatoid arthritis (RA) joints through the ELVIS effect, increased demand for rheumatoid joint albumin, the intrinsic high affinity between HSA and locally overexpressed SPARC (secreted protein acidic and rich in cysteine) in synovial tissues of RA, effective treatment of RA.
2. Materials and methods
2.1. Materials
Dexamethasone sodium phosphate (DSP, purity ≥99%) was supplied by Solarbio Science &Technology (Beijing, China). Methanol and acetonitrile (HPLC grade) were purchased from Kelong Chemical Reagent Factory (Chengdu, China). Triethylamine. Coumarin. Cy5-NHS. HSA (human serum albumin) was obtained from Beijing Biotopped Science & Technology (Beijing, China). MTT(3-(4,5-dimethylthiazol-2-yl)-2,5-diphenyltetrazolium bromide), Lipopolysaccharide (LPS) and dimethyl sulfoxide (DMSO) were all supplied by Solarbio Science & Technology (Beijing, China). Other reagents were analytical grade.
2.2. Cells and animals
RAW264.7 (a murine macrophage-like cell line) and HUVEC, cultured in DMEM medium (Hyclone, USA) with 10% fetal bovine serum (FBS) (Gibco, USA) and 1% (v/v) penicillin/streptomycin (Hyclone, USA) were both gained from Chinese Academy of Sciences (Shanghai, China). Cells were incubated in a 5% CO2 environment at 37 °C, and the cell medium was changed every other day.
Male Sprague-Dawley (SD) rats were obtained from the laboratory animal center of Southwest Medical University. All animal experiments were performed by the Animal Management Rules of the Ministry of Health of the People’s Republic of China (document No. 55, 2001) and the Principles of Laboratory Animal Care (NIH publication #85–23, revised in 1985).
2.3. IL-10 pDNA extraction and purity detection
The pcDNA3.1 plasmid encoding the mouse cytokine IL-10 (mIL-10) was transformed into lyophilized GT100 E. coil (Yingrun Biotechnology, Changsha, China) and cultured in a medium containing sodium chloride, yeast, and peptone. Liquid lysogeny broth (LB) was sterilized in an autoclave for 30 min at 121 °C. This followed by adding 100 μg/mL ampicillin after the above solution cooled down. Plasmid purification was followed by the protocol of the endo-free maxi plasmid kit, and the ratio of OD260/OD280 was 1.9-2.0, which was an acceptable purity.
2.4. Preparation of HSA-based pDNA/DSP co-delivery nanoparticles (pDNA/DSP-NPs)
pDNA/DSP-NPs were prepared by a desolvation technology as described previously (Look et al., Citation2015). In principle, 1 mL human serum albumin solution (20 mg/mL in ultrapure water) was incubated with 250 μg IL-10 pDNA and 10 mg DSP continuously stirred (550 rpm) for 1 h, followed by adding 2.7 mL ethanol 96% (v/v) at a rate of 1 mL/min under agitation (550 rpm). Then 11.8 μL 8% glutaraldehyde solution was added and stirred at 220 rpm for at least 12 h to achieve adequate crosslinking. Finally, it was re-dispersed in PBS by centrifugation (10,000 g, 20 min) to obtain pDNA/DSP-NPs. Blank NPs, pDNA-NPs, and DSP-NPs were prepared in the same way.
2.5. Characteristics of pDNA/DSP-NPs
The size, PDI, and zeta potential of all preparations were measured using Malvern Zetasizer Nano ZS90 (Malvern Instruments, Malvern, UK). pDNA/DSP-NPs were analyzed by transmission electron microscopy (TEM, JEM1200EX, Japan). The absorbance spectra of HSA, IL-10 pDNA, free DSP, and pDNA/DSP-NPs were measured by ultraviolet (UV)-visible (vis)-near-infrared (NIR) spectrophotometer. Encapsulation efficiency (EE) and drug loading efficiency (DLE) of DSP were measured using high-performance liquid chromatography (HPLC, LC-2030, Japan). The amount of IL-10 pDNA was determined by fluorescence spectrophotometry (PerkinElmer, USA). pDNA/DSP-NPs were diluted in 3 mL of acetonitrile and sonicated for 10 min to extract IL-10 pDNA and DSP completely. EE was calculated using the formula EE (%) = m0/m1×100%, DLE (%) = m0/mw×100%, where m0 is the weight of DSP encapsulated in HSA, m1 is the weight of total DSP, and mw is the weight of pDNA/DSP-NPs.
Hoechst 33258 dye was used as a plasmid fluorescent marker. The amount of IL-10 pDNA entrapped into the pDNA/DSP-NPs was calculated by subtracting the detected free IL-10 pDNA (mfree) from the total amount of IL-10 pDNA (mtotal) used. pDNA/DSP-NPs were dried in a freeze-drying oven and weighed (mw). The blank NPs supernatant was used as a control. The fluorescence intensity of the mixture was measured at 343 nm (excitation) and 445 nm (emission). The calculated equation of EE and DLE was as followed. EE = (mtotal-mfree)/mtotal×100%; DLE = (mtotal-mfree)/mw×100%.
2.6. Drug release and stability of pDNA/DSP-NPs in vitro
Drug release was determined by dialysis in vitro. Briefly, 1.5 mL pDNA/DSP-NPs and free DSP (same content of DSP) were separately put in a dialysis bag (molecular weight cutoff of 10 kDa), which were added to 50 mL phosphate-buffered saline (PBS) with stirring at 100 rpm at 37 °C. At a fixed point in time of 0.25, 0.5, 1, 2, 4, 6, 8, 12, 24, 30, 36, 48, 54, 60, and 72 h. DSP concentration was determined by HPLC, and the cumulative amount released was calculated. To test the stability of pDNA/DSP-NPs, we measured the particle size and PDI through DLS at 4 °C in PBS solution for 7 days in succession. In addition, the stability of naked pDNA and pDNA/DSP-NPs in 50% bovine serum was determined at 37 °C. The samples were taken out at the specified time point of 0.5, 1, 2, 4, 6, 8, and 10 h at 37 °C, and then were determined by agarose gel electrophoresis.
2.7. Cytotoxicity and hemolysis assay of pDNA/DSP-NPs
RAW264.7 and HUVEC cells were seeded into 96-well plates (1 × 10⁴ per well) and incubated in a 5% CO2 environment at 37 °C overnight. Free DSP, blank NPs, and pDNA/DSP-NPs were prepared in culture medium without serum and antibiotics, then 200 μL of each preparation was added to wells at DSP concentrations of 10–50 μg/mL (n = 5). After 24 h, the medium was discarded, and cells were washed three times with PBS solution, followed by added 20 μL of MTT (5 mg/mL) solution and 180 μL of complete medium. Cells were cultured for another 4 h, then the medium was replaced with 150 μL DMSO and cultures were shaken for 15 min at 37 °C. Absorbance at 490 nm was measured using a Varioskan Flash microplate reader (Thermo Fisher, USA). Relative cell viability (%) was calculated using the equation as followed: Cell viability = (sample − blank)/(negative control − blank) × 100.
Cardiac blood was collected from normal rats, and 3 mL of saline was added to 1 mL of whole blood, shaken well, centrifuged at 2500 rpm for 10 min, and 2% red blood cell suspension was obtained. Free DSP, blank NPs, DSP-NPs, and pDNA/DSP-NPs were prepared at 1.8, 18, and 180 μg/mL, respectively. The preparation (500 μL) and 2% red blood cell suspension (500 μL) were mixed evenly, and the mixture was heated in a water bath (37 °C) for 3 h. After centrifugation at 3000 rpm for 10 min, the supernatant (100 μL) was accurately absorbed into the 96-well plate. Saline and ultra-pure water were used as negative and positive controls. The hemoglobin released from erythrocytes was detected at 540 nm using a Varioskan Flash microplate reader.
2.8. Cellular uptake of pDNA/DSP-NPs
To evaluate the uptake of nanoparticles into RAW264.7 cells, IL-10 pDNA was labeled with Cy5-NHS, and DSP was replaced with coumarin, and then cultured for 24 h with LPS at a final LPS concentration of 100 ng/mL. Subsequently, they were treated with different preparations for 4 h and cell uptake was assessed using a confocal laser scanning microscope (CLSM) (Leica SP8, Germany).
2.9. Determination of inflammatory factors
RAW264.7 cells were inoculated into 6-well plates (5 × 10⁵ cells per well), then cultured for 4 h. LPS was then added to a final concentration of 100 ng/mL and cultured for 24 h. The medium was replaced separately with a 1 mL fresh medium containing PBS, naked pDNA, free DSP, pDNA/DSP, pDNA-NPs, DSP-NPs, or pDNA/DSP-NPs (the total drug concentration was 200 μg/mL). After incubation for 24 h, the medium was collected and centrifuged at 2000 rpm for 5 min. On day 15 after treatment, serum and joint tissues of CIA rats were collected from each group and treated by the appropriate biological sample treatment method. Levels of inflammatory cytokines (TNF‐α, IL-1β, and IL-10) were measured using enzyme linked immunosorbent assay (ELISA) according to the manufacturer's protocol.
2.10. Animal model of collagen-induced arthritis
Male SD rats (200 ± 20 g) were used to establish collagen-induced arthritis (CIA) model as described (Brand et al., Citation2007). In brief, bovine type II collagen (2 mg/mL; Chondrex, USA) was emulsified with the same amount of complete freund’s adjuvant (5 mg/mL; Chondrex, USA) to prepared emulsion. Then 100 μL of the above emulsion was injected intradermally into the base of the rat tail. One week later, 50 μL of the emulsion prepared by equal bovine type II collagen and equal incomplete freund’s adjuvant were injected into the tail of a per rat. We monitored RA progress daily.
2.11. Pharmacokinetics
After 14 days of initial immunization, the arthritis index score (AI) of each rat’s feet was scored daily. CIA rats with an AI score of >4 were selected to study the pharmacokinetics in vivo. The rats were randomly divided into 12 groups and injected with pDNA/DSP and pDNA/DSP-NPs (DSP with a dosage of 3 mg/kg). Serum and joint tissues samples were collected at 0.5, 1, 2, 4, 6, and 8 h, respectively. The concentration of DSP was determined by HPLC.
2.12. Distribution of pDNA/DSP-NPs in CIA rats
CIA rats were intravenously injected with free DID or DID-NPs. At 2, 4, 8, 12, or 24 h after administration, rats were anesthetized and analyzed using the IVIS® Spectral Imaging System (Kodak, USA). After 24 h of fluorescence imaging, the rats were sacrificed for analysis of tissue distribution ex vivo.
In addition, the distribution of pDNA/DSP-NPs in different tissues of rats was quantitatively analyzed. pDNA/DSP and pDNA/DSP-NPs were injected intravenously into CIA rats (DSP with a dosage of 3 mg/kg), and different tissues (heart, liver, spleen, lung, kidney, joints) were collected at 0.5, 2, 4, and 6 h. Then these tissues were homogenized with 0.9% sodium chloride (equivalent to twice the weight of the tissue). The content of DSP was determined by HPLC.
2.13. Therapeutic efficacy of pDNA/DSP-NPs in CIA rats
On days 16, 19, 22, 25, and 28 after the induction of arthritis, each group was intravenously injected with saline, naked pDNA, free DSP, pDNA/DSP, pDNA-NPs, DSP-NPs, and pDNA/DSP-NPs. Three normal rats served as naive controls. All animals were assessed for paw swelling every three days, starting 16 days after induction, including body weight, ankle diameter, paw thickness, paw volume, joint photos, and AI score. The scoring criteria refer to the literature report (Crielaard et al., Citation2012):0, no evidence of erythema or swelling; 1, erythema and mild swelling confined to the tarsals or ankle joint; 2, erythema and mild swelling extending from the ankle to the tarsals; 3, erythema and moderate swelling extending from the ankle to metatarsal joints; 4, erythema and severe swelling encompassing the ankle, foot, and digits, or ankyloses of the limb.
The ankles of each group were dissected 15 days after treatment. The joints were soaked in 4% paraformaldehyde for 24 h. Methods Micro-CT was used to scan the hind limb, and the structural changes of the joint of rats were analyzed (Quan et al., Citation2016; Wei et al., Citation2018). By using the Data Viewer, the calcaneus was aligned along the sagittal face, starting from 0.2 mm of the talus plate, a 40–50 layer (1 mm) area was selected as the perceptual region (ROI), and BMD, BV/TV, BS/TV, Tb.Th, Tb.N, and Tb.Sp was calculated. In addition, the dissected ankles were fixed in 4% paraformaldehyde for 72 h, followed by decalcified in 15% neutral EDTA solution for 15 days at room temperature and embedded in paraffin. Sections were stained with hematoxylin-eosin (H&E), safranin O (SO), and toluidine blue staining.
On day 30, serum alanine aminotransferase (ALT) and aspartate aminotransferase (AST) levels were measured to detect the hepatotoxicity of pDNA/DSP-NPs.
2.14. Western blot and immunohistochemical staining
The synovial tissues of rats were dissected for western blot. The synovial tissue was frozen with liquid nitrogen and then was lysed by homogenization with a lysis buffer containing protease inhibitors. The supernatant was collected through centrifuged at 14,000 g for 15 min at 4 °C, and the protein concentration was quantified with the BCA protein quantification kit (Beyotime Biotechnology, China), followed by was heated at 100 °C for 10 min. The total protein of each sample was loaded into 40 μg, and separated by 10% sodium dodecyl sulfate-polyacrylamide gel electrophoresis (SDS-PAGE). Exposed the film using the Chemi Doc touch imaging system (Bio-Rad, USA). We used the primary antibody SPARC (1:1000) against the above protein and made GAPDH as the internal control antibody.
The synovial tissues were obtained 15 days after the initial immunization and then were used for detecting SPARC expression levels by immunohistochemical staining, with the primary antibody SPARC (1:500) against the above protein.
2.15. Statistical analysis
Data were expressed as mean ± SD. Differences between the two groups were assessed for significance by Student’s t-test, and differences between three or more groups were assessed by one-way ANOVA and Dunnett’s multiple comparison test. p < .05 was considered statistically significant. The histograms were built using GraphPad Prism software 7.0.
3. Result
3.1. Characterization of drug-loaded nanoparticles
After the identification by the nanodrop ultra-micro spectrophotometer (Thermo, USA) and agarose gel imaging system (Bio-Rad, USA), the purity and quality of the IL-10 pDNA could meet the experimental requirement (Supplemental Figure S1A), and 2 mg of IL-10 pDNA can be extracted per liter of medium. Dynamic light scattering (DLS) results showed that the average particle size of pDNA/DSP-NPs was 242.5 ± 4.50 nm (), with a narrow size distribution. Compared with the hydrodynamic particle size of 160.93 ± 1.26 nm of blank nanoparticles (Supplemental Figure S2A), 194.57 ± 2.14 nm of pDNA-NPs (), and 197.27 ± 5.71 nm of DSP-NPs (), the particle size of pDNA/DSP-NPs had increased, indicating that pDNA and DSP were successfully encapsulated in HSA. The potential of pDNA/DSP-NPs was −23.97 ± 1.10 mV, and PDI was 0.22 ± 0.008. EE of pDNA/DSP-NPs was 83.36 ± 0.03% for DSP, and 90.96 ± 0.03% for pDNA and the DLE was 10.54 ± 2.09%, which were both extremely higher than other single-drug nanoparticles (). The size and morphology of pDNA/DSP-NPs were observed by transmission electron microscopy (TEM) as shown in . The results showed that the morphology of pDNA/DSP-NPs was spherical and regular with the average particle size of about 100 nm, which was slightly smaller than the corresponding DLS measurement value, and that might be caused by the breakdown of the dehydration process. There were obvious pDNA and DSP peaks at 240 nm and 260 nm in the UV-vis-NIR spectrum, which confirmed that pDNA and DSP existed in pDNA/DSP-NPs, and HSA also had a specific absorption peak at 280 nm (Supplemental Figure S2B).
Figure 1. Characterization of pDNA/DSP-NPs. (A) Size, PDI, zeta, encapsulation efficiency, and drug loading efficiency of pDNA and DSP in NPs, pDNA-NPs, DSP-NPs, and pDNA/DSP-NPs. Size distribution of pDNA-NPs (B), DSP-NPs (C), and pDNA/DSP-NPs (D). (E) TEM images of pDNA/DSP-NPs. The stability of pDNA/DSP-NPs was measured in terms of particle size (F) and PDI (G) at 4 °C during storage. Results were presented as mean ± SD (n = 3). (H) In vitro release of DSP from Free DSP and pDNA/DSP-NPs, the concentration of DSP was determined by HPLC. Results were presented as mean ± SD (n = 3). Cytotoxicity of formulations with DSP at different concentrations (10, 20, 30, 40, 50 μg/mL) in RAW264.7 cells (I) and HUVEC cells (J). Results were presented as mean ± SD (n = 5).
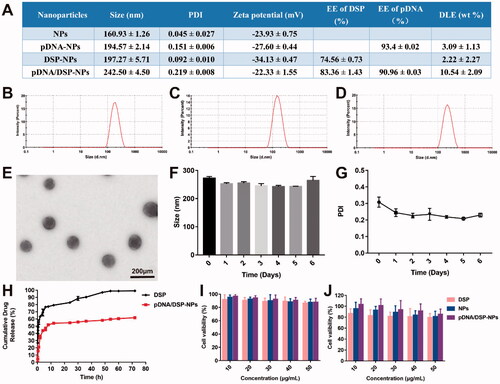
Moreover, the stability of pDNA/DSP-NPs at 4 °C was studied. As shown in , the size and PDI of pDNA/DSP-NPs hardly changed for 7 consecutive days, exhibiting its excellent stability in vitro. As detected by agarose gel electrophoresis, IL-10 pDNA was encapsulated by HSA and incubated with serum for 10 h, and the band was still clearly visible (Supplemental Figure S1B). It showed that HSA could protect IL-10 pDNA from being degraded by nuclease in serum so that IL-10 pDNA could still maintain its integrity.
3.2. Drug release from pDNA/DSP-NPs in vitro
Compared to the free DSP group, the release of DSP from pDNA/DSP-NPs was much slower. By around 8 h, nearly 70% and 40% of DSP was separately released from the free DSP and pDNA/DSP-NPs, and there was a significant difference. In addition, only 64.59% of DSP had been released at 72 h, suggesting the sustained-release property of pDNA/DSP-NPs ().
3.3. Cytotoxicity and hemolysis assay of pDNA/DSP-NPs in vitro
The results showed that pDNA/DSP-NPs with different concentrations of DSP had no obvious toxicity to RAW264.7 and HUVEC cells, and the cell survival rate of each group was higher than 80% (). With the increase of DSP concentration, the cell survival ability of the free group showed a more obvious downward trend, indicating that HSA coating can help reduce the toxicity of DSP. In addition, the cell viability of blank NPs and pDNA/DSP-NPs showed the same trend, revealing the biocompatibility and nontoxicity of HSA.
We incubated pDNA/DSP-NPs with different drug concentrations and 2% red blood cell suspension at 37 °C for 4 h. The results showed that the hemolysis rate of each group did not cause obvious hemolysis of the red blood cells (not more than 5%) at the highest dosage (180 μg/mL) (Supplemental Figure S3A–B). This indicated that all groups were biocompatibility preparations, and the possibility of hemolysis in vivo was minimal, which could be used for intravenous injection of rats in the later experiment.
3.4. Active targeting study of pDNA/DSP-NPs
We observed the endocytosis of nanoparticles containing Cy5-pDNA and coumarin in RAW264.7 cells using a confocal laser scanning microscope (CLSM) and detected a strong signal in cells. They had a very high overlapping effect and were attached around the nucleus (Supplemental Figure S4), indicating that nanoparticles co-loaded with Cy5-pDNA and coumarin were successfully absorbed via RAW264.7 cells. Next, we detected the uptake of naked Cy5-pDNA and Cy5-pDNA-NPs in LPS-activated RAW264.7 cells. Results revealed that Cy5-pDNA-NPs were taken up in large quantities than naked Cy5-pDNA, indicating their high affinity with activated macrophages (). These results confirmed that activated macrophages could efficiently ingest nanoparticles.
Figure 2. Active targeting study of pDNA/DSP-NPs. (A) Uptake of naked Cy5-pDNA and Cy5-pDNA-NPs by RAW264.7 cells with LPS activation. Scale bar, 75 μm. (B) Western blotting (WB) assay of SPARC expression in normal and CIA rats. (C) The expression of SPARC was quantitatively analyzed by ImageJ. Results were presented as mean ± SD (n = 3). (D) Immunohistochemical (IHC) staining assay of SPARC expression in normal and CIA rats.
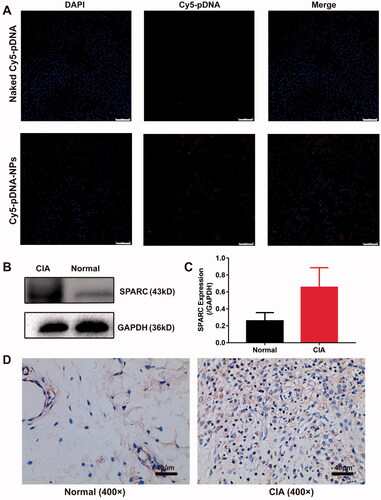
In addition, through western blot and immunohistochemical staining, we confirmed that SPARC was overexpressed in the synovial tissues of the CIA rats model, and its expression was up to 2–3 times higher than that in normal synovial tissues (). Due to the increased demand for joint albumin and the high affinity between albumin and SPARC, the biomimetic nanoparticles could actively deliver therapeutic drugs to the inflammation joint site.
3.5. Macrophages polarized from M1-type to M2-type
As shown in , compared to PBS, pDNA/DSP-NPs significantly inhibited the expression of pro-inflammatory factors (TNF-α and IL-1β). In addition, pDNA/DSP-NPs significantly inhibited the expression of TNF-α and IL-1β and increased the secretion of IL-10 than pDNA-NPs and DSP-NPs.
Figure 3. Induction of macrophage switching from M1 to M2 by pDNA/DSP-NPs. Expression of inflammatory cytokines treated with different preparations. Level of IL-1β (A), TNF-α (B), and IL-10 (C) in cell-free supernatants, IL-1β (D), TNF-α (E), and IL-10 (F) in serum, and IL-1β (G), TNF-α (H), and IL-10 (I) in joint. Results were presented as mean ± SD (n = 3). *p < .05, **p < .01, ***p < .001, ****p < .0001 vs saline. #p < .05, ##p < .01, pDNA-NPs or DSP-NPs vs pDNA/DSP-NPs (two-tailed unpaired Student’s t-test).
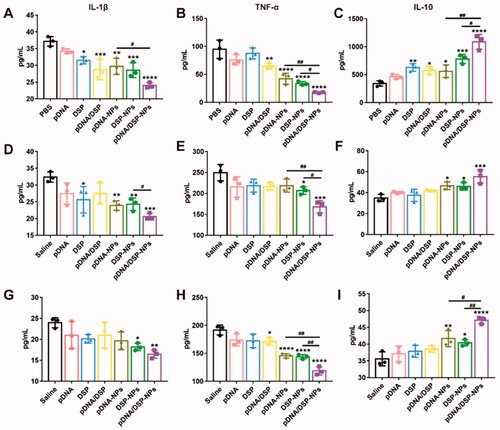
Furthermore, the levels of TNF-α, IL-1β, and IL-10 in serum and joint tissues of rats treated with all groups were detected. Compared with other groups, pDNA/DSP-NPs group showed the lowest level of TNF-α and IL-1β (). It’s worth noticing that the anti-inflammatory factor IL-10 increased the most significantly after pDNA/DSP-NPs treatment, especially in joints (). Taken together, these results suggested that the administration of pDNA/DSP-NPs in CIA rats could significantly reduce the expression of pro-inflammatory cytokines and increase the expression of anti-inflammatory factors, thus contributing to the therapeutic effect of RA. Targeted accumulation of pDNA/DSP-NPs activity might lead to better anti-inflammatory effects. Therefore, our results showed that co-delivery nanoparticles had synergetic anti-inflammatory effects by regulating the level of inflammatory factors so as to promote the M1-M2 re-polarization.
3.6. Pharmacokinetics of pDNA/DSP-NPs
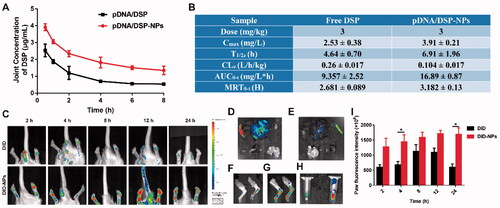
High-performance liquid chromatography (HPLC) was used to determine the plasma concentration of DSP at different times for pDNA/DSP or pDNA/DSP-NPs groups, and the concentration-time curve of the DSP as shown in Supplemental Figure S5A. At all-time points tested, the drug concentration showed a slow downward trend as time prolongs. Of note particularly, the plasma drug concentration level of pDNA/DSP-NPs group was higher, and the peak bloodconcentration was 40.85 ± 2.16 mg/L. In addition, the area under the AUC0-T and T1/2 of pDNA/DSP-NPs was 4.26 and 3.65 times that of pDNA/DSP group, and the drug duration was much longer (Supplemental Figure S5B), suggesting the bioavailability of the nanoparticles was higher than that of free drugs. Furthermore, we tested the pharmacokinetic parameters of DSP in the joints, and the results also exhibited that drug-loaded nanoparticles had a longer circulation time and the drug concentration was higher than free drugs (). Therefore, it might be promising to choose HSA-based nanoparticles as the treatment strategy for chronic disease rheumatoid arthritis.
Figure 4. Pharmacokinetics and joint tissue distribution were studied by HPLC and in vivo real-time fluorescence imaging system. Joint concentration-time curves (A) and corresponding parameters (B) of free DSP and pDNA/DSP-NPs. Results were presented as mean ± SD (n = 3). (C) The imaging of DID fluorescence in joints with free DID and DID-NPs at different time points after administration. The ex vivo imaging of DID fluorescence in vital organs with free DID (D) and DID-NPs (E), joints with free DID (F) and DID-NPs (G), and plasma (H) (left: DID; right: DID-NPs) at 24 h after administration. (I) Semi-quantitation of fluorescence intensity in joints. Results were presented as mean ± SD (n = 3). *p < .05.
3.7. Biodistribution of pDNA/DSP-NPs in CIA rats
The concentration of DSP in blood was higher for pDNA/DSP-NPs than pDNA/DSP at all times (Supplemental Figure S6A–D). Next, we used DID instead of the drug to prepare DID-NPs and evaluated its joint accumulate ability by measuring the fluorescence intensity. We conducted a quantitative analysis and could be seen that DID group gradually decreased after 8 h, while the fluorescence of DID-NPs persistently rose until 24 h and had a significant difference, compared with DID group (). At 24 h after administration, we could find that DID-NPs also distributed more in the liver and spleen (), which might be attributed to the uptake of reticuloendothelial system (RES) phagocytes, however there were more in the DID group. The fluorescence in blood for DID-NPs was stronger than free DID at 24 h, showing its extended system circulation (). These results showed that HSA-based nanoparticles could selectively aggregate at inflammatory joints and had a longer retention time.
3.8. In vivo therapeutic efficacy of pDNA/DSP-NPs
showed the timetable for induction and treatment of arthritis. As presented in and Supplemental Figure S7B, CIA rats treated with saline showed the most severe paw swelling, compared to other groups. More importantly, pDNA/DSP-NPs significantly alleviated paw swelling, and the parameters gradually decreased, almost achieving the normal group level. Similarly, ankle diameter also decreased gradually, compared with other groups (Supplemental Figure S7A). In addition, changes in the arthritis index were a key parameter in assessing anti-inflammatory effects during the progression of arthritis. As shown in , the pDNA/DSP-NPs group had the lowest arthritis index scores and trended to the normal group, which was consistent with the results for paw thickness. In addition, similar results were observed with macroscopic detection based on joint morphology ().
Figure 5. In vivo therapeutic efficacy evaluation. (A) Schematic depicting the experimental procedure of arthritis induction and intravenous treatment with NPs in rats. Photographs (B) and micro-CT images (C) representative hind legs after treatment in different treatment groups. Quantification of articular index score (D), paw thickness (E) after different treatments over time. Quantitative analysis of bone volume over total volume ratio (BV/TV) (F), trabecular number (Tb.N) (G), trabecular thickness (Tb.Th) (H), and ratio of bone surface area to bone volume (BS/BV) (I) of CIA rats in different treated groups. Results were presented as mean ± SD (n = 3). *p < .05, ***p < .001, ****p < .0001 vs saline. #p < .05, ##p < 0.01, and ####p < 0.0001, pDNA-NPs or DSP-NPs vs pDNA/DSP-NPs (two-tailed unpaired Student’s t-test).
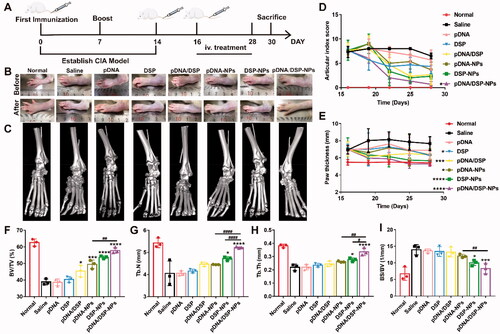
Micro-CT analysis displayed that ankle joints in the saline group still held a rough bone surface and severe bone erosion after treatment. Notably, compared with the saline group, pDNA/DSP-NPs group had a smoother bone surface and higher bone density ( and Supplemental Figure S7(C)), which was closer to the normal group, indicating that pDNA/DSP-NPs effectively reversed bone erosion. Compared with the normal group, trabecular parameters also confirmed that pDNA/DSP-NPs treatment could effectively increase trabecular number (Tb.N) () and trabecular thickness (Tb.Th) (), while reduce trabecular spacing (Tb.Sp) (Supplemental Figure S7D). For bone quality parameters (), pDNA/DSP-NPs showed the best effect of bone erosion repair. These results revealed that pDNA/DSP-NPs could effectively terminate the progress of bone injury and repair bone erosion in the CIA rat model.
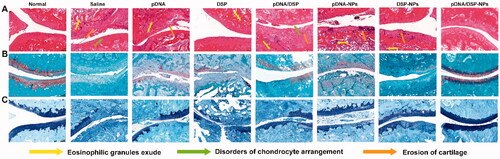
H&E staining sections exhibited that saline group had the most severe synovial hyperplasia and pannus hyperplasia, accompanied by bone and cartilage destruction (). However, the pathological changes of pDNA/DSP-NPs were significantly improved. In addition, SO () and toluidine blue staining () showed that there was a significant loss of proteoglycan in the saline group, indicating that articular cartilage was severely degraded and damaged. While in the pDNA/DSP-NPs group, the positive areas of SO and toluidine blue staining were larger compared to pDNA-NPs or DSP-NPs, suggesting that cartilage injury was effectively reversed, and it could effectively alleviate synovitis and cartilage damage in CIA rats. In conclusion, co-delivery of nanoparticles had a higher therapeutic effect.
Figure 6. Histological assessment of ankle pathology in normal or CIA rats treated with the indicated formulations. Histological sections with H&E (A), safranin-O staining (B), and toluidine blue staining (C) (100×) of knee joints in different groups. Scale bar, 100 μm.
3.9. Safety of pDNA/DSP-NPs in CIA rats
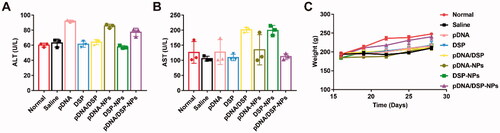
To evaluate the safety of pDNA/DSP-NPs, we measured the AST and ALT levels of pDNA/DSP-NPs to determine their liver function compared with other treatment groups (). All values were within the normal range, and there was no significant difference for all groups. Moreover, there was no significant difference in body weight between the normal group and the pDNA/DSP-NPs group, indicating that the developed HSA-based biomimetic nanoparticle had favorable safety ().
Figure 7. Hepatotoxicity toxicity was assessed by measuring serum levels. Levels of (A) ALT and (B) AST. (C) Body weight of normal and CIA rats over time with different treatments. Results were presented as mean ± SD (n = 3).
4. Discussion
In this study, we explored the co-delivery of IL-10 pDNA and DSP into HSA and evaluated their synergistic therapeutic potential in a rat CIA model of RA. IL-10 pDNA and DSP achieve synergistic anti-inflammatory effects by balancing the expression of inflammatory factors. In vivo experiments showed that co-loaded nanoparticles could effectively inhibit the development of RA disease, alleviate synovium tissue damage, and did not cause hepatotoxicity.
Compared with our previous studies using exosome as a carrier (Li et al., Citation2022), the significance of using HSA as a carrier to encapsulate IL-10 pDNA and DSP is that HSA has the advantages of simple production and low cost, and it’s its favorable targeting property (Lin et al., Citation2011; Chen et al., Citation2017; Tian et al., Citation2017). Compared with albumin nanoparticles loaded with a single drug, our double-drug loaded nanoparticles had the advantage of high drug loading (). We verified the low toxicity of pDNA/DSP-NPs () and the low hemolysis rate (Supplemental Figure S3) in the blood in vitro, suggesting the safety and applicability of HSA as a drug carrier. Due to the overexpression of SPARC in the inflammatory synovial tissue, HSA as a carrier had the advantage of actively targeting the inflammatory synovial tissue. The overexpression of SPARC was observed by western blot and immunohistochemical staining, which both proved the active targeting effect of pDNA/DSP-NPs on the synovial tissue of inflamed joints, and the results were consistent with those of other studies (Briggs et al., Citation2002; Derosa et al., Citation2012; Mi et al., Citation2017; Liu et al., Citation2019). This also showed that we developed an active targeting drug delivery system based on endogenous protein, and it’s feasible to actively target SPARC to achieve effective treatment of RA.
Re-polarization of M1-type macrophages into M2-type macrophages is a promising treatment for inflammation (Wang et al., Citation2019; Tan et al., Citation2022). IL-10 pDNA could express IL-10, which further inhibits inflammation in a variety of ways by down-regulating the synthesis and expression of pro-inflammatory cytokines in macrophages and T cells, including IL-1β, IL-6, TNF, and interferon γ (IFN-γ), reducing immune and inflammatory responses, inhibiting antigen-presentation related events and promoting M1-to-M2 polarization through positive feedback (Ip et al., Citation2017). DSP can bind to glucocorticoid receptors in target cells and inhibit the transcription of pro-inflammatory factors, thus inhibiting the development of inflammation (Oray et al., Citation2016). In our study, we co-delivery IL-10 pDNA and DSP by natural HSA to achieve significantly improved therapeutic efficacy of RA by the synergistic effect to promote M1-to-M2 polarization.
pDNA/DSP-NPs were prepared by the desolvation method, which was robust and repeatable and did not require any chemical attachments. In the preparation process, we added ethanol to albumin to reduce the solubility, so that the albumin can be separated. To completely stabilize the preparation, we added glutaraldehyde to cross-link with the nanoparticle by the combination of the aldehyde of glutaraldehyde with the amino of albumin (Karami et al., Citation2020). DLS results displayed that the particle size of pDNA/DSP-NPs increased from 160 nm to 242 nm, and the potential decreased from −34 mV to −22 mV compared with single-drug nanoparticles. It’s reported that HSA-based nanoparticles with a small amount of negative charge had a longer cycle time and was better RA targeting effect (Blanco et al., Citation2015; Ren et al., Citation2019), which was also proved by our in vivo biodistribution results. The reason might be that nanoparticles with a slightly negative charge were less likely to interact with serum proteins and blood cells than those with a slightly positive charge, further increasing their systemic circulation time (Patel and Moghimi, Citation1998; Chen et al., Citation2010). Pharmacokinetic and real-time fluorescence imaging results also confirmed that the nanoparticle had a longer drug retention time and accumulation. pDNA/DSP-NPs showed favorable stability (), which also might be attributed to the strong charge on the surface of nanoparticles enhancing the electrostatic repulsion, thus reducing the aggregation of pDNA/DSP-NPs nanoparticles and improving the stability. The results of in vivo therapeutic efficacy showed that pDNA/DSP-NPs had the best therapeutic effect because of the higher accumulation and longer time in inflammatory joints. To sum up, the combination of IL-10 pDNA and DSP can better inhibit the progression of RA compared with the existing monotherapy.
5. Conclusion
In this study, we designed HSA-based pDNA/DSP-NPs by desolvation method for RA treatment. This biomimetic drug delivery could extend blood circulation, selectively accumulated in inflammatory tissues, and gradually release drugs in disease sites. In vivo, real-time fluorescence imaging experiment showed that DID-labeled HSA nanoparticles gathered in larger numbers in inflammatory joints of CIA rats than free DID. Furthermore, it exhibited that co-delivery nanoparticles significantly enhanced the therapeutic effect by promoting macrophage polarization from M1 to M2 type, compared to single-drug nanoparticles. The safety experiment proved that this biomimetic nanoparticle significantly inhibited joint inflammation in CIA rats without obvious systemic toxicity. Therefore, our strategy may provide a promising basis for the IL-10 pDNA and DSP to the treatment of RA by synergistic effect, which also reduced the side effects of DSP, and showed greater clinical application prospects.
Supplemental Material
Download MS Word (1.7 MB)Acknowledgments
All authors are grateful for assistance from the following research platforms: the Key Laboratory of Medical Electrophysiology of the Ministry of Education, the Experimental Center of Basic Medicine, and the School of Pharmacy at Southwest Medical University (Luzhou, Sichuan).
Disclosure statement
No potential conflict of interest was reported by the author(s).
Additional information
Funding
References
- Barnes PJ. (1998). Anti-inflammatory actions of glucocorticoids: molecular mechanisms. Clin Sci (Lond) 94:557–72.
- Baschant U, Lane NE, Tuckermann J. (2012). The multiple facets of glucocorticoid action in rheumatoid arthritis. Nat Rev Rheumatol 8:645–55.
- Blanco E, Shen H, Ferrari M. (2015). Principles of nanoparticle design for overcoming biological barriers to drug delivery. Nat Biotechnol 33:941–51.
- Brand DD, Latham KA, Rosloniec EF. (2007). Collagen-induced arthritis. Nat Protoc 2:1269–75.
- Briggs J, Chamboredon S, Castellazzi M, et al. (2002). Transcriptional upregulation of SPARC, in response to c-Jun overexpression, contributes to increased motility and invasion of MCF7 breast cancer cells. Oncogene 21:7077–91.
- Castillo P, Kolls JK. (2016). IL-10: a paradigm for counterregulatory cytokines. J Immunol 197:1529–30.
- Chen Q, Chen J, Liang C, et al. (2017). Drug-induced co-assembly of albumin/catalase as smart nano-theranostics for deep intra-tumoral penetration, hypoxia relieve, and synergistic combination therapy. J Controlled Release 263:79–89.
- Chen T, Wang RT, Wang Z, et al. (2010). Construction and evaluation of non-specific targeting cationic polymer lipid liposomes. Yao Xue Xue Bao 45:359–64.
- Crielaard BJ, Rijcken CJ, Quan L, et al. (2012). Glucocorticoid-loaded core-cross-linked polymeric micelles with tailorable release kinetics for targeted therapy of rheumatoid arthritis. Angew Chem Int Ed Engl 51:7254–8.
- Degboé Y, Rauwel B, Baron M, et al. (2019). Polarization of rheumatoid macrophages by TNF targeting through an IL-10/STAT3 mechanism. Front Immunol 10:3.
- Derosa CA, Furusato B, Shaheduzzaman S, et al. (2012). Elevated osteonectin/SPARC expression in primary prostate cancer predicts metastatic progression. Prostate Cancer Prostatic Dis 15:150–6.
- Fickenscher H, Hör S, Küpers H, et al. (2002). The interleukin-10 family of cytokines. Trends Immunol 23:89–96.
- Fosgerau K, Hoffmann T. (2015). Peptide therapeutics: current status and future directions. Drug Discov Today 20:122–8.
- Ip WKE, Hoshi N, Shouval DS, et al. (2017). Anti-inflammatory effect of IL-10 mediated by metabolic reprogramming of macrophages. Science 356:513–9.
- Jain S, Tran TH, Amiji M. (2015). Macrophage repolarization with targeted alginate nanoparticles containing IL-10 plasmid DNA for the treatment of experimental arthritis. Biomaterials 61:162–77.
- Karami E, Behdani M, Kazemi-Lomedasht F. (2020). Albumin nanoparticles as nanocarriers for drug delivery: focusing on antibody and nanobody delivery and albumin-based drugs. J Drug Delivery Sci Technol 55:101471.
- Li H, Feng Y, Zheng X, et al. (2022). M2-type exosomes nanoparticles for rheumatoid arthritis therapy via macrophage re-polarization. J Control Release 341:16–30.
- Li J, Chen L, Xu X, et al. (2020). Targeted combination of antioxidative and anti-inflammatory therapy of rheumatoid arthritis using multifunctional dendrimer-entrapped gold nanoparticles as a platform. Small 16:2005661.
- Lin X, Xie J, Niu G, et al. (2011). Chimeric ferritin nanocages for multiple function loading and multimodal imaging. Nano Lett 11:814–9.
- Liu L, Hu F, Wang H, et al. (2019). Secreted protein acidic and rich in cysteine mediated biomimetic delivery of methotrexate by albumin-based nanomedicines for rheumatoid arthritis therapy. ACS Nano 13:5036–48.
- Look J, Wilhelm N, von Briesen H, et al. (2015). Ligand-modified human serum albumin nanoparticles for enhanced gene delivery. Mol Pharm 12:3202–13.
- Lyu J, Wang L, Bai X, et al. (2021). Treatment of rheumatoid arthritis by serum albumin nanoparticles coated with mannose to target neutrophils. ACS Appl Mater Interfaces 13:266–76.
- Mi FL, Burnouf T, Lu SY, et al. (2017). Self-targeting, immune transparent plasma protein coated nanocomplex for noninvasive photothermal anticancer therapy. Adv Healthcare Mater 6:1700181.
- Mosser DM, Zhang X. (2008). Interleukin-10: new perspectives on an old cytokine. Immunol Rev 226:205–18.
- Oray M, Abu Samra K, Ebrahimiadib N, et al. (2016). Long-term side effects of glucocorticoids. Expert Opin Drug Saf 15:457–65.
- Pandey S, Mahtab A, Rai N, et al. (2017). Emerging role of CD44 receptor as a potential target in disease diagnosis: a patent review. Recent Pat Inflamm Allergy Drug Discov 11:77–91.
- Patel HM, Moghimi SM. (1998). Serum-mediated recognition of liposomes by phagocytic cells of the reticuloendothelial system - the concept of tissue specificity. Adv Drug Deliv Rev 32:45–60.
- Quan L, Zhang Y, Dusad A, et al. (2016). The evaluation of the therapeutic efficacy and side effects of a macromolecular dexamethasone prodrug in the collagen-induced arthritis mouse model. Pharm Res 33:186–93.
- Rall LC, Rosen CJ, Dolnikowski G, et al. (1996). Protein metabolism in rheumatoid arthritis and aging. Effects of muscle strength training and tumor necrosis factor alpha. Arthritis Rheum 39:1115–24.
- Ren H, He Y, Liang J, et al. (2019). Role of liposome size, surface charge, and PEGylation on rheumatoid arthritis targeting therapy. ACS Appl Mater Interfaces 11:20304–15.
- Sparks JA. (2019). Rheumatoid arthritis. Ann Intern Med 170:ITC1–itc16.
- Tan T, Huang Q, Chu W, et al. (2022). Delivery of germacrone (GER) using macrophages-targeted polymeric nanoparticles and its application in rheumatoid arthritis. Drug Deliv 29:692–701.
- Teng MW, Darcy PK, Smyth MJ. (2011). Stable IL-10: a new therapeutic that promotes tumor immunity. Cancer Cell 20:691–3.
- Tian L, Chen Q, Yi X, et al. (2017). Radionuclide I-131 labeled albumin-paclitaxel nanoparticles for synergistic combined chemo-radioisotope therapy of cancer. Theranostics 7:614–23.
- van der Woude D, van der Helm-van Mil AHM. (2018). Update on the epidemiology, risk factors, and disease outcomes of rheumatoid arthritis. Best Pract Res Clin Rheumatol 32:174–87.
- Vandewalle J, Luypaert A, De Bosscher K, et al. (2018). Therapeutic mechanisms of glucocorticoids. Trends Endocrinol Metab 29:42–54.
- Wang Q, Jiang J, Chen W, et al. (2016). Targeted delivery of low-dose dexamethasone using PCL-PEG micelles for effective treatment of rheumatoid arthritis. J Control Release 230:64–72.
- Wang Q, Sun X. (2017). Recent advances in nanomedicines for the treatment of rheumatoid arthritis. Biomater Sci 5:1407–20.
- Wang Y, Smith W, Hao D, et al. (2019). M1 and M2 macrophage polarization and potentially therapeutic naturally occurring compounds. Int Immunopharmacol 70:459–66.
- Wei X, Wu J, Zhao G, et al. (2018). Development of a janus kinase inhibitor prodrug for the treatment of rheumatoid arthritis. Mol Pharm 15:3456–67.
- Yan F, Li H, Zhong Z, et al. (2019). Co-delivery of prednisolone and curcumin in human serum albumin nanoparticles for effective treatment of rheumatoid arthritis. Int J Nanomedicine 14:9113–25.
- Zhao P, Wang Y, Wu A, et al. (2018). Roles of albumin-binding proteins in cancer progression and biomimetic targeted drug delivery. Chembiochem 19:1796–805.
- Zhong J, Zhang Q, Zhang Z, et al. (2022). Albumin mediated reactive oxygen species scavenging and targeted delivery of methotrexate for rheumatoid arthritis therapy. Nano Res 15:153–61.