
 ?Mathematical formulae have been encoded as MathML and are displayed in this HTML version using MathJax in order to improve their display. Uncheck the box to turn MathJax off. This feature requires Javascript. Click on a formula to zoom.
Abstract
The increase in the production of melanin level inside the skin prompts a patient-inconvenient skin color disorder namely; melasma. This arouses the need to develop efficacious treatment modalities, among which are topical nano-delivery systems. This study aimed to formulate functionalized chitosan nanoparticles (CSNPs) in gel form for enhanced topical delivery of alpha-arbutin as a skin whitening agent to treat melasma. Ionic gelation method was employed to prepare α-arbutin-CSNPs utilizing a 24 full factorial design followed by In vitro, Ex vivo and clinical evaluation of the nano-dispersions and their gel forms. Results revealed that the obtained CSNPs were in the nanometer range with positive zeta potential, high entrapment efficiency, good stability characteristics and exhibited sustained release of α-arbutin over 24 h. Ex vivo deposition of CSNPs proved their superiority in accumulating the drug in deep skin layers with no transdermal delivery. DSC and FTIR studies revealed the successful amorphization of α-arbutin into the nanoparticulate system with no interaction between the drug and the carrier system. The comparative split-face clinical study revealed that α-arbutin loaded CSNPs hydrogels showed better therapeutic efficacy compared to the free drug hydrogel in melasma patients, as displayed by the decrease in: modified melasma area and severity index (mMASI) scores, epidermal melanin particle size surface area (MPSA) and the number of epidermal monoclonal mouse anti–melanoma antigen recognized by T cells-1 (MART-1) positive cells which proved that the aforementioned system is a promising modality for melasma treatment.
1. Introduction
Melasma is defined as an extremely prevailing acquired and benign chronic hypermelanosis, characterized by the presence of symmetrical light to dark-brown patches and macules. It is attributed to melanocytes' hyperactivity on several face regions, such as the forehead, malar region, and chin. It is widely spread in women during their reproductive age, accounting for 90% of the melasma cases (Prignano et al., Citation2007). Other triggering factors such as genetic susceptibility, sun exposure, pregnancy, cosmetics, hormonal disturbances, anti-seizure medications, and photosensitizing drugs can contribute to this skin disorder (Shankar et al., Citation2014). Accordingly, preparing an appropriate formulation for the topical treatment of melasma is an important approach.
Nowadays, polymeric-based drug delivery systems are acquiring extreme consideration in treating several dermatological diseases on the account of their ability to ameliorate drugs' activity, sustain and control drugs' release, and augment drugs' deposition or retention inside the skin, thus enhancing their therapeutic efficacy (Hatem et al., Citation2020). Among the promising topical polymeric systems are the chitosan nanoparticles (CSNPs). Chitosan is the N-deacetylated chitin derivative, constituted mainly of N-acetyl-D-glucosamine and D-glucosamine units. It is a natural, biocompatible, nontoxic, biodegradable and cationic polymer with reported topical merits owing to its high positivity, penetration enhancement potential, sun screening and skin protection effects (ElShazly et al., Citation2021).
Arbutin was reported to be a potent skin whitening or depigmenting agent that can interfere with melanin synthesis and accumulation. Arbutin is a naturally occurring beta-D-glucopyranoside hydroquinone derivative, existing in the dried leaves of specific plant species, like bearberry in two different isomeric forms; alpha and beta. It acts by suppressing the tyrosinase enzyme present in the melanosomes, which boosts melanin production at non-cytotoxic concentrations other than reducing the synthesis and expression of such enzyme (Zhu & Gao, Citation2008). It is reported that arbutin's activity comes from its structural homologies with its substrate (tyrosine), which causes the competitive suppression of tyrosinase catalytic activity (Sugimoto et al., Citation2004). A number of studies have revealed that alpha-arbutin (α-arbutin) (or 4-hydroxyphenyl alpha-glucopyranoside) shows more substantial inhibitory potential on human tyrosinase, reaching ten times greater effect compared to beta-arbutin, which promotes its efficacy in attaining the required whitening effect on the skin (Yang et al., Citation2018).
Moreover, several studies reported the clinical efficacy of other polymeric additives such as hyaluronic acid (HA) and collagen (COLL) in several cosmeceutical formulations, since they were reported to protect skin against ultraviolet irradiation owing to their anti-oxidant and free radical scavenging characteristics (Trommer et al., Citation2003). Additionally, a number of studies reported their efficacy as an adjunctive modality for melasma treatment (Zhuang & Sun, Citation2012; Ibrahim et al., Citation2015; Kwon et al., Citation2016; Jacobus Berlitz et al., Citation2019). Therefore, the use of α-arbutin polymeric systems based on chitosan nanoparticles, augmented with both functional additives; hyaluronic acid and collagen, in treatment of melasma would present a potentially safe and efficacious treatment modality that overcomes side effects associated with the traditional treatment strategies, such as light and laser technologies which may cause a rebound effect after using intense pulsed light through the association to post-inflammatory hyperpigmentation (Neagu et al., Citation2021), chemical peelings which may cause skin inflammation and lead to exacerbation of melasma (Prabha et al., Citation2014) or conventional topical dosage forms which may result in insufficient permeation through skin (Wen et al., Citation2006).
Till current date, minor investigations about the clinical effectiveness of α-arbutin nanoparticles were reported; however, a previous study reported the therapeutic efficacy of vitamin C nanosome iontophoresis in melasma treatment in Egyptian women compared to 70% glycolic acid peel (Sobhi & Sobhi, Citation2012). Consequently, the present study is pioneer in investigating the potentiality of functionalized chitosan nanoparticles encapsulating α-arbutin, as auspicious cosmeceutical agent in the treatment of melasma, to augment therapeutic efficacy.
2. Materials and methods
2.1. Materials
Alpha arbutin, hyaluronic acid sodium salt (sodium hyaluronate) super low molecular weight (8 kDa) and hydrolyzed fish collagen peptide (2 kDa) were purchased from Making Cosmetics Scientific Company, USA. Carbopol 940, chitosan [(from shrimp shells) (low molecular weight 50 kDa with a degree of acetylation of 75%)], tripolyphosphate sodium salt (TPP), triethanolamine and caffeine were purchased from Alpha Aesar, Germany. Acetonitrile (HPLC grade), methanol (HPLC grade), sodium chloride, glacial acetic acid, disodium hydrogen phosphate and potassium dihydrogen phosphate were purchased from El-Gomhorea pharmaceutical company, Cairo, Egypt. Nanosep® centrifuge tubes with an ultra-filter of a molecular weight cut off 100 kDa were purchased from Pall Life Sciences (USA). Formalin, Masson Fontana stain, phosphotungistic acid and Spectra/Por dialysis membrane with molecular weight cut off 12,000–14,000 and of average flat width 33 mm (1.3 in) were purchased from Sigma Aldrich Chemical Co. (St Louis, MO, USA). Monoclonal mouse anti–melanoma antigen recognized by T cells-1 (MART-1) stain was purchased from Thermo Scientific, Lab Vision Co. (Fremont, CA, USA).
2.2. Methods
2.2.1. Preparation of α-arbutin-CSNPs
α-arbutin-CSNPs were formulated using the ionic gelation occurring between the positively charged chitosan and the negatively charged TPP ions (Calvo et al., Citation1997; Ayumi et al., Citation2019). It involves the solubilization of chitosan in 1% acetic acid solution (Hassan et al., Citation2016) applying magnetic stirring (Lab Tech LMS −1003, Korea) for one hour at two concentrations of 0.15 and 0.30% w/v (selected based on a preliminary study, data are not shown). CSNPs were formed following the dropwise addition of four ml of an aqueous solutions of sodium TPP (adjusted with 0.1 M HCl to pH 2) using a digital pH meter (JENWAY 3505, UK) to ten ml of chitosan solutions containing 10 mg α-arbutin (adjusted with 0.1 M NaOH to pH 5) under magnetic stirring (Lab Tech LMS −1003, Korea) at 600 r.p.m for 2 h at ambient temperature (Ayumi et al., Citation2019). The concentrations of sodium TPP aqueous solution was studied at two levels of 0.05 and 0.10% w/v (selected based on a preliminary study, data are not shown). In some formulations, the TPP solution contained functional additives of HA and/or COLL at concentration of 0.10% w/v for each (Nasti et al., Citation2009). The composition of the formulations is listed in .
Table 1. Full factorial design setup showing the values of the dependent and independent factors.
A 24 full factorial design study was constructed using Design Expert® 11 (StatEase, USA) to study the major effects and interactions of four chosen formulation factors (independent variables) at two different levels each (levels were set based on preliminary study, data are not shown). The four independent factors were the concentration of chitosan (XA), the concentration of TPP (XB), the concentration of HA (XC) and the concentration of collagen (XD) and their effects on the nanoparticles’ characteristics namely; particle size (P.S), poly dispersity index (PDI), zeta potential (ζ-potential) and percent entrapment efficiency (EE%) (as dependent variables) were studied as presented in . Sixteen runs for α-arbutin-loaded CSNPs formulae were separately prepared. Polynomial equations were fit to the results to investigate the impact of the independent factors on the dependent ones as described in EquationEquation (1)(1)
(1) :
(1)
(1)
where, Y is the dependent variable (P.S, PDI, ζ-potential or EE %), βi(s) are the multiple regression coefficients estimating the effect of the main factors and interactions (involving two, three and four-factor interactions),
are the four chosen independent factors, ε: the residual error of the model. The model was assessed regarding statistical analysis utilizing ANOVA, correlation coefficient (R2), adjusted (R2), predicted (R2) and adequate-precision. Factorial and statistical analyses were carried out employing Design-Expert® version 11 (StatEase, Minneapolis, USA).
Three dimensional (3D) response surfaces were constructed presenting the effect of the studied factors on the nanoparticles’ characteristics. Checkpoint analysis was conducted to validate the reliability of the proposed model in predicting CSNPs behavior (Nasr et al., Citation2011). Four points were selected at intermediate fixed value for variables XA and XB and at the high and low levels of variables and
where, XA= 0.20%, XB= 0.08, XC= 0.00 or 0.10% and XD= 0.00 or 0.10%. To assess the agreement arising between the actual and predicted values of the dependent variables, bias % was computed applying the following equation:
(2)
(2)
Bias (%) up to 10% was considered acceptable and confirms the validation of the statistical model as previously applied by Nasr et al. (Citation2011).
2.2.2. Characterization of α-arbutin-CSNPs
2.2.2.1. Determination of the particle size (P.S), polydispersity index (PDI), and zeta potential (ζ-potential) of CSNPs
The P.S, PDI, and ζ-potential of the prepared α-arbutin-CSNPs were assessed utilizing dynamic light scattering particle size analyzer (model ZS3600, Malvern Instruments Ltd., Worcestershire, UK), following appropriate dilution with water (Omar Zaki et al., Citation2015; Debnath et al., Citation2018; Rahat et al., Citation2021).
2.2.2.2. Determination of α-arbutin entrapment efficiency (EE%) in CSNPs
The free (unentrapped) drug was separated from the entrapped drug present in the nanoparticles using Nanosep® centrifugal tubes (Chen et al., Citation2008; Abdel-Hafez et al., Citation2018). A volume of the CSNPs dispersion equivalent to 0.5 ml was inserted in the Nanosep® centrifugal tubes and centrifuged in a high-Speed cooling centrifuge (SIGMA-3-30KS, Germany) for 30 min at 3000 rpm at −4 °C. The free (unentrapped) α-arbutin was quantified in the filtrate after dilution with distilled water utilizing UV-spectrophotometer (Biochrom Libra S60, UK) at 283 nm, using distilled water as blank. The entrapment efficiency (EE%) was computed applying the subsequent equation (Abdel-Hafez et al., Citation2018):
(3)
(3)
where At is the total amount (entrapped and unentrapped) of α-arbutin loaded to the formulation, and Af is the amount of the unentrapped (free) α-arbutin.
2.2.2.3. Physical stability of α-arbutin-CSNPs
The physical stability of the prepared α-arbutin-CSNPs was evaluated by re-measuring their P.S, PDI, ζ-potential and EE% after three months of storage at refrigeration temperature (2–8 °C) (Ayumi et al., Citation2019).
2.2.3. Selecting and characterization of the optimized formulations
The desirability function compromising a number of mathematical equations was employed to choose the formulation(s) with the most appropriate characteristics from the other prepared formulations as applied in a previous study by Abdel-Salam et al. (Citation2017). The main characteristics were the P.S, PDI, ζ-potential, and EE%. Responses mentioned above were ordered with ranks between 0 and 1. Moreover, the targeted criteria were minimizing the P.S and PDI whereas, maximizing both ζ-potential and EE%. Formulation(s) possessing the highest rank was selected to be the most suitable formulation for the forthcoming investigations. The following equations were applied by Mashru et al. (Citation2005).
(4)
(4)
(5)
(5)
where, Di is each formulation rank within each response, Yi is the actual response value, Ytarget is the targeted response value, Ymax is the maximum response value, Ymin is the minimum response value.
Each formulation total rank was calculated employing the corresponding equation:
(6)
(6)
Where Dtotal is the total desirability value of all di (desirability coefficient of each formulation), n is the number of investigated responses.
2.2.3.1. In-vitro release of the selected α-arbutin-CSNPs
The in vitro release of α-arbutin from the four selected CSNPs formulae was evaluated using Hanson Franz-type diffusion apparatus (model 60–301-106, CA, Los Angeles, USA) (Ayumi et al., Citation2019). The cellulose membranes were cut into suitable size and dipped in phosphate buffer saline (PBS, pH 7.4) to hydrate them for one hour before running the experiment. Each membrane was clinched between the donor and receiver chamber of the vertical diffusion cells (of 1.77 cm2 area). Moreover, the receptor medium was provided with 7.2 ml PBS (pH 7.4), which was continuously stirred at 600 rpm at 32 ± 0.5 °C (Pande et al., Citation2014) for 24 h.
A specific volume of the selected α-arbutin-CSNPs formulations equivalent to 1 mg α-arbutin was inserted in the donor chamber. An α-arbutin solution in distilled water was employed as control. Meanwhile, two milliliters of the release medium were withdrawn at the predetermined time intervals (0.25, 0.5, 1, 2, 4, 6, 8, 12, and 24 h) and compensated with equal volume of fresh medium to preserve sink conditions. The amount of released α-arbutin from CSNPs was quantified spectrophotometrically at ƛmax of 283 nm, using PBS (pH 7.4) as blank. The obtained release data were fitted to a number of kinetic models (Zero order, First order and Higuchi diffusion models) and results were further confirmed using Korsmeyer–Peppas equation to assess the correct mechanism of drug release from CSNPs formulations as previously applied by Rahat et al. (Citation2021).
2.2.4. Preparation of the optimized CSNPs in hydrogel-based formulations
To sustain the formulations’ contact time on the skin, the selected α-arbutin-CSNPs liquid dispersions were transformed to hydrogels utilizing 1% Carbopol 940 (as the gelling agent) (Ramesh and Sireesha, Citation2017), which was added slowly to the dispersions under magnetic stirring (Lab Tech LMS −1003, Korea) to avoid agglomeration. Triethanolamine was used to induce gelation (Aiyalu et al., Citation2016).
2.2.5. Characterization of the CSNPs-hydrogel formulations
α-Arbutin-CSNPs hydrogel formulations were evaluated in terms of:
2.2.5.1. Organoleptic characteristics
The hydrogel formulations were assessed regarding their physical appearance, clarity, texture, color, homogeneity, and phase separation (Gupta and Gupta, Citation2017).
2.2.5.2. Spreadability
It involves measuring the diameter of spreading 1 g of the formulation being encompassed horizontally between an upper and lower glass plates (10 × 20 cm) following the application of 25 g weight on the upper plate (Chen et al., Citation2016). The formed circles' diameters were measured and employed as comparative values for determination of formulations' spreadability (Samy et al., Citation2013).
2.2.5.3. pH values
A defined weight of the formulations equivalent to one gram was dispersed in a volume of 25 mL of deionized water, where the pH was measured using a digital pH meter (JENWAY 3505, UK). The pH of the hydrogels must adhere to normal skin pH (4–7) to avoid any possible irritation (Samy et al., Citation2013; Gupta and Gupta, Citation2017).
2.2.5.4. Viscosity measurement
It was carried out using Brookfield viscometer (model DV3THBCJO, USA) with an attached computer software at 25∘C ± 0.2. The spindle was rotated at 5, 10, 20, 50, 100, 150, 200 and 250 rpm values. For each formulation, the flow behavior was estimated by plotting the shear stress (F) against the shear rate (G) values, which was further investigated by applying Farrow's equation:
(7)
(7)
where G is the shear rate (sec−1), F is the shear stress (dyne/cm2), N is Farrow’s constant, while η is the viscosity (cP).
When N = 1, it reveals Newtonian flow, while N < 1 reveals dilatant flow (i.e. shear rate thickening). Whereas, N > 1 reveals pseudoplastic or plastic flow (i.e. shear rate thinning) (Chen et al., Citation2004).
2.2.5.5. Physical stability
The hydrogel formulations were subjected to three months storage in the refrigerator (2–8 °C) and examined for all physical parameters, including changes in the pH, color, physical appearance, homogeneity, texture, spreadability and viscosity (Samy et al., Citation2013).
2.2.5.6. In vitro release
The release of α-arbutin from selected CSNPs hydrogel formulations was conducted utilizing the Franz diffusion apparatus. A constant amount (1.42 gm) of the chosen α-arbutin-CSNPs hydrogel formulations equivalent to 1 mg α-arbutin was inserted in the donor chamber and compared to α-arbutin hydrogel containing an equivalent amount of free α-arbutin. The rest of the procedure was performed as previously described with the CSNPs liquid dispersions.
2.2.6. Ex-vivo skin retention/permeation of the selected α-arbutin-CSNPs
Samples from dorsal rat skin (Kim et al., Citation2019) were excised into small square parts and stretched on the diffusion cells in which the stratum corneum faced the donor chamber in Franz-diffusion apparatus (Alam et al., Citation2016). The receptor chamber was occupied with 7.2 ml PBS (pH 7.4), which was continuously stirred at 600 rpm at 32 ± 0.5 °C (El-Kayal et al., Citation2019).
A comparative study was carried out between the selected α-arbutin-CSNPs liquid dispersions and their α-arbutin-CSNPs-hydrogel analogues to estimate their ability to retain the drug in the skin layers. Regarding the selected liquid dispersions, a constant volume of 1.4 ml equivalent to 1 mg α-arbutin was inserted in the donor chamber. An α-arbutin solution in distilled water encompassing an equal amount of α-arbutin was used as a control. Whereas, in case of the hydrogel formulations, a constant amount of 1.42 gm of the prepared α-arbutin-CSNPs hydrogel formulations equivalent to 1 mg α-arbutin was precisely weighed and inserted in the donor chamber, and compared to α-arbutin hydrogel containing the equivalent amount of α-arbutin. After 24 h, samples were automatically extracted from the receptor chamber, then the surface of the skin was rinsed ten times using distilled water and methanol, and wiped with filter paper to discard any excess drug. Afterwards, tape skin stripping was conducted ten times using adhesive tapes (Hatem et al., Citation2018), followed by detaching the dermis from the epidermis with a scalpel. Subsequently, tape strips as well as skin samples were dipped each in 20 ml methanol, then sonicated for a period of 30 minutes to extract the retained drug in each layer of the skin (Bsieso et al., Citation2015). Samples from the receptor chamber were also analyzed. Eventually, all samples were filtered and analyzed for α-arbutin content employing a validated UPLC (Agilent 1290 infinity, Germany) method developed in our laboratory. A linear gradient elution solvent system was conducted starting with 5% acetonitrile (HPLC grade) (mobile phase A) and 95% water (HPLC grade) (mobile phase B) for 0.8 min to reach 60% mobile phase A and 40% mobile phase B at 0.81 min at a flow rate of 0.3 ml/min with an injection volume of 10 μl into a C18 column at 205 nm, using caffeine as an internal standard (IS). The concentration of α-arbutin was estimated by computing the peak area ratio (PAR) of α-arbutin/caffeine.
2.2.7. Determination of the morphological characteristics of the selected CSNPs formulation utilizing transmission electron microscope (TEM)
The surface morphology of the selected formula depending on the prior results of the permeation study was examined utilizing TEM (JEM – 100S, Joel, Tokyo, Japan) following negative staining with 1% phosphotungstic acid (Wan et al., Citation2008).
2.2.8. Differential Scanning calorimetry (DSC) analysis
DSC analysis was performed to investigate the possibility of interaction of α-arbutin with the chosen excipients in the formulated nanoparticles. It was conducted utilizing a differential scanning calorimeter (DSC-50, Schimadzu, Kyoto, Japan) on each component used in the preparation of the selected CSNPs formula namely; pure α-arbutin, chitosan, TPP, HA and COLL. In addition, the physical mixtures of the five components mentioned above was performed together with α-arbutin-loaded CSNPs dispersion and its corresponding unloaded CSNPs. It involved an accurate weighing of 3–5 mg sample, then heating in sealed aluminum pans with a constant nitrogen gas flow of 50 mL/min as well as a constant rate of 10 °C/min over a range of 25–350 °C (Nair et al., Citation2019).
2.2.9. Fourier transform infrared (FT-IR) spectroscopy
For further assessment of a possible interactions between the nanoparticles’ components, FT-IR analysis was conducted over the region of 4000–400 cm−1 at room temperature on pure α-arbutin, chitosan, TPP, HA and COLL powders, selected α-arbutin-loaded CSNPs dispersion and its corresponding unloaded CSNPs dispersion applying the KBr disk method, using Bruker FT-IR spectrophotometer (Model 22, Bruker, UK) (Ayumi et al., Citation2019).
2.2.10. Clinical efficacy of α-arbutin-loaded CSNPs hydrogels in treatment of melasma
The present prospective comparative split-face study was conducted on 20 female patients suffering from epidermal melasma. Patients were divided into 2 groups: group I (10 patients) was treated with a thin film of topically applied CSNPs hydrogels (formula C5) over the affected area on the right side of the face and a thin film of α-arbutin hydrogels (as control having equivalent amount of the free drug) over the affected area on the left side of the face, while group II (10 patients) was treated with a thin film of topically applied CSNPs hydrogels (formula C8) over the affected area on the right side of the face and a thin film of α-arbutin hydrogels (as control having equivalent amount of the free drug) over the affected area on the left side of the face. They were chosen from the Dermatology out-patient clinic of Minya University Hospital, Al-Minya, Egypt. Inclusion criteria involved; female patients of 18–40 years old who suffered from melasma, and didn’t take any melasma medications since at least 1 month for systemic corticosteroids, 2 weeks for topical therapy and 3 months for dermal procedures such as dermabrasion, laser or chemical peels. However, the following were excluded from the current study; patients with rosacea or acne vulgaris, pregnant and lactating women and those on oral contraceptives. Moreover, patients were requested to sign an informed written consent before being enrolled and photographed in the study following a thorough procedure explanation. This study was approved by the Research Ethics Committee for clinical and experimental studies at Faculty of Pharmacy, Ain Shams University (ENREC ASU 2019-96); following the principles defined in Helsinki declaration for human subject experimentation. All patients were subjected to full history taking and dermatological examination before carrying out the study.
Moreover, patients in the 2 groups were instructed to apply the supplied formulation once daily at night over the affected areas for a total period of 2 months with follow-up visits every 2 weeks along with a daily application of sunscreen of SPF ≥50 in the morning over a 2 months period. Adverse effects such as erythema, burning sensation, hypo or hyperpigmentation and itching were investigated and noted throughout the study on both sides of the face in each study group. Patients were assessed clinically using photography/mMASI scoring and histopathologically using morphometric measurement of melanin and immunohistochemical evaluation.
2.2.10.1. Clinical assessment
It involved photographing of the face at baseline (before) and 2 months after the start of treatment. The modified melasma area and severity index (mMASI) was used to assess melasma lesions severity on the malar area (cheeks) on each side of the face by two independent blinded dermatologists before and 2 month after the start of treatment (Wattanakrai et al., Citation2010). The mMASI scoring was used to assess the pigmentation darkness, area and homogeneity in melasma patients (Pandya et al., Citation2006). Afterwards, reduction percentage in mMASI score was calculated as:
(8)
Grading of reduction percentage of mMASI score was performed according to Khunger et al. (Citation2004) as follows; 0%: no improvement, 1–25%: mild improvement, 26–50%: moderate improvement, 51–75%: good improvement and 76–100%: excellent improvement.
2.2.10.2. Histopathologic assessment
Skin biopsy samples were acquired employing 2 mm punch probes. In each side of the face, 2 skin biopsies were obtained from melasma lesions. The 1st one was taken at base line, while the 2nd was taken after treatment (2 months) from the nearest point to the 1st one. Initially, each biopsy was promptly embedded in 10%, v/v formalin, ordinarily processed, fixed in a paraffin block and sectioned using the ordinary microtome (model Leica RM2125 RTS, USA) into 5 µm thick sections. Then, the obtained sections were mounted on glass slides to be ready for staining with Masson Fontana (MF) (for staining of epidermal melanin) and immunohistochemical stain (MART-1) (monoclonal mouse anti–melanoma antigen recognized by T cells-1) (for staining the active epidermal melanocytes). Finally, a light microscope (Accu-Scope # 3025 five headed (A3025-5)-Olympus, Tokyo, Japan) together with a built-in camera (Olympus, digital camera E-330 SLR, Tokyo, Japan) was utilized to study and photograph the biopsy sections (Anbar et al., Citation2015).
Morphometric melanin measurement was used to measure the surface area of melanin pigment layer present in the epidermal layer for pre- and post-treated skin biopsies. The pigment is found predominantly in the basal and supra-basal epidermal layers (Machado-Pinto et al., Citation2006). Initially, the surface area of the epidermis was computed through outlining the epidermal boundaries using a computer-assisted program (Five Olympus Soft Imaging Solutions GmbH, Johann- Krane-Weg 39, D-48149, Munster, Germany). Then, the melanin particles in the basal layer of the epidermis were outlined using the same program. A scanning power microscope (Accu-Scope # 3025 five headed (A3025-5)-Olympus, Tokyo, Japan) together with a built-in camera (Olympus, digital camera E-330 SLR, Tokyo, Japan) was used to study the obtained sections, each comprising 10 fields. Afterwards, alternate fields were assessed utilizing X40 objective lens, which are 5 fields per section and the mean melanin particle surface area (MPSA) in μm2 as well as the reduction % of the values in pre- and post-treated biopsies of both sides of the face were computed for assessing epidermal melanin (Anbar et al., Citation2012).
In addition, immunohistochemical evaluation was attempted. It is a quantitative approach, which involves counting the number of MART-1- positively stained (active melanocytes) present in the basal layer of the epidermis in pre- and post-treated skin biopsies in 10 high-power fields using a scanning power microscope (Accu-Scope # 3025 five headed (A3025-5)-Olympus, Tokyo, Japan) together with a built-in camera (Olympus, digital camera E-330 SLR, Tokyo, Japan) and computing the mean value as well as the reduction % of the values in pre- and post-treated biopsies of both sides of the face (Saleh et al., Citation2018).
2.2.11. Statistical analysis of data
All non-clinical data were estimated as mean ± standard deviation (n = 3). Statistical analysis of the data was carried out using Graphpad® Instat software (Graphpad software Inc., Version 3.06, San Diego, California) applying One-way ANOVA followed by Tukey Kramer post-test. Factorial and statistical analyses were performed utilizing Design-Expert® version 11 (StatEase, Minneapolis, USA), for factorial design building, polynomial equations development, plotting the three-dimensional (3D) surface plots and the model evaluation regarding statistical significance utilizing ANOVA. For clinical experiments, statistical analysis included ANOVA test, paired Student’s t-test and independent t-test were carried out using software package for statistical Science (SPSS for Windows, Version 13.0.1; Chicago, IL, USA).
3. Results and discussion
3.1. Preparation of α-arbutin-CSNPs
CSNPs were efficiently prepared utilizing the ionic gelation technique. This method is the most commonly used one for preparing chitosan nanoparticles owing to the high stability of the produced particles, the utilization of water-based solutions without the inclusion of organic solvents, the mild reaction conditions besides being simple and cost effective (Delan et al., Citation2020). In the current method, CSNPs are synthesized owing to the ionic interaction between two oppositely charged species which are the positively charged amine groups present on the chitosan molecule and the negatively charged TPP anions (Ariadi Lusiana et al., Citation2017). Low molecular weight chitosan was chosen owing to its reasonable solubility and colloidal stability (Teja & Damodharan, Citation2018).
3.2. Experimental design and data analysis
Upon changing the four chosen independent variables namely; the concentration of chitosan (XA), the concentration of TPP (XB), the concentration of HA (XC) and the concentration of collagen (XD) each at 2 levels, 16 set of experiments were devised by Design-Expert® program, conducted and evaluated with respect to their P.S, PDI, ζ-potential and EE%. Three significant models constituting the P.S, PDI and EE% models were displayed, while, the ζ-potential model was statistically insignificant (p > .05) and data are better presented by their mean effects.
As shown in , the P.S of the CSNPs ranged from 340.25 to 572.80 nm. ANOVA results revealed the high significance (p < .0001) of the proposed model (Supplementary 1). Moreover, the model displayed of 0.9869, adjusted
of 0.9746 and a predicted
of 0.9475; which were considered to be adequately high values. The close correlation of the adjusted and predicted R2 indicates the model adequacy in predicting the PS of the formulated nanoparticles (Karimi et al., Citation2013). Additionally, an adequate-precision value of 18.106 was obtained assuring that the current model can be employed to navigate the design space. Furthermore, the Box-Cox plot for power transformations proved that the current lambda fell within the 95% confidence interval (CI), confirming no proposed data transformation (data not shown).
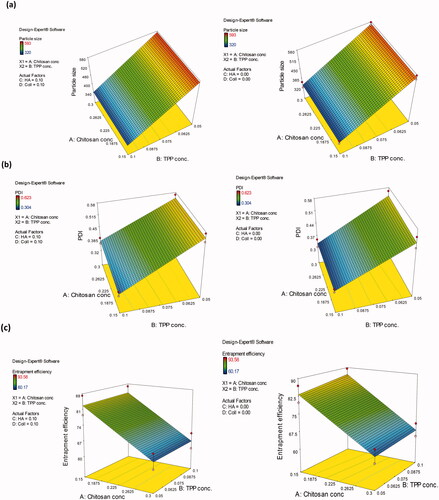
Results revealed that among the four independent variables, only the TPP concentration (XB) exhibited a significant effect on the P.S of the formulae which was evident from the highest contribution % value of (98.626%). As evident from the three-dimensional surface plots (), the P.S of CSNPs significantly decreased (p < .05) upon increasing the concentration of TPP from 0.05 to 0.10% w/v regardless of the concentration of the other factors. This could be ascribed to the high availability of TPP molecules, which in turn interact with the free primary amino groups of chitosan within the formed nanoparticles (Habib et al., Citation2018). It was suggested that additional incorporation of the TPP anion might have promoted the cross-linking internally between the long chitosan chains, causing them to be more tightly bound inside the nanoparticle, which leads to particles condensation, hence elucidating the reduction in the size of the formed CSNPs. Additionally, cross-linking also decreases the free primary amino groups' availability on chitosan molecule, hence preventing the nanoparticles from self-aggregation as reported previously by Masarudin et al. (Citation2015). The linear regression model-equation as extracted from the full factorial design analysis is displayed by EquationEquation (9)
(9)
(9) :
(9)
(9)
Figure 1. Three-dimensional surface plot of the influence of chitosan concentration and TPP concentration on: (a) P.S of the prepared CSNPs in the absence and presence of HA and collagen, (b) PDI of the prepared CSNPs in the absence and presence of HA and collagen, (c) EE% of α-arbutin in the prepared CSNPs in absence and presence of HA and collagen.
Checkpoint analysis is helpful in assessing the prediction power of the proposed model (Abd-Allah et al., Citation2016). Points were selected at the center of factors and
at low and high levels of factors
and
and as shown in , the actual and predicted responses showed a good agreement. Moreover, the computed biases were less than 10%. This proved the high prediction power of the model, recommending its utilization for optimizing the P.S of nano-delivery systems exhibiting comparable characteristics to CSNPs under the same experimental conditions.
Table 2. Checkpoint analysis for P.S, PDI and EE% models for the evaluation of the adequacy of the developed models.
The PDI of α-arbutin-CSNPs varied from 0.32 to 0.60 (). As shown in Supplementary 1, ANOVA results showed the significance of the proposed model (p < .0001). Furthermore, the model showed value of 0.9666, adjusted
of 0.9353, a predicted
of 0.8664 and an adequate-precision of 14.532; reflecting the model adequacy to predict the PDI of the nanoparticles, and assuring its ability to navigate the design space. The Box-Cox plot for power transformations revealed that the obtained lambda dropped within the 95% CI, hence no data transformation was required (data not shown).
Furthermore, the term was the only significant term (p < .0001) among the four studied ones, which was obvious from its highest percent contribution to the response (92.30%). As denoted from the three-dimensional surface plots (), the increase in TPP concentration from 0.05 to 0.10% w/v was coupled with a significant (p < .05) decrease in the PDI of CSNPs whatever the employed concentration of the other factors, which could be assigned to the simultaneous increase in cross-linking inside particles leading to smaller and more homogeneous particles’ distribution. The linear regression model as extracted from the analysis of the full factorial design is displayed by EquationEquation (10)
(10)
(10) :
(10)
(10)
Points were selected at the model center at low and high levels of factors and
and similar to what was encountered with particle size, there was a good correlation between the actual and predicted values as displayed in . Moreover, the estimated biases were approximately 10%, hence validating the constructed model.
All formulations were positively charged; with ζ-potential values varying from +36.55 to +41.71 mV (), indicating augmentation of the nano-dispersion stability owing to the electrostatic repulsion between the CSNPs (Khalil et al., Citation2013). ANOVA results showed the insignificance (p > .05) of the model as shown in Supplementary 1 and the results are better presented by the mean effects. The presence of high proportion of the positive amino group on the chitosan molecule together with the spontaneous generation of dense molecules with a generalized positive charge on their surface were the reason for the high positivity of the CSNPs (Abd-Allah et al., Citation2020).
The percent EE% of α-arbutin in CSNPs varied from 63.65 to 88.45% with (). As represented in the Supplementary Material 1, ANOVA results revealed the significance of the model (p < .0001). The model showed high values of (0.9210), adjusted
(0.8469), and moderate predicted
(0.6839), with high adequate-precision value (8.742). Similarly, the Box-Cox Plot for power transformations revealed that the estimated lambda fell within the 95% CI confirming that no power transformation was required (data not shown). Meanwhile, among the four independent variables, only chitosan concentration had significant effect on EE% (the term
p < .0001), which was obvious from its highest contribution % to the results (85.473%). It was obvious from the three-dimensional surface plots () that upon increasing the chitosan concentration from 0.15 to 0.30% w/v, the EE% of the prepared CSNPs decreased significantly (p < .05) regardless of the other factors' concentrations. This might be caused by the dramatic increase in viscosity and gel formation with increased chitosan concentration, which hindered the encapsulation of α-arbutin, thereby decreasing the encapsulation efficiency. This is in accordance with the findings of Gulati et al. (Citation2013) who studied the formulation of sumatriptan succinate into CSNPs.
The linear regression model is displayed by EquationEquation (11)(11)
(11) :
(11)
(11)
The selected points at the center of the model at low and high levels of factors and
showed good agreement with the actual responses as reported in , with estimated biases of 10%. This result verified acceptable predictability of the current model.
3.3. Physical stability of α-arbutin-CSNPs
CSNPs displayed insignificant (p > .05) changes in P.S, PDI and ζ-potential upon storage at 2-8 °C for three months indicating their stability for this period (data not shown). This might be ascribed to the positive charges located on the surface of CSNPs which causes particles’ repulsion, thus avoiding aggregation. Similar findings were reported by Al‐Rashed et al. (Citation2019) while investigating the factors affecting the stability of chitosan nanoparticles. Moreover, the slightly viscous nature of the prepared CSNPs dispersions could maintain the distance between the particles, thus hindering their agglomeration and augment their stability. This is in agreement with the results reported by Wang et al. (Citation2012) after the evaluation of chitosan coated nanoparticles encapsulating kojic acid as a skin whitening agent.
3.4. Selecting the optimized formulations (desirability study)
Upon applying the desirability equation, formulations revealed the highest total desirability values of 0.9 or more namely; C5, C6, C7, and C8 as presented in Supplementary 2 were selected for in vitro release as well as ex vivo deposition studies.
3.5. In-vitro release of the selected α-arbutin-CSNPs
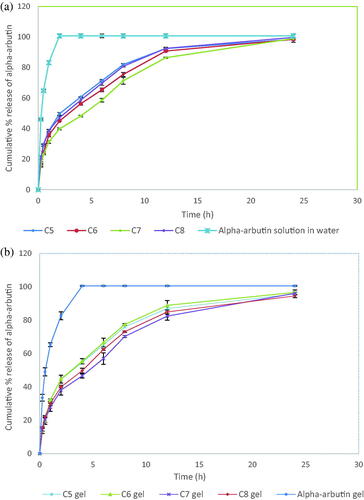
The in vitro release study was conducted on the selected CSNPs formulations (C5–C8) compared to α-arbutin solution in water serving as a control. Upon fitting the release data profile to the different kinetics models (zero, 1st and Higuchi), it was found that the data obtained didn’t discriminate between first order and Higuchi release models. Hence, the results were further fitted into Korsmeyer-Peppas equation for confirming the release mechanism of the drug from CSNPs formulae which showed n values of 0.43, 0.45, 0.39, and 0.36 for formulae C5, C6, C7, and C8, respectively (). This represents the Fickian transport of α-arbutin from the CSNPs dispersions through cellulose membrane using the diffusion cells confirming that the process is majorly governed by diffusion (Chauhan et al., Citation2017; Omwoyo & Moloto, Citation2019).
Table 3. Release kinetics and parameters of α-arbutin from the selected chitosan nanoparticles; dispersions and hydrogels versus their controls.
As shown in , upon investigating the release profiles of the four formulations, they showed sustained release of α-arbutin for 24 h as well as insignificantly (p > .05) different cumulative % release after the specified period with high extent of drug release reaching ≈ 100%. The free drug solution, however, presented rapid drug release through the cellulose membrane reaching 100% in 2 h. The sustained drug release pattern observed from the CSNPs formulations was similar to the findings encountered with Ayumi et al. (Citation2019) who described the slow release of α-arbutin from these nanoparticles despite its very hydrophilic nature, which mainly occurs by diffusion. It is obvious that the utilization of TPP as a crosslinking agent with chitosan enhances CSNPs mechanical strength through the internal crosslinking inside the nanoparticles, which prolongs the release of α-arbutin. It was also reported for several drugs that TPP cross linking helps in maintaining the polymeric matrix system for an extended period throughout the release time, hence reducing the burst effect of the drug and resulting in sustained release profile (Safdar et al., Citation2019).
Figure 2. Release profile of α-arbutin in PBS (pH 7.4) from: (a) CSNPs dispersions compared to drug solution and (b) CSNPs hydrogels compared to the control drug hydrogel.
3.6. Preparation of the optimized CSNPs in hydrogel-based formulations
Generally, hydrogel formulations are more favored when compared to other topical dosage forms, since they exhibit a longer skin residence time, higher viscosity, more bio-adhesiveness and hydration properties resulting in better moisturizing effect, lesser irritation potential, independence of the hydrophilicity of the active moiety along with ease of application and greater release merits (Loganathan et al., Citation2001). Carbopol 940 in 1% w/v concentration was employed as a gelling agent dispersed in CSNPs formulations (C5–C8) as it is bioadhesive, biocompatible, nonirritant as well as being unabsorbable by the body (Aiyalu et al., Citation2016). Meanwhile, it allows the formation of clear and stable gel formulations after neutralization with triethanolamine, which also adjust the pH of the formulations to suit the skin application (Pervaiz et al., Citation2020).
3.7. Characterization of the CSNPs-hydrogel formulations
Regarding the organoleptic characters, the four gelatinized formulations (C5–C8) were clear, smooth, homogenous and lacking phase separation. Moreover, the gel formulations were able to spread easily on applying a slight amount of shear showing comparable (p > .05) spreadability values of 3.85 ± 0.07 cm2, 3.80 ± 0.14 cm2, 4.05 ± 0.21 cm2 and 4.00 ± 0.14 cm2 for formulae C5, C6, C7, and C8, respectively after applying 25 g weight. Moreover, the pH values ranged from 4.82 to 5.05 for all formulae (p > .05), which came in agreement with the acceptable physiological range (pH 4–7 units), delineating them as safe and nonirritant formulations for topical application (Samy et al., Citation2013).
The rheological properties of the selected formulations were examined where the viscosity was found to decrease with increasing the shear rates, in which ɳ at maximum shear stress/ɳ at minimum shear stress were 1609.69 cP/61499.6 cP, 1756.9 cP/66213.4 cP, 1635.9 cP/65145.5 cP, and 2321.75 cP/57309.5 cP for formulations C5, C6, C7, and C8, respectively. Furthermore, fitting the results to Farrow’s equation revealed (R2) values of 0.9914, 0.9777, 0.9879 and 0.9835 for the same formulations, respectively with Farrow’s constants (N) of 3.406, 3.648, 3.639 and 3.855, respectively, which are higher than 1, indicating the non-Newtonian, pseudoplastic flow. This pseudoplastic flow behavior is preferable for the dermal application of semi-solid drug delivery systems, as it facilitates the application on the surface of the skin upon applying low friction force (Özcan et al., Citation2013).
Moreover, the four hydrogel formulations were characterized for their in-vitro release according to the method previously described with the CSNPs dispersions. The selected CSNPs hydrogel formulations were found to follow Higuchi diffusion release kinetics similar to the findings of Parente et al. (Citation2015) who studied the formulation of bioadhesive hydrogels for cosmetic applications. Further fitting of the results into Korsmeyer-Peppas equation for confirming the release mechanism of CSNPs hydrogel formulations showed n values of 0.50, 0.50, 0.43 and 0.42 for hydrogel formulations C5, C6, C7 and C8, respectively, hence confirming the Fickian diffusion nature of α-arbutin from the CSNPs hydrogels ().
As shown in , the four hydrogel formulations displayed more than 95% release within 24 h. Upon inspecting their release profile, it was observed that they achieved higher sustained release profile when compared to the control α-arbutin hydrogel, in which a rapid drug release reaching 100% was attained after four h. However, the control gel exhibited slower and more sustained release rate through the cellulose membrane, extending over 4 h compared to its analogue drug solution in water (2 h), amplifying the effect of hydrogel delivery systems on sustaining α-arbutin release. These findings confirmed the sustained drug release action of CSNPs hydrogel formulations, in which the drug was released more slowly (p < .05) compared to their corresponding water dispersions, especially in the first 6 h. This was ascribed to the hydrogels' swelling mechanism that might have resulted in further slowness in the drug release from the CSNPs (Wani et al., Citation2019). The double entrapment of α-arbutin initially in the CSNPs and then inside the viscous hydrogel matrix lead to the sustainment of the release rate, however, at the end of the 24 h period, the four selected hydrogel formulations displayed insignificantly (p > .05) different extent of release compared to the CSNPs dispersions ().
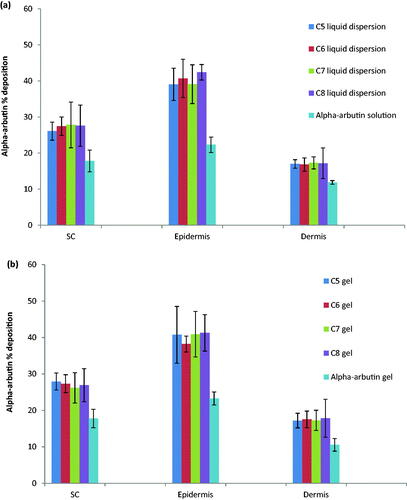
Figure 3. Percent α-arbutin ‘deposited in/permeated through’ skin layers from the selected formulations (C5–C8) as: (a) liquid dispersions compared to drug solution in PBS (pH, 7.4) and (b) gels compared to drug hydrogel control.
A physical stability study was conducted to investigate the effect of a three months storage at refrigeration temperature of 2-8 ± 1 °C on the physical appearance, color, texture, homogeneity, spreadability, pH and viscosity of the hydrogel formulations. Results revealed that these hydrogel formulations exhibited insignificant (p > .05) changes in the recorded values of these parameters upon storage indicating their stability (data not shown).
3.8. Ex vivo skin retention/permeation of α-arbutin-CSNPs
The amount of α-arbutin deposited into stratum corneum (SC), epidermis and dermis or penetrated across the skin for CSNPs dispersion and α-arbutin solution was estimated as a percentage of the total amount of the applied α-arbutin on the skin. A comparable study between the CSNPs liquid dispersions and their corresponding hydrogels was conducted to investigate the influence of both dosage forms on drug's permeation through skin as shown in . Free α-arbutin analogues either in water dispersions or gel were utilized to serve as controls. It was observed that no drug was found in the receptor compartment for all the studied formulations, confirming the dermal rather the transdermal delivery of the drug from CSNPs forms. It can be concluded from the results that the percent deposition of the drug in different skin layers didn't differ significantly between the selected formulations either in liquid dispersions or their hydrogel form (p > .05), suggesting that CSNPs hydrogels did not retard skin deposition of the drug from nanoparticles at equilibrium similar to the results presented by Ramesh & Sireesha (Citation2017) who attempted the formulation of chitosan nanoparticles hydrogels incorporating ramipril. Upon investigating the deposition of α-arbutin in each layer of the skin, it was denoted that the highest α-arbutin content was deposited in the epidermal layer (38.22% ± 2.18 − 42.43% ±2.15) followed by the SC (26.09% ± 2.50 − 27.93% ± 2.35) and finally the dermal layer (16.83% ±1.85 − 17.85% ± 5.19). CSNPs were able to significantly augment the skin accumulation of α-arbutin reaching 1.5 folds higher in S.C, 1.7 folds higher in epidermis and 1.4 folds higher in the dermis in case of α-arbutin loaded-CSNPs formulations when compared to the controls. This enhancement in skin penetrability could be ascribed to the ability of the CSNPs to interact with the epidermal proteins located in the SC intercellular layers, which create penetration barrier inside the stratum granulosum underneath the SC lipid barrier as described previously (Ali and Lamprecht, Citation2017). Moreover, the cationic charge present on CSNPs surface enhances the electrostatic interaction occurring with the negatively charged dermal tissues and cell surfaces. It was reported previously that surface charges as well as nano size can improve the nanoparticles skin deposition (Contri et al., Citation2016). In addition, the slight acidity of these formulations (pH ≈ 4–5) tends to suit topical application as there won't be imbalance in the normal human skin acid mantle (pH= 5.4–5.9) (Ali and Yosipovitch, Citation2013). Furthermore, CSNPs are advantageous for loading hydrophilic molecules, supporting the penetrability of the entrapped active moiety through the human skin on the account of their interaction with SC lipids which in turn modifies the SC morphology, loosens the intercellular packing of corneocytes and widens the pores and tight junctions in skin, thus facilitating the skin permeation of the nanoparticles (Wani et al., Citation2019).
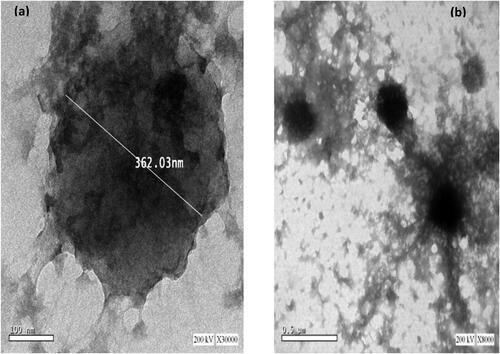
Figure 4. TEM photomicrographs of selected α-arbutin loaded CSNPs (C8) at 30000× (a), and 8000× (b).
The previous results suggest the promising deposition behavior of α-arbutin when formulated into CSNPs, which delineates this nanoparticulate system as a promising cosmeceutical delivery system. As concluded from the ex-vivo results, the four formulae C5–C8 displayed comparable deposition/permeation effect once applied on skin and hence, formula C8 comprising both functional additives; HA and collagen (formulated with 0.15% Chitosan, 0.1% TPP, 0.1% HA and 0.1% collagen with % drug loading in relation to the total weight of the nanoparticle of 22.7%) was selected for conducting the forthcoming physicochemical characterization. While formula C5 lacking both of functional additives (formulated with 0.15% Chitosan, 0.1% TPP, 0.0% HA and 0.0% collagen with % drug loading in relation to the total weight of the nanoparticle of 29.83%) will be additionally investigated clinically to assess the clinical effect of HA and collagen if any.
3.9. Determination of the morphology characteristics of the selected CSNPs formulation utilizing transmission electron microscope (TEM)
As represented in , formula C8 was roughly spherical with an even surface either individually or in groups. Their P.S was ≈ 300-400 nm, which was in accordance with that determined by the dynamic light scattering method.
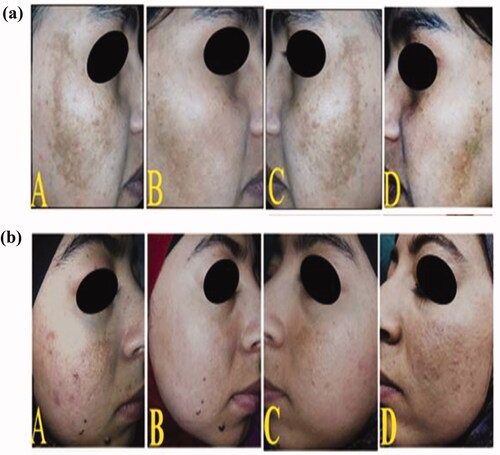
Figure 5. Two female patients with epidermal melasma: (A and C) photos for both sides of the face; right and lift, respectively before treatment showing brown spotty patches along the malar region, (B) the right side of the face after 2 months of treatment showing mild improvement in group I after topical application of C5 hydrogel (a) and good improvement in group II after topical application of C8 hydrogel (b), (D) the left side of the face after 2 months of treatment showing no improvement in both females after topical application of α-arbutin hydrogel.
3.10. Differential Scanning calorimetry (DSC) analysis
The DSC scan study of pure α-arbutin, chitosan, TPP sodium salt, HA and fish collagen was separately conducted to investigate their thermal behavior individually. Also, the study was conducted on their physical mixtures, besides the blank formulation and α-arbutin loaded nanoparticles of formula (C8). The results are illustrated in Supplementary 3.
Chitosan revealed a characteristic main endothermic peak at 84.97 °C owing to the evaporation of water (Zhang et al., Citation2008). Meanwhile, polysaccharides possess a strong water affinity, while these macromolecules exhibit a disordered configuration that can be simply hydrated in solid state (Abd-Allah et al., Citation2016). Also, the DSC thermogram of CS exhibited a broad exothermic peak at approximately 300 °C, caused by the decomposition of amine units of the chitosan (Jana et al., 2Citation015; Boudouaia et al., Citation2019). The DSC thermogram of TPP displayed an endothermic peak at 120.6 °C corresponding to water dehydration (Delan et al., Citation2020). The DSC thermogram of HA displayed a broad endothermic peak at 83.53 °C (Luo et al., Citation2000) along with an exothermic peak around 240 °C (Larrañeta et al., Citation2018). The previously published data reported the thermal resistance of HA till a temperature reaching 150 °C. The endothermic peak (83.53 °C) is due to a gradual moisture evaporation (Kafedjiiski et al., Citation2007). As stated by the previous findings of Villetti et al., Citation2002, temperatures exceeding 200 °C in nitrogen atmosphere resulted in HA degradation. Whereas, the exothermic peak was ascribed to the primary phase of beta-(1–4) glycosidic bond cleavage in the backbone of HA (Kafedjiiski et al., Citation2007). Fish collagen exhibited an endothermic peak at 89.58 °C owing to evaporation of water. Moreover, another peak occurred around 200 °C, reflecting fish collagen's melting temperature and was attributed to the denaturation of the double helix (Sripriya & Kumar, Citation2015). The thermogram of α-arbutin revealed one sharp characteristic endothermic peak at 205 °C, which is denoted to its melting point and reveals α-arbutin crystalline state (Ayumi et al., Citation2019). The melting endothermic peak of α-arbutin in the excipients' physical mixture used in the formulation of CSNPs (α-arbutin/chitosan/TPP/HA/fish collagen) showed a slight shift to 204.3 °C, implying that the drug still preserves its crystalline nature.
On investigating the drug free and α-arbutin-loaded CSNPs –C8 thermograms, it could be observed that they were comparable with complete disappearance of the peak of α-arbutin at 205 °C from the thermogram of α-arbutin loaded-CSNPs, which reveals the absence of drug crystallinity in the NPs. This finding was also confirmed by the transmission electron micrographs of formula C8 which showed the absence of crystalline material on the surface of NPs. This result may be due to the inhibition of crystallization of α-arbutin during the NPs formation. Therefore, it could be anticipated that α-arbutin exists in an amorphous or a disordered molecular dispersion in the chitosan polymer matrix after fabrication. Similar results were reported by Abd-Allah et al. (Citation2016) while entrapping lornoxicam in chitosan-TPP microspheres. Moreover, these results can also account for the relatively high EE% (83.52%) of α-arbutin into the optimized nanoparticulate systems. Likewise, the absence of the peaks of HA and collagen in blank and α-arbutin-loaded CSNPs thermograms might be attributed to their successful incorporation inside the nanoparticles. Also, the absence of chitosan and TPP peaks in both thermograms could be assigned to the cross-linking occurring between the aforementioned molecules, thus reducing the crystallinity and increasing the hydrophilicity of chitosan after cross-linking with TPP (Bhumkar & Pokharkar, Citation2006).
3.11. Fourier transform infrared (FT-IR) spectroscopy
In order to confirm the molecular drug dispersion in the polymeric matrix of the CSNPs, FT-IR spectra were determined at a frequency range of 400–4000 cm−1 to assess the main characteristic peaks associated with pure α-arbutin, chitosan, TPP, HA, fish collagen together with α-arbutin-loaded selected dispersion; (C8) and its corresponding drug free CSNPs dispersion. The FT-IR spectra are represented as Supplementary 4 (a–g).
The FT-IR spectrum of α-arbutin (Supplementary 4(a)) presented the main characteristic peaks of the hydroxyl groups at 3418.23 to 3227.21 cm−1, overlapping with C–H aromatic bonds stretching vibration. Other characteristic peaks at 2969.83 to 2895.27 cm−1 revealed the –CH aliphatic stretching vibrations (Ayumi et al., Citation2019). The spectrum also revealed the aromatic C=C stretching vibrations at 1616.88, 1607.09, 1514.62, 1456.84 and 1414.32 cm−1. Bands at 1232.01 to 1034.86 cm−1 revealed the ether bonds present in α-arbutin molecule. Moreover, the peak at 1011.73 cm−1 showed C–OH group stretching mode (Nycz et al., Citation2010). Whereas, the FT-IR of chitosan (Supplementary 4(b)) displayed a characteristic broad peak around 3441.01 cm−1, which is related to –NH2 and –OH stretching vibration modes, indicating their extra-molecular hydrogen bonding (Abd-Allah et al., Citation2016). Other characteristic peak at 2922.74 cm−1 revealed –CH aliphatic stretching vibrations. The bands at 1639.31 belonged to C=O group present in the primary amide, where that at 1554.8 cm−1 was related to –NH group bending vibration mode present in the secondary amide (Abd-Allah et al., Citation2016). The peak of the –CH3 group present in NHCOCH3 was displayed at 1384.12 cm−1 (Varun et al., Citation2017). Peaks at 1081.22 and 1031.6 cm−1 were imputed to the primary and secondary hydroxyl groups (Vaezifar et al., Citation2013).
The FT-IR spectrum of pure sodium TPP (Supplementary 4(c)) displayed main characteristic peaks at 1215.08 cm−1 (P=O stretching), 1148.28 cm−1 (PO2 groups asymmetrical and symmetric stretching vibration), 1092.69 cm−1 (PO3 groups symmetric and asymmetric stretching vibration) as well as 906.08 cm−1 (P–O–P asymmetric stretching vibration) (Martins et al., Citation2012). Additionally, the FT-IR spectrum of HA (Supplementary 4(d)) revealed a main broad band at 3420.25 cm−1, which was imputed to the phenolic hydroxyl groups overlapping with the stretching vibrations of –NH2 at the same region. Another characteristic peak at 2923.96 cm−1 was ascribed to aliphatic C–H band. Other peaks at 1621.68, 1412.61 and 1378.64 cm−1 (carboxylic salt antisymmetric and symmetric COO– stretching vibrations), 1080.43, 1043.42, and 1008.58 cm−1 (polysaccharides C–O stretching vibrations) and 910.2 cm−1 (aromatic CH groups out-of-plane bending vibrations) were recorded (Dyab et al., Citation2016). Meanwhile, the FT-IR spectrum of the fish collagen (Supplementary 4(e)) showed the presence of the three major amides; I (hydroxyproline), II (proline), and III (glycine) bands at the region of 1636–1661 cm−1, 1549–1558 cm−1 and 1200–1300 cm−1, respectively representing the proteins' integrity in the configuration of collagen molecules. Moreover, the characteristic peak at 3367.59 cm−1 was imputed to the phenolic hydroxyl groups overlapping with the stretching vibrations of -NH2 at the same region. The other characteristic peak at 2938.26 cm−1 was imputed to –CH aliphatic stretching vibrations, while the C=O peak situated at 1654.0 cm−1, 1551.9, 1450.99 and 1400.46 cm−1 could be imputed to COO– stretching vibrations of the carboxylic acid group. The protein double bands occurring at 1450.93–1400.46 cm−1 were probably accompanied with C–H bending vibration modes (Sripriya & Kumar, Citation2015). The FT-IR spectrum of plain CSNPs (Supplementary 4(f)) showed peak shift from 3367.92–3441.01 to 3454.91 cm−1, besides the peak became sharper in the CSNPs. This revealed the presence of hydrogen bonding interactions between the NH– and OH– groups of the chitosan, HA and fish collagen (Lewandowska et al., Citation2016). Another characteristic peak (C=O stretching) at 1626.68–1654.00 cm−1, which was clearly observed in chitosan, HA and fish collagen became sharper in addition to a significant shift to 1672.52 cm−1, showing that the hydrogen bonding interactions were enhanced between the ammonium, hydroxyl and C=O groups present in the aforementioned molecules. Such interactions were ascribed to the miscibility of Coll/HA and Coll/HA/Chitosan mixtures, which demonstrates the interaction between the studied molecules' functional groups via intermolecular hydrogen bonding (Lewandowska et al., Citation2016). This reflects the efficient incorporation of both functional additives during CSNPs formation. The peak recorded at 1215.08 cm−1; corresponding to P=O groups of TPP was shifted to 1232.77 cm−1 with drop in its intensity, confirming the electrostatic interaction occurring between the TPP negatively charged phosphate groups and the positively charged primary amino groups present in chitosan Moreover, the FT-IR spectra showed the peaks of –OH and C=O functional groups corresponding to the water and acetic acid employed during the preparation of blank CSNPs dispersions, overlapping with the peaks of the same functional groups present in chitosan, HA and collagen. On the other hand, the FT-IR spectrum of α-arbutin-loaded CSNPs (Supplementary 4(g)) revealed broadening/strengthening as well as increased peak intensity at 3443.08 cm−1 for O–H stretching, which could be ascribed to α-arbutin incorporation which formed a covalent bond interaction via its glucose (aglycone) moiety with the hydroxyl groups present in chitosan (Butwong et al., Citation2020). In addition, the spectrum indicated shifting and decreased intensity of the characteristic peak of TPP molecule to 1235.69 cm−1, indicating the crosslinking effect with chitosan. The FT-IR data of the selected CSNPs formulation; (C8) confirmed the encapsulation of α-arbutin within the polymeric matrix.
3.12. Clinical efficacy of α-arbutin-loaded CSNPs in treatment of melasma
According to Fitzpatrick’s Skin phototypes classification (Fitzpatrick et al., Citation1975), the recruited patients for the study were falling between types III and IV indicating their white to lightly tanned or beige skin color, deviating more toward the second type which is a common type among the Egyptian natives. Assessment of patients' response was recorded in terms of follow up photography and mMASI scoring in addition to histopathological evaluation of epidermal melanin surface area and number of epidermal active melanocytes. Patients didn't report any side effects while receiving CSNPs gel or α-arbutin hydrogels reflecting their safety which was accompanied by patient compliance.
Two formulations were tested namely; C5 formulated with: 0.15% chitosan, 0.1% TPP, 0.0% HA and 0.0% collagen and C8 formulated with: 0.15% chitosan, 0.1% TPP, 0.1% HA and 0.1% collagen both in gel forms. The recruited patients were randomly distributed among two groups; group-I, where patients were treated with C5 gel on the right side of the face and α-arbutin control gel on the left side of the face for two months and group-II, where patients were treated with C8 gel on the right side of the face and α-arbutin control gel on the left side of the face for the same period of time as presented in . Regarding the clinical assessment using mMASI scoring, with respect to the right side of the face, by grading the percent reduction of mMASI score; it was evident that the improvement in group-I was mild in 60% of the patients (6 patients) and moderate in 40% of the patients (4 patients), while in group-II, 90% of the patients (9 patients) showed moderate improvement and 10% (1 patient) showed good improvement. Moreover, upon comparing the mean percent reduction of the mMASI score in both groups, it was obvious that group-II treated with C8 hydrogel exhibited significantly higher (p < .05) reduction of mMASI scores (41.2%± 6.5) compared to group-I patients treated with C5 hydrogel (24.7%± 6.8). It is worthy to note that the left face treated with control α-arbutin hydrogel containing equivalent amount of the free drug in both groups displayed only minimal reduction of mMASI scores (not exceeding 4.3%), delineating the promising therapeutic effectiveness of both nano-formulations in treating melasma compared to their conventional dosage forms with much preference to the formula containing the two functional additives namely; HA and collagen. Representative clinical enhancement in mMASI scores is shown in .
Table 4. Comparison between groups I treated with CSNPs-C5 gel and group II treated with CSNPs-C8 gel versus α-arbutin hydrogel (as control) with regards to the percent reduction of the clinical and histopathologic parameters; mMASI scores, MPSA and MART-1-positive cells number (n = 10 patients).
For further investigation of the enhanced treatment effect of the tested formulation on melasma, a computerized morphometric program is used to calculate the average percentage of the surface area of melanin layer present in the basal layer of the epidermis in Masson-Fontana-stained biopsy sections (Anbar et al., Citation2012). As presented in , regarding the right side of the face, the two studied groups showed a significantly higher reduction (p < .05) in epidermal melanin surface area in post-treated biopsies compared to the left side of the face treated with the control α-arbutin hydrogel; outlining the effective hypopigmentation activity of the prepared nano-systems. By closer inspection of the results, it was observed that the mean percent reduction in Melanin Particle Surface Area (MPSA) in both groups () was comparable (31.3% ± 3.8 for C5 hydrogel, 37.8% ± 5.1 for C8 hydrogel) (p > .05). It is worthy to note that a maximum reduction in MPSA of 1.9% was encountered in the left side of the face treated with α-arbutin gel in both groups. This reflects the outstanding clinical efficacy of the nano-formulations in the treatment of melasma compared to their respective traditional formulations.
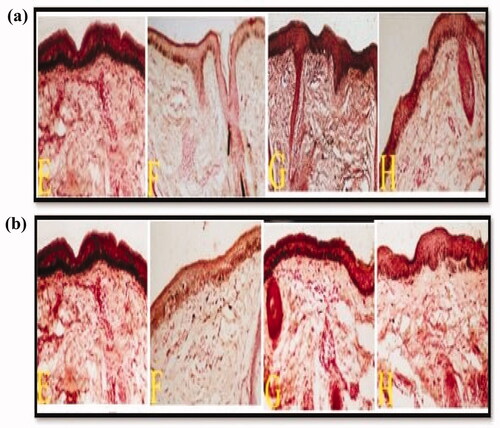
Figure 6. Two groups comprising skin biopsies from epidermal melasma lesions before and after treatment: a) Group I and b) Group II. The untreated right and left sides are denoted by E and G respectively, showing increased density of melanin in the basal layer of the epidermis. Biopsies from the right side of the face after 2 months of treatment (F) demonstrated significant decrease in epidermal MPSA in groups I and II after the application of C5 and C8 hydrogels, respectively. Biopsies from the left side of the face after 2 months of treatment (H) demonstrated insignificant decrease in epidermal MPSA in both groups after topical application of α-arbutin hydrogel (MF stain X200).
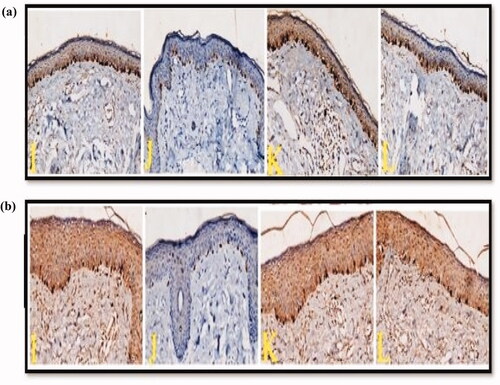
Regarding the Immunohistochemical evaluation, melanocytes were detected using MART-1 stain which is a type III membrane protein, representing the most essential melanocytic markers and is greatly found in early melanosomes (stage I and/or II melanosomes) (Quilaqueo et al., Citation2021). Concerning the right side of the face ( and ), it was clear that the applied nano-formulations promoted a significantly higher reduction (p < .05) in the number of epidermal MART-1-positive cells (melanocytes) in post-treated skin biopsies compared to the left side treated with α-arbutin hydrogel, reflecting their remarkable therapeutic activity. As previously encountered with morphometric measurement, the mean percent reduction in MART-1-positive cells was comparable in both groups (40.6%±4.5 for C5 gel and 47.5%± 18.5 for C8 gel (p > .05) (). Concerning the left side of the face, it was observed that the reduction was maximally 10.6% when treated with the control hydrogel in both groups, further revealing the better therapeutic effect of the nano-systems compared to their corresponding conventional gel formulations.
Figure 7. Two groups comprising skin biopsies from epidermal melasma lesions before and after treatment (a) Group I and (b) Group II. The untreated right and left sides are denoted by I and K respectively, showing increased number of MART-1-positive stained cells in the basal layer of the epidermis. After 2 months of treatment with the nano-formulations gels, (J) biopsies demonstrated significant decrease in the number of epidermal MART-1-positive cells in groups I and II after topical application of C5 and C8 hydrogels respectively. Biopsies from the left side of the face after 2 months of treatment with α-arbutin hydrogel (L) demonstrated insignificant decrease in the number of epidermal MART-1-positive cells in both groups (MART-1 stain X200).
As could be delineated from the results, the comparable particle size (339.00 ± 18.00 nm for C5 versus 342.50 ± 18.98 nm for C8) and percentage of epidermal deposition of 40.74% ± 7.81 for C5 versus 41.27% ± 5.00 for C8 caused them to behave similarly in terms of reduction of MPSA and MART-1 positive cells, however C8 was superior to C5 in terms of mMASI score reduction, which suggests the significant role of collagen and hyaluronic acid in reducing hyperpigmentation. It was reported that both collagen and hyaluronic acid could effectively inhibit intracellular tyrosinase activity and down-regulate melanin content through many mode of actions including; (1) their strong antioxidant and radical-scavenging activity, (2) copper chelating ability (since tyrosinase is a copper-containing enzyme) and (3) by virtue of their amino acids composition, which was reported to suppress melanin pigment formation through inhibiting tyrosinase activity competitively or by reducing its uptake from melanocytes (Lupo & Cole, Citation2007). This delineates them as potential anti-melanogenic peptides from natural resources that are suitable for use in several pharmaceutical or medicinal applications for the treatment of skin hyperpigmentation (Zhuang & Sun, Citation2012). Moreover, both additives are amphiphilic polymers, in which their hydrophilic fragments can augment drugs’ diffusivity into the epidermis through SC hydration, whereas their hydrophobic fragments can interact with SC lipids and destroy the barrier function of the skin, facilitating the penetrability of drug molecules. Similar finding was reported by Xie et al. (Citation2018), while studying ethosomes containing hyaluronic acid and collagen as efficient drug delivery systems.
Accordingly, it was obvious that the encapsulation of α-arbutin in polymer based-nanocarriers (CSNPs) allowed for maximization of its remedial potential in melasma, as could be observed from the aforementioned assessment criteria. Meanwhile, the auspicious behavior of CSNPs in treatment of melasma could be assigned to the ability of the nanoparticles to facilitate α-arbutin delivery to different skin layers, besides diffusing through skin lipids to enhance drug transportation and depot formation in the skin (Wen et al., Citation2006; Ayumi et al., Citation2019). Additionally, the nanometer size of the particles, their prolonged release potential, their cationic surface charge (which might have improved the electrostatic interaction with the negatively charged mucin layer of the skin) and their proven marked dermal deposition (when compared to the traditional gel form) have augmented the therapeutic efficacy of the drug. Furthermore, the incorporation of the functional additives (hyaluronic acid and collagen) into the nanoparticles during their formulation transfigured them into therapeutically-functionalized systems as both functional additives were previously reported to be an adjunctive modality in melasma treatment (Kwon et al., Citation2016; Jacobus Berlitz et al., Citation2019).
4. Conclusion
Chitosan nanoparticles loaded with α-arbutin and two functional additives namely; hyaluronic acid and collagen have been successfully prepared using the ionic gelation technique with successful drug encapsulation as confirmed by DSC and FT-IR analysis. Studying the effect of the formulation factors applying factorial design showed that TPP concentration exhibited significant decreasing effect on the particle size of the nanoparticles while chitosan concentration significantly decreased the entrapment efficiency of the drug. Chitosan nanoparticles were spherical in shape, positively charged showing good stability in dispersion form for 3 months and improved sustained release profile of α-arbutin over a period of 24 h specially after incorporation into hydrogels. They also showed enhanced capability to deposit the drug into deep skin layers without transdermal delivery as well as clinical superiority in the treatment of melasma over the corresponding conventional therapeutic form. Thus, emphasizing the significant role of nanoparticulate systems in overcoming several dermatological disorders associated with the other treatment modalities. A provoking point which deserves future investigation is exploiting the enhancement of skin penetration and clinical efficacy of other drugs loaded to chitosan nanoparticles for the topical treatment of melasma.
Supplemental Material
Download MS Word (298.6 KB)Acknowledgments
The authors are very grateful to the Egyptian Petroleum Research Institute for carrying out the morphological analysis using TEM as well as the DSC and FT-IR analyses. The current work did not receive fund.
Disclosure statement
No potential conflict of interest was reported by the author(s).
References
- Abd-Allah H, Abdel-Aziz RT, Nasr M. (2020). Chitosan nanoparticles making their way to clinical practice: a feasibility study on their topical use for acne treatment. Int J Biol Macromol 156:262–70.
- Abd-Allah H, Kamel AO, Sammour OA. (2016). Injectable long acting chitosan/tripolyphosphate microspheres for the intra-articular delivery of lornoxicam: optimization and in vivo evaluation. Carbohydr Polym 149:263–73.
- Abdel-Hafez SM, Hathout RM, Sammour OA. (2018). Tracking the transdermal penetration pathways of optimized curcumin-loaded chitosan nanoparticles via confocal laser scanning microscopy. Int J Biolo Macromol 108:753–64.
- Abdel-Salam FS, Mahmoud AA, Ammar HO, Elkheshen SA. (2017). Nanostructured lipid carriers as semisolid topical delivery formulations for diflucortolone valerate. J Liposome Res 27:41–55.
- Aiyalu R, Govindarjan A, Ramasamy A. (2016). Formulation and evaluation of topical herbal gel for the treatment of arthritis in animal model. Braz J Pharm Sci 52:493–507.
- Alam S, Aslam M, Khan A, et al. (2016). Nanostructured lipid carriers of pioglitazone for transdermal application: from experimental design to bioactivity detail. Drug Deliv 23:601–9.
- Ali ME, Lamprecht A. (2017). Spray freeze drying as an alternative technique for lyophilization of polymeric and lipid-based nanoparticles. Int J Pharm 516:170–7.
- Ali SM, Yosipovitch G. (2013). Skin pH: from basic science to basic skin care. Acta Derm Venereol 93:261–9.
- Al‐Rashed MM, Niknezhad S, Jana SC. (2019). Mechanism and factors influencing formation and stability of chitosan/lignosulfonate nanoparticle. Macromol Chem Phys 220:180–96.
- Anbar TS, El‐Ammawi TS, Barakat MT, et al. (2012). A new morphometric technique for assessment of melanization in skin of guinea pig. Photodermatol Photoimmunol Photomed 28:42–6.
- Anbar TS, Moftah NH, El-Khayyat MA, et al. (2015). The changes in melanocyte number and melanin density occurring in vitiligo patches during 180 days of narrow band-ultraviolet B therapy. J Egypt Women’s Dermatol Soc 12:10–8.
- Ayumi NS, Sahudin S, Hussain Z, et al. (2019). Polymeric nanoparticles for topical delivery of alpha and beta arbutin: preparation and characterization. Drug Deliv Transl Res 9:482–96.
- Bhumkar DR, Pokharkar VB. (2006). Studies on effect of pH on cross-linking of chitosan with sodium tripolyphosphate: a technical note. Aaps Pharmscitech 7:E138–E143.
- Boudouaia N, Bengharez Z, Jellali S. (2019). Preparation and characterization of chitosan extracted from shrimp shells waste and chitosan film: application for Eriochrome black T removal from aqueous solutions. App Water Sci 9:1–12.
- Bsieso EA, Nasr M, Moftah NH, et al. (2015). Could nanovesicles containing a penetration enhancer clinically improve the therapeutic outcome in skin fungal diseases? Nanomedicine 10:2017–31.
- Butwong N, Kunawong T, Luong JH. (2020). Simultaneous analysis of hydroquinone, arbutin, and ascorbyl glucoside using a nanocomposite of Ag@ AgCl nanoparticles, Ag2S nanoparticles, multiwall carbon nanotubes, and chitosan. Nanomater 10:1583–96.
- Calvo P, Remuñán-López C, Vila-Jato JL, Alonso MJ. (1997). Novel hydrophilic chitosan-polyethylene oxide nanoparticles as protein carriers. J Appl Polym Sci 63:125–32.
- Chauhan N, Dilbaghi N, Gopal M, et al. (2017). Development of chitosan nanocapsules for the controlled release of hexaconazole. Int J Biol Macromol 97:616–24.
- Chen H, Chang X, Weng T, et al. (2004). Study of microemulsion systems for transdermal delivery of triptolide. J Control Release 98:427–36.
- Chen MX, Alexander KS, Baki G. (2016). Formulation and evaluation of antibacterial creams and gels containing metal ions for topical application. J Pharm 2016:150–63.
- Chen Y, Siddalingappa B, Chan PH, Benson HA. (2008). Development of a chitosan‐based nanoparticle formulation for delivery of a hydrophilic hexapeptide. Dalargin. Pept Sci 90:663–70.
- Contri R, Fiel L, Alnasif N, et al. (2016). Skin penetration and dermal tolerability of acrylic nanocapsules: Influence of the surface charge and a chitosan gel used as vehicle. Int J Pharm 507:12–20.
- Debnath SK, Saisivam S, Debanth M, Omri A. (2018). Development and evaluation of Chitosan nanoparticles based dry powder inhalation formulations of prothionamide. PLoS One 13:e0190976–211.
- Delan WK, Zakaria M, Elsaadany B, et al. (2020). Formulation of simvastatin chitosan nanoparticles for controlled delivery in bone regeneration: optimization using Box–Behnken design, stability and in vivo study. Int J Pharm 577:119–28.
- Dyab AK, Abdallah EM, Ahmed SA, Rabee MM. (2016). Fabrication and characterisation of novel natural Lycopodium clavatum sporopollenin microcapsules loaded in-situ with nano-magnetic humic acid-metal complexes. JEAS 06:109–17.
- El-Kayal M, Nasr M, Elkheshen S, Mortada N. (2019). Colloidal (–)-epigallocatechin-3-gallate vesicular systems for prevention and treatment of skin cancer: a comprehensive experimental study with preclinical investigation. Euro J Pharm Sci 137:104–19.
- ElShazly SA, AlAkra TM, Sukar NA, Zedan AM. (2021). The genetic and histological effect of chitosan and selenium nanoparticles in eliminating the side effects of soft drink consumption. Ann Rom Socr Cell Biol 25:17044–63.
- Fitzpatrick T, Quevedo W, Jr Pathak M, Jimbow K. (1975). Role of light in human skin color variation. Am J Phys Anthropol 43:393–408.
- Gulati N, Nagaich U, Saraf SA. (2013). Intranasal delivery of chitosan nanoparticles for migraine therapy. Sci Pharm 81:843–54.
- Gupta R, Gupta GD. (2017). Formulation development and evaluation of anti-inflammatory potential of Cordia obliqua topical gel on animal mode. Pharmacogn J 9:560–74.
- Habib BA, Sayed S, Elsayed GM. (2018). Enhanced transdermal delivery of ondansetron using nanovesicular systems: fabrication, characterization, optimization and ex-vivo permeation study-Box–Cox transformation practical example. Euro J Pharm Sci 115:352–61.
- Hassan MI, Mohamed AF, Taher FA, Kamel MR. (2016). Antimicrobial activities of chitosan nanoparticles prepared from Lucilia cuprina maggots (Diptera: Calliphoridae). J Egypt Soc Parasitol 46:563–70.
- Hatem S, El Hoffy NM, Elezaby RS, et al. (2020). Background and different treatment modalities for melasma: conventional and nanotechnology-based approaches. J Drug Deliv Sci Technol 15:101–18.
- Hatem S, Nasr M, Moftah NH, et al. (2018). Clinical cosmeceutical repurposing of melatonin in androgenic alopecia using nanostructured lipid carriers prepared with antioxidant oils. Expert Opin Drug Deliv 15:927–35.
- Ibrahim ZA, Gheida SF, El Maghraby GM, Farag ZE. (2015). Evaluation of the efficacy and safety of combinations of hydroquinone, glycolic acid, and hyaluronic acid in the treatment of melasma. J Cosmet Dermatol 14:113–23.
- Jacobus Berlitz S, De Villa D, Inacio LAM, et al. (2019). Azelaic acid-loaded nanoemulsion with hyaluronic acid–a new strategy to treat hyperpigmentary skin disorders. Drug Dev Ind Pharm 45:642–50.
- Jana S, Trivedi MK, Tallapragada RM, et al. (2015). Characterization of physicochemical and thermal properties of chitosan and sodium alginate after biofield treatment. Pharm Anal Acta 6:512–23.
- Kafedjiiski K, Jetti RK, Föger F, et al. (2007). Synthesis and in vitro evaluation of thiolated hyaluronic acid for mucoadhesive drug delivery. Int J Pharm 343:48–58.
- Karimi M, Avci P, Ahi M, et al. (2013). Evaluation of chitosan-tripolyphosphate nanoparticles as a p-shRNA delivery vector: formulation, optimization and cellular uptake study. J Nanopharm Drug Deliv 1:266–78.
- Khalil RM, El-Bary AA, Kassem MA, et al. (2013). Influence of formulation parameters on the physicochemical properties of meloxicam-loaded solid lipid nanoparticles. Egypt Pharm J 12:63–77.
- Khunger N, Sarkar R, Jain R. (2004). Tretinoin peels versus glycolic acid peels in the treatment of melasma in dark‐skinned patients. Dermatol Surg 30:756–60.
- Kim H, Jung S, Yeo S, et al. (2019). Characteristics of skin deposition of itraconazole solubilized in cream formulation. Pharmaceutics 11:195–216.
- Kwon SH, Hwang YJ, Lee SK, Park KC. (2016). Heterogeneous pathology of melasma and its clinical implication. IJMS 17:824–33.
- Larrañeta E, Henry M, Irwin NJ, et al. (2018). Synthesis and characterization of hyaluronic acid hydrogels crosslinked using a solvent-free process for potential biomedical applications. Carbohydr Polym 181:1194–205.
- Lewandowska K, Sionkowska A, Grabska S, et al. (2016). The miscibility of collagen/hyaluronic acid/chitosan blends investigated in dilute solutions and solids. J Mol Liq 220:726–30.
- Loganathan V, Manimaran S, Jaswanth A, et al. (2001). The effects of polymers and permeation enhancers on releases of flurbiprofen from gel formulations. Indian J Pharm Sci 63:200–16.
- Luo Y, Kirker KR, Prestwich GD. (2000). Cross-linked hyaluronic acid hydrogel films: new biomaterials for drug delivery. J Control Release 69:169–84.
- Lupo MP, Cole AL. (2007). Cosmeceutical peptides. Dermatol Ther 20:343–9.
- Lusiana RA, Putri Protoningtyas W, Ricky Wijaya A, et al. (2017). Chitosan-tripoly phosphate (CS-TPP) synthesis through cross-linking process: the effect of concentration towards membrane mechanical characteristic and urea permeation. Orient J Chem 33:2913–9.
- Machado-Pinto J, de Fatima Melo Borges M, Magalhaes G. (2006). A review of melasma, part 1: etiopathogenic factors, clinical and histopathologic evaluations. Cosmet Dermatol-Cedar Knolls 19:683–7.
- Martins AF, de Oliveira DM, Pereira AG, et al. (2012). Chitosan/TPP microparticles obtained by microemulsion method applied in controlled release of heparin. Int J Biol Macromol 51:1127–33.
- Masarudin MJ, Cutts SM, Evison BJ, et al. (2015). Factors determining the stability, size distribution, and cellular accumulation of small, monodisperse chitosan nanoparticles as candidate vectors for anticancer drug delivery: application to the passive encapsulation of [14C]-doxorubicin. Nanotechnol Sci Appl 8:67–78.
- Mashru R, Sutariya V, Sankalia M, Parikh P. (2005). Development and evaluation of fast-dissolving film of salbutamol sulphate. Drug Dev Ind Pharm 31:25–34.
- Nair RS, Morris A, Billa N, Leong C-O. (2019). An evaluation of curcumin-encapsulated chitosan nanoparticles for transdermal delivery. Aaps Pharmscitech 20:1–13.
- Nasr M, Awad GA, Mansour S, et al. (2011). A reliable predictive factorial model for entrapment optimization of a sodium bisphosphonate into biodegradable microspheres. J Pharm Sci 100:612–21.
- Nasti A, Zaki NM, de Leonardis P, et al. (2009). Chitosan/TPP and chitosan/TPP-hyaluronic acid nanoparticles: systematic optimisation of the preparative process and preliminary biological evaluation. Pharm Res 26:1918–30.
- Neagu N, Conforti C, Agozzino M, et al. (2021). Melasma treatment: a systematic review. J Dermatol Treat 15:1–39.
- Nycz JE, Malecki G, Morag M, et al. (2010). Arbutin: Isolation, X-ray structure and computional studies. J Mol Struct 980:13–7.
- Omar Zaki SS, Ibrahim MN, Katas H. (2015). Particle size affects concentration-dependent cytotoxicity of chitosan nanoparticles towards mouse hematopoietic stem cells. J Nanotechnol 2015:1–245.
- Omwoyo WN, Moloto MJ. (2019). Encapsulation of ibuprofen into solid lipid nanoparticles for controlled and sustained release using emulsification solvent evaporation technique. Catalysts 45:106–15.
- Özcan I, Azizoğlu E, Senyiğit T, et al. (2013). Enhanced dermal delivery of diflucortolone valerate using lecithin/chitosan nanoparticles: in-vitro and in-vivo evaluations. Int J Nanomedicine 8:461–72.
- Pande V, Patel S, Patil V, Sonawane R. (2014). Design expert assisted formulation of topical bioadhesive gel of sertaconazole nitrate. Adv Pharma Bull 4:121–32.
- Pandya A, Berneburg M, Ortonne JP, Picardo M. (2006). Guidelines for clinical trials in melasma. Bri J Dermatol 156:21–8.
- Parente M, Ochoa Andrade A, Ares G, et al. (2015). Bioadhesive hydrogels for cosmetic applications. Int J Cosmet Sci 37:511–8.
- Pervaiz F, Saleem M, Ashames A, et al. (2020). Development and ex-vivo skin permeation studies of finasteride–poly (lactic acid-co-glycolic acid) and minoxidil–chitosan nanoparticulate systems. J Bioact Compat Polym 35:77–91.
- Prabha N, Mahajan VK, Mehta KS, et al. (2014). Cosmetic contact sensitivity in patients with melasma: results of a pilot study. Dermatol Res Practice 2014:1–98.
- Prignano F, Ortonne JP, Buggiani G, Lotti T. (2007). Therapeutical approaches in melasma. Dermatol Clin 25:337–42.
- Quilaqueo N, Navarrete F, Sandoval C, et al. (2021). Marcadores Inmunohistoquímicos en el Diagnóstico Diferencial de Melanoma y Nevos en Humanos. Int J Morphol 39:1509–15.
- Rahat I, Imam SS, Md R, et al. (2021). Thymoquinone-entrapped chitosan-modified nanoparticles: formulation optimization to preclinical bioavailability assessments. Drug Deliv 28:973–84.
- Ramesh Y, Sireesha V. (2017). Transdermal patch of ramipril loaded chitosan nanoparticles dispersed in carbopol gel. J Drug DelivTher 7:56–65.
- Safdar R, Omar AA, Arunagiri A, et al. (2019). Potential of chitosan and its derivatives for controlled drug release applications–a review. J Drug Deliv Scie Technol 49:642–59.
- Saleh F, Moftah NH, Abdel ‐Azim E, et al. (2018). Nd: YAG laser alone or with modified Jessner chemical peeling for treatment of mixed melasma in dark skin types: a comparative clinical, histopathological, and immunohistochemical study. J Cosmet Dermatol 17:319–27.
- Samy AM, Ghorab MM, Shadeed SG, Mazyed EA. (2013). Formulation and evaluation of different transdermal drug delivery systems of ketoprfen. Int J Pharm Pharm Sci 5:452–63.
- Shankar K, Godse K, Aurangabadkar S, et al. (2014). Evidence-based treatment for melasma: expert opinion and a review. Dermatol Ther 4:165–86.
- Sobhi RM, Sobhi AM. (2012). A single‐blinded comparative study between the use of glycolic acid 70% peel and the use of topical nanosome vitamin C iontophoresis in the treatment of melasma. J Cosmet Dermatol 11:65–71.
- Sripriya R, Kumar R. (2015). A novel enzymatic method for preparation and characterization of collagen film from swim bladder of fish Rohu (Labeo rohita). Food Nutr Sci 6:1468–79.
- Sugimoto K, Nishimura T, Nomura K, et al. (2004). Inhibitory effects of α-arbutin on melanin synthesis in cultured human melanoma cells and a three-dimensional human skin model. Biol Pharma Bull 27:510–4.
- Teja S, Damodharan N. (2018). 23 full factorial model for particle size optimization of methotrexate loaded chitosan nanocarriers: A design of experiments (DoE) approach. BioMed Res Int 2018:1–317.
- Trommer H, Wartewig S, Böttcher R, et al. (2003). The effects of hyaluronan and its fragments on lipid models exposed to UV irradiation. Int J Pharm 254:223–34.
- Vaezifar S, Razavi S, Golozar MA, et al. (2013). Effects of some parameters on particle size distribution of chitosan nanoparticles prepared by ionic gelation method. J Clust Sci 24:891–903.
- Varun TK, Senani S, Jayapal N, et al. (2017). Extraction of chitosan and its oligomers from shrimp shell waste, their characterization and antimicrobial effect. Vet World 10:170–82.
- Villetti M, Crespo J, Soldi M, et al. (2002). Thermal degradation of natural polymers. J Therm Anal Calorim 67:295–303.
- Wan A. j, Sun Y, Li W. t, Li H. (2008). Transmission electron microscopy and electron diffraction study of BSA-loaded quaternized chitosan nanoparticle. J Biomed Mater Res Part B: Appl Biomat 86:197–207.
- Wang Y-W, Jou C-H, Hung C-C, Yang M-C. (2012). Cellular fusion and whitening effect of a chitosan derivative coated liposome. Colloids Surf B Biointerfaces 90:169–76.
- Wani TU, Raza SN, Khan NA. (2019). Rosmarinic acid loaded chitosan nanoparticles for wound healing in rats. Ijpsr 10:1138–47.
- Wattanakrai P, Mornchan R, Eimpunth S. (2010). Low‐fluence Q‐switched neodymium‐doped yttrium aluminum garnet (1,064 nm) laser for the treatment of facial melasma in Asian. Dermatol Surg 36:76–87.
- Wen AH, Choi MK, Kim DD. (2006). Formulation of liposome for topical delivery of arbutin. Arch Pharm Res 29:1187–92.
- Xie J, Ji Y, Xue W, et al. (2018). Hyaluronic acid-containing ethosomes as a potential carrier for transdermal drug delivery. Colloids Surf B Biointerfaces 172:323–9.
- Yang C, Fan W, Zhang R, et al. (2018). Study on transglucosylation properties of amylosucrase from Xanthomonas campestris pv. Campestris and its application in the production of α-arbutin. Catalysts 9:5–16.
- Zhang Y, Yang Y, Tang K, et al. (2008). Physicochemical characterization and antioxidant activity of quercetin-loaded chitosan nanoparticles. J Appl Polym Sci 107:891–7.
- Zhu W, Gao J. (2008). The use of botanical extracts as topical skin-lightening agents for the improvement of skin pigmentation disorders. J Investig Dermatol Symp Proc 16:2041–56.
- Zhuang YL, Sun LP. (2012). Anti-melanogenic activities of collagen peptides from jellyfish (Stomolophus meleagris). Adv Mater Res 2012:1089–99.