
 ?Mathematical formulae have been encoded as MathML and are displayed in this HTML version using MathJax in order to improve their display. Uncheck the box to turn MathJax off. This feature requires Javascript. Click on a formula to zoom.
Abstract
Gold nanoparticles are a promising drug delivery system for treatment of inflammatory skin conditions, including psoriasis, due to their small size and anti-inflammatory properties. The aim of this study was to conjugate gold nanoparticles with anti-psoriatic formulations that previously showed successful results in the treatment of psoriasis (tacrolimus-loaded chitosan nanoparticles and lecithin–chitosan nanoparticles) by virtue of their surface charges, then examine whether the hybridization with gold nanoparticles would enhance the anti-psoriatic efficacy in vivo. Successful formation of gold nanoparticles was examined by elemental mapping and selected area electron diffraction (SAED). Hybrid conjugates were examined in terms of particle size and zeta potential by dynamic light scattering (DLS). Morphological features were captured by transmission electron microscope (TEM) and X-ray diffraction (XRD) analysis was conducted, as well. All characterization was conducted for the conjugated nanoparticles and compared with their bare counterparts. The in vivo results on imiquimod (IMQ)-induced mouse model showed promising anti-psoriatic effects upon application of gold conjugated tacrolimus-loaded lecithin–chitosan hybrid nanoparticles with a significant difference from the bare hybrid nanoparticles in some of the inflammatory markers. The anti-inflammatory effect of the gold conjugate was also evident by a lower spleen to body weight ratio and a better histopathological skin condition compared to other tested formulations.
1. Introduction
Owing to their various advantageous properties, gold nanoparticles have been a rich research material for scientists in the field of drug delivery over the few past years. In fact, they were proven to be very good candidates for dermal drug delivery. In addition to their small size, optical properties, and ease of surface functionalization, they also possess anti-inflammatory properties (Uchiyama et al., Citation2014; Arafa et al., Citation2018), without exhibiting cytotoxic effects especially when prepared by green methods and tailored in terms of size and concentration (Bessar et al., Citation2016; Perde-Schrepler et al., Citation2016; Nemati et al., Citation2017; Crisan et al., Citation2018). All of which are attributes that make gold nanoparticles beneficial for the treatment of inflammatory skin diseases like psoriasis, a chronic autoimmune-mediated inflammatory condition with genetic predisposition.
Gold nanoparticles have been studied for the purpose of dermal/transdermal drug delivery (Pissuwan et al., Citation2011; Hsiao et al., Citation2016; Chen et al., Citation2017; Gupta et al., Citation2017; Moothanchery et al., Citation2017). Due to their small size, they are able to pass the skin barrier via the trans-appendageal route, unlike topical deposition of gold nanoparticles which takes place by endocytosis (Hsiao et al., Citation2016; Friedman et al., Citation2021). Surface modification by either polymer functionalization, addition of penetration enhancers or conjugation to liposomes, were among the techniques used to facilitate skin penetration of gold nanoparticles (Nativo et al., Citation2008). Gupta & Rai studied the effect of size, surface charge, and surface modification of gold nanoparticles on skin penetration on the molecular level (Gupta & Rai, Citation2017) and showed that neutral smaller particles had a higher tendency to penetrate the skin, in contrast to larger charged particles, which were more prone to skin retention by endocytosis.
However, one of the controversies of using gold nanoparticles is fear of a possible cytotoxic effect, which has been stated to be size and concentration dependent. Chemically synthesized gold nanoparticles have been reported to exert toxic effects upon application at doses higher than 20 µg/mL (Perde-Schrepler et al., Citation2016; Crisan et al., Citation2018), whereas, small sized gold nanoparticles synthesized using citrate at a concentration of 1 × 10² particles/mL were not cytotoxic, neither in terms of cell membrane alteration nor cell apoptosis/necrosis (Uchiyama et al., Citation2014). Another study performed cell viability tests on different concentrations of gold nanoparticles and verified no signs of cytotoxicity for concentrations up to 20 µM (Amaral et al., Citation2021).
Nanoparticles have superior anti-inflammatory effects, compared to bulk anti-inflammatory formulations, because of their small sizes which grant the particles a high surface area. Hence, upon application they cause aggregation of natural blood proteins; IgG and IgM, which hinders the inflammatory response of the body by inhibition of leukocyte endothelial interactions (Uchiyama et al., Citation2014). Gold nanoparticles specifically are reported to inhibit the production of pro-inflammatory cytokines; IL-1β, IL-17, and TNF-α (Agarwal et al., Citation2019), all of which are stated as mediators involved in psoriasis pathogenesis (Grine et al., Citation2015). Larger sized gold nanoparticles have been reported to be less efficient in the total adsorption of inflammatory body proteins (Gunawan et al., Citation2014), whereas, higher concentrations were reported to enhance phagocytosis of the nanoparticles, particularly by M2 phagocytes, which in turn reduced the oxidative stress and suppressed the production of pro-inflammatory cytokines (Uchiyama et al., Citation2014), hence, making gold nanoparticles promising candidates for the topical treatment of psoriasis (Crisan et al., Citation2013; Uchiyama et al., Citation2014; Agarwal et al., Citation2019). However, plain gold nanoparticles, prepared devoid of an anti-psoriatic agent or herbal extract, were reported to be ineffective in improving the skin condition of imiquimod (IMQ)-induced mouse models, in terms of epidermal skin thickness and EGFR expression (Nemati et al., Citation2017).
Tacrolimus is a macrolide that has immune-suppressant properties, hence, exerts an anti-proliferative action on skin when applied topically or administered systemically (Xu et al., Citation2016). Its mechanism of action involves the inhibition of pro-inflammatory mediators responsible for the pathogenesis of psoriasis such as; IL-2, NO synthase, calcineurin phosphatase, and cytokines (Bennett et al., Citation2016; Dheer et al., Citation2018). Oral administration of tacrolimus was proven efficient in management of severe psoriasis and was more adequate than cyclosporin due to the associated risks of cardiovascular disease upon administration of the latter (Malecic & Young, Citation2016). However, systemic administration of tacrolimus could lead to various side effects; nephrotoxicity, hypertension, hypertrichosis, and gingival hyperplasia being the most common (Mihatsch et al., Citation1998). Topical therapy using tacrolimus ointment was reported to be ineffective in the treatment of chronic plaque psoriasis (Zonneveld et al., Citation1998), and proved to be efficient only in inverse psoriasis on the armpits, in the groin and around the genitals (Micali et al., Citation2019). This is probably due to the absence of the thick silvery scales in this type of psoriasis which makes skin penetration easier (Malecic & Young, Citation2016). Both aforementioned studies used tacrolimus in the form of bulk ointment without utilizing nanotechnology approaches. Hence, it sounds promising to create a delivery system that could penetrate the silvery scales that appear in chronic plaque psoriasis and allow drug retention in the upper skin layers, the site of action in psoriasis, thus, benefit from its immune-suppressing properties with minimal systemic absorption to avoid side effects by means of using a nanotechnology-based approach.
Tacrolimus-loaded chitosan nanoparticles, prepared in our laboratory by a modified ionic gelation technique, were proven superior to the marketed product (Tacrolimus® ointment), in terms of anti-psoriatic efficacy, upon application on IMQ-induced mouse model (Fereig et al., Citation2021a). Both in vivo and ex vivo skin deposition tests showed higher skin deposition and lower skin permeation of tacrolimus upon application of the nanoparticles compared to the marketed product. This is probably referred to the nature of polymeric nanoparticles which were proven more prone to skin deposition rather than permeation, with a higher affinity to the inflamed skin, particularly in the upper skin layers (stratum corneum and epidermis), which are the target site of action in psoriasis (Abdel-Mottaleb et al., Citation2011; Abdel-Mottaleb & Lamprecht, Citation2016; Pischon et al., Citation2017).
Lecithin–chitosan hybrid nanoparticles were also proven efficient in improving skin deposition rather than skin permeation due to the presence of positively charged chitosan as a nanoparticle coat (Sonvico et al., Citation2006; Senyiğit et al., Citation2010). Tacrolimus-loaded lecithin–chitosan nanoparticles were also prepared in our laboratory (Fereig et al., Citation2021b) and showed successful healing of psoriatic plaques upon application on IMQ-induced mouse model. The results were superior to the marketed product (Tacrolimus® ointment) and tacrolimus-loaded chitosan nanoparticles, in terms of visual observation of the skin condition and scoring by psoriasis area severity index score (PASI), examination of the skin picture microscopically and histopathological evaluation of psoriatic picture and in vivo and ex vivo skin retention of tacrolimus.
Therefore, the objective of our study is to hybridize gold nanoparticles with two types of tacrolimus-loaded formulations, namely; chitosan nanoparticles (Fereig et al., Citation2021a) and lecithin–chitosan hybrid nanoparticles (Fereig et al., Citation2021b) formerly fabricated and optimized in our laboratory. Our aim is to make use of the anti-inflammatory properties of gold nanoparticles, in an attempt, to boost the antipsoriatic effects of tacrolimus-loaded formulations. Our rationale is based on ionic interaction between negatively charged gold nanoparticles and our positive polymeric/hybrid lipid–polymer nanoparticles. Binding these particles is expected to form a surface charged system with a low concentration of gold and relatively large size to achieve topical skin deposition.
Thus, in the current manuscript, gold nanoparticles were first chemically synthesized and their successful formation was confirmed by transmission electron microscopy (TEM), X-ray diffraction (XRD), and selected area electron diffraction (SAED). This was followed by their separate hybridization with chitosan nanoparticles and hybrid lecithin–chitosan nanoparticles loaded with tacrolimus. The hybridized systems were physically characterized and compared to plain gold nanoparticles. Furthermore, the efficacy of all systems was tested in vivo on IMQ-induced animal model and in vivo skin retention of the drug was determined.
2. Materials and methods
2.1. Materials
Tacrolimus USP (Biocon, Bengaluru, India) was a kind gift from Al-Andalous® (Al-Andalous, Cairo, Egypt). Chitosan (molecular weight 100,000 Da) and Tween 80 were obtained from Acros Organics (Morris Plains, NJ). Propylene glycol (Mwt: 76.10) was procured from Alpha Chemika (exporters india.com; Mumbai, India). Lecithin (soybean phosphatidylcholine, Epikuron® 200) was a generous gift from Cargill Texturizing Solutions, Deutsch Land, GmbH and Co. (Hamburg, Germany). Acetic acid was obtained from ADWIC (El-Nasr, Cairo, Egypt). HPLC grade acetonitrile and ethanol were procured from Fisher Scientific (Princeton, NJ). Pentasodium tripolyphosphate anhydrous (TPP), tetrachloroauric (III) acid trihydrate, and sodium citrate were bought from Sigma-Aldrich® Pharmaceuticals, Sigma-Aldrich Chemie GmbH (Taufkirchen, Germany). Uranyl acetate was purchased from Allied Signal (Hamburg, Germany).
2.2. Methods
2.2.1. Preparation of plain gold nanoparticles
Gold nanoparticles (G0) were prepared by the method previously described by Turkevich et al. (Citation1951). Briefly, 95 mL of tetrachloroauric acid (HAuCl4) solution (containing 5.263% Au) was heated to its boiling point. Then, 5 mL of 1% sodium citrate solution (reducing agent) were added under vigorous mechanical stirring using a digital plate magnetic stirrer (DAIHAN Scientific, Wonju, South Korea) until a wine-red colloidal suspension was obtained, indicating the formation of gold nanoparticles. The final concentration of the collected nanoparticles was 196 µg/mL (∼1 mM Au+3).
2.2.2. Preparation of tacrolimus-loaded chitosan nanoparticles
As described in our previously published work (Fereig et al., Citation2021a), chitosan nanoparticles loaded with tacrolimus (C) were prepared by means of a modified ionic gelation method that was described by Calvo et al. (Citation1997). Briefly, 3 mg of tacrolimus were solubilized in 3 mL of propylene glycol under magnetic stirring, rpm 500, at 60 °C. The solution was then added to 2 mL of an aqueous tripolyphosphate pentasodium solution (0.05% w/v). The mixture was injected dropwise into a 0.1% w/v chitosan solution under vigorous magnetic stirring at 1100 rpm at room temperature. The colloidal suspension (containing 0.03% w/v of tacrolimus) was left stirring for 30 minutes and then collected.
2.2.3. Preparation of tacrolimus-loaded lecithin–chitosan hybrid nanoparticles
Lecithin–chitosan nanoparticles incorporating tacrolimus (L) were prepared via the ethanolic injection method as described in our previously published work (Fereig et al., Citation2021b). Briefly, 7.5 mg of tacrolimus were solubilized in an ethanolic solution containing lecithin and Tween 80. The mixture was then injected into a 0.5% w/v chitosan solution under vigorous magnetic stirring, rpm 1100. The final formulation had a lecithin:chitosan ratio of 10:1 v/v, 1.6% w/v Tween 80, and 0.03% w/v of tacrolimus.
2.2.4. Hybridization of gold nanoparticles with tacrolimus-loaded chitosan and lecithin–chitosan hybrid nanoparticles
Gold nanoparticles (G0) were separately mixed with chitosan nanoparticles (C) and lecithin–chitosan hybrid nanoparticles (L) by simple physical mixing in equal amounts to achieve a 1:1 ratio, for further investigation. The obtained hybridized formulations were denoted as G1 and G2, respectively.
The compositions of different formulations (bare and hybridized) are demonstrated in .
Table 1. Different compositions, particle sizes, PDI, and surface charges of the synthesized tacrolimus-loaded bare and hybridized formulations.
2.2.5. Characterization of the nanoparticles
2.2.5.1. Particle size (PS), polydispersity index (PDI) analysis, and zeta potential (ZP)
Particle size and PDI of gold nanoparticles and hybridized formulations were determined by (Malvern® zeta sizer (version 7.2), Worcestershire, UK) with a suitable dilution of the sample by de-ionized water to obtain a count range between 150 and 200 (El-Zaafarany et al., Citation2016). The ZP was measured by electrophoretic light scattering using the aforementioned apparatus (Arafa & Ayoub, Citation2017).
2.2.5.2. Morphological examination
2.2.5.2.1. Elemental mapping of gold nanoparticles
Selected area electron diffraction was determined as a parameter that confirms the formation of gold nanoparticles using elemental mapping technique. A drop of gold-nanoparticle suspension was placed on a copper grid, coated with carbon, and kept at 25 °C to dry, then examined using field emission-transmission electron microscope (FE-TEM) apparatus to determine SAED.
2.2.5.2.2. Microscopic examination of nanoparticles
Microscopical examination by JEOL JEM-1010 Transmission Electron Microscope Device (Tokyo, Japan) was used to visualize the morphological features of sole gold nanoparticles (G0), as well as the hybridized tacrolimus-loaded nanoparticles (G1 and G2) in colloidal forms. A drop of 1% uranyl acetate was then added and left to air dry. The grid was then examined using TEM (Hussein et al., Citation2020).
2.2.5.3. X-ray diffraction analysis
Gold-hybridized nanoparticles were lyophilized using, Christ® Alpha 1-2 LD Plus lyophilizer (Osterode am Harz, Germany), as a mandatory preliminary step for further testing by powdered XRD analysis. Aliquots of the hybridized formulations were frozen at −18 °C prior to freeze drying and the lyophilizer temperature was adjusted at −40 °C for 24 hours using a pressure of 1.3 × 10⁵ atmp (Katas et al., Citation2013).
The crystalline structures of the prepared hybridized nanoparticles and bare gold nanoparticles were determined to ensure successful conjugation. XRD analysis was executed using (Empyrean multi-purpose X-ray diffractometer XRD apparatus, Malvern®, Worcestershire, UK). The XRD pattern of sole gold nanoparticles was determined by placing a drop of the suspension on a glass slide which was then left to air dry at room temperature (Arafa et al., Citation2018). The gold-hybridized nanoparticle system was used as a lyophilized powder. The sample was subjected to a monochromated X-ray beam, generated by a Cu anode and an X-ray power of 40 kV, 30 mA. The scan step time was five seconds, and the scan was conducted at 2θ = 4° to 80°, continually (Li et al., Citation2008).
2.2.6. In vivo testing of the anti-psoriatic effect on imiquimod-induced animal model
2.2.6.1. Induction of psoriasis by IMQ
All animal experiments were carried out in accordance with the recommendations in the Guide for the Care and Use of Laboratory Animals (Institute of Laboratory Animal Resources, National Research Council, National Academy of Sciences, Washington, DC). The protocol of the in vivo study was approved by the research ethics committee at Ain shams university (approval no.: 185). C57BL/6 mice were used as an animal model for our experiment. This species was specifically chosen based on literature reviewing which stated that it mimics human psoriasis better than other species (Swindell et al., Citation2017). All animals were kept under regular conditions at 25–28 °C. For psoriasis induction (in all groups except the negative control), Aldara® cream (IMQ 5%) was applied once every 24 hours from day 1 to day 3 of the study at a dose of 83.3 mg/mouse/day. The application area was 4 cm2 on the dorsal skin, which was shaved on day 0 by an electric shaver (Jain et al., Citation2016).
2.2.6.2. Treatment of psoriasis
Different treatment groups received different treatment formulae, as a single daily dose applied topically on the shaved area of the skin for three consecutive days (days 4–6 of the study). All treatment groups received equal doses of tacrolimus. The groups to which the hybridized formulations were administered received the same dose of gold nanoparticles (Jain et al., Citation2016). The study was conducted on a total of seven groups as follows:
Negative control: Psoriasis was not induced and no treatment was received;
Positive control: Psoriasis was induced but no treatment was received;
Group A: Psoriasis was induced and three doses of the marketed product (Tacrolimus® ointment) were received as treatment;
Group B: Psoriasis was induced and three doses of C (tacrolimus-loaded chitosan nanoparticles) were received as treatment;
Group C: Psoriasis was induced and three doses of L (tacrolimus-loaded lecithin–chitosan nanoparticles) were received as treatment;
Group D: Psoriasis was induced and three doses of G1 (tacrolimus-loaded chitosan nanoparticles hybridized with gold) were received as treatment;
Group E: Psoriasis was induced and three doses of G2 (tacrolimus-loaded lecithin–chitosan nanoparticles hybridized with gold) were received as treatment.
2.2.6.3. Evaluation of the anti-psoriatic effect
Animals were assessed using PASI score on days 0, 2, 4, and 6 of the study. The score ranged from 0 to 4, 0 = none, 1 = slight, 2 = moderate, and 4 = marked. The evaluated parameters were skin thickness, erythema, and scaling. The scores of each parameter for each mouse were summed-up to be calculated as a total PASI score, out of 12 (Mao et al., Citation2017).
The in vivo skin deposition was determined by collection of skin samples at the end of the study and extracting the drug by dipping it in 10 mL methanol after washing the skin samples in normal saline solution. The samples were placed on a magnetic stirrer for 30 minutes (Abdelbary & AbouGhaly, Citation2015). A filtrate of the methanol solution was injected in UPLC (Thermo Scientific® Ultimate 3000 Ultra Performance Liquid Chromatography, Waltham, MA) to quantify the amount of deposited drug using peak areas. Chromatographic conditions for drug determination were, C18 column (Thermo Scientific, Waltham, MA, 2.2 Um 120 Å 2.1 × 100 mm) used at 60 °C, mobile phases: 100% acetonitrile, flow rate: 0.6 mL/min, and retention time: 0.57 min (Akashi et al., Citation1996; Patel et al., Citation2011; Pecchio et al., Citation2014; Arafa & Ayoub, Citation2018).
The spleen to body weight ratio was determined by weighing each animal at the end of the study and weighing the spleen after animal sacrifice in order to assess the inflammatory condition (Sun et al., Citation2018).
Histopathological examination of autopsy skin samples was conducted for all treatment groups. Samples were placed in 10% formol-saline solution for one day. The skin was further washed in distilled water and serial dilutions of ethanol and methanol. Pure ethanol was used for skin dehydration. Samples were treated with xylene, then, placed in paraffin and dried using oven (at 56 °C) for one day. Four micrometers thick paraffin sections were obtained by a slide microtome. Tissue sections were positioned on glass slides. Deparaffinization took place, followed by staining using hematoxylin and eosin. The samples were examined afterwards using Zeiss light microscope (Jena, Germany).
2.2.6.4. Microscopic examination of skin samples by scanning-transmission electron microscope
The collected skin samples from groups D and E and the negative control were fixed in 2% glutaraldehyde, 4% formaldehyde solution for four hours and washed in phosphate-buffered saline (pH = 7.4) three times, 10 minutes each. Afterwards, they were fixed in 1% osmium tetraoxide for two hours, washed again in phosphate-buffered saline (pH = 7.4) three times, 10 minutes each. Subsequently, the samples were dehydrated in an ascending series of ethanol, each step for 10 minutes. The subsequent infiltration of samples took place using a mixture of acetone and absolute ethanol (1:1) for 30 minutes. Skin samples were later immersed in absolute acetone for 30 minutes and embedded in resin epon 812 in a 60 °C oven for 16 hours (Barmettler & Ziegler, Citation2019).
RMC Boeckeler ultramicrotome section cutter (Butterfield, Tucson, AZ) was used to cut the processed skin samples into 80 nm thick sections. Furthermore, the samples were mounted on Cu grids, mesh 200 and stained by uranylacetate and lead citrate. The obtained sections were examined using field emission scanning electron microscope, with a STEM detector for the purpose of locating gold nanoparticles in skin layers and imaging the findings (Silva et al., Citation2012; Goldstein et al., Citation2014; Graf et al., Citation2015).
2.2.7. Statistical analysis
All results were repeated three times and reported as mean ± standard deviation. Statistical analysis was conducted using GraphPad prism software (version 6.01, San Diego, CA). ANOVA test was used for multiple comparisons followed by Tukey–Kramer’s test for post hoc analysis while paired t-test was used for dual comparisons (Arafa et al., Citation2020). All p values less than .05 were considered significant.
3. Results and discussion
3.1. Elemental mapping of gold nanoparticles
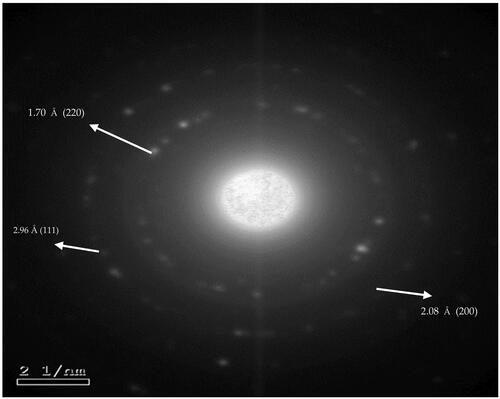
Elemental mapping is an imaging technique that shows the spatial distribution of elements in a sample, especially compositional zonation. To confirm the successful formation of bare gold nanoparticles (G0), SAED was determined. As shown in , gold nanoparticles exhibited a poly-crystalline nature, evident by the appearance of bright spots on the same plane in SAED (Fultz & Howe, Citation2001). According to elemental mapping calculations, the radii of the formed rings in SAED image were measured. The values were found to be: 6.74, 9.58, and 11.75 nm−1. The reciprocals of the radii were determined as 2.58, 2.07, and 1.70 Å. These values were found to be approximate to the wavelengths determined at the high intensity peaks at 2ϴ in the XRD pattern of gold nanoparticles of formula G0 at hkl 1 1 1, 2 0 0, and 2 2 0 face centers of the cubic lattice (). Hence, indicating the crystalline phases of gold nanoparticles (supplementary table). These results are consistent with reported findings of characterization of gold nanoparticles (Babu et al., Citation2012; Goswami & Ghosh, Citation2013; Arafa et al., Citation2018; Xie et al., Citation2019).
Figure 1. Selected area electron diffraction pattern of gold nanoparticles.
3.2. Hybridization of the nanoparticles
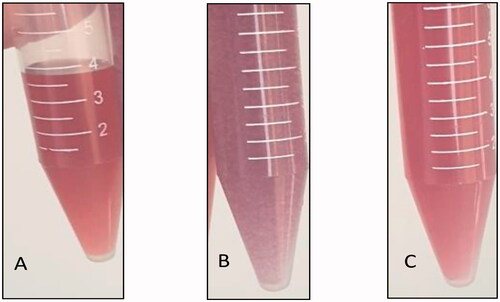
Bare-gold nanoparticles (G0) were collected after synthesis and visually inspected to determine their color. An aliquot of (G0) was mixed with an aliquot of tacrolimus-loaded chitosan nanoparticles (C) with a 1:1 ratio to form (G1). Another aliquot of (G0) was mixed with an aliquot of tacrolimus-loaded lecithin–chitosan nanoparticles (L) to form (G2). G1 and G2 were visually inspected for color, as well. As shown in , bare gold nanoparticles (G0) had a wine-red color (), denoting a PS <50 nm (Singh et al., Citation2018). On mixing with tacrolimus-loaded chitosan nanoparticles (G1), the color turned purple (), while, on mixing with tacrolimus-loaded lecithin–chitosan nanoparticles (G2) the color remained wine-red (). The color darkening of G1 indicates aggregation and increase in size, as the purple color is a feature of gold nanoparticles of size range larger than 540 nm, which is way larger than gold and chitosan nanoparticles prior to hybridization. As for G2, it showed no change in color which indicates that gold nanoparticles remained intact with no change in size on conjugation with lecithin–chitosan nanoparticles (Montazer & Harifi, Citation2018).
Figure 2. Images of formulations: (A) wine red color of bare gold nanoparticles (G0), (B) dark purple color of tacrolimus-loaded chitosan nanoparticles hybridized with gold nanoparticles (G1), and (C) preserved wine red color of tacrolimus-loaded lecithin–chitosan nanoparticles hybridized with gold nanoparticles (G2).
3.3. Particle size and polydispersity index analysis
The results shown in revealed that bare gold nanoparticles (G0) had a size of 22 ± 3 nm, confirming the wine-red color obtained.
Upon mixing gold with chitosan nanoparticles, the final system (G1) showed a tremendous size enlargement in comparison to the solitary nanoparticles (p<.05), also verified by the purple color of G1.
In the light of the data obtained by zeta sizer and by visual inspection, we may assume that particle disruption of C nanoparticles took place upon mixing with gold, while gold nanoparticles exerted aggregation and increase in size, confirmed by their color change to purple. This might be explained by the fact that chitosan nanoparticles prepared by ionic gelation method are merely stabilized by the repulsive forces between particles exerted by the amino groups of chitosan (Abosabaa et al., Citation2021). Therefore, any change of the physicochemical surrounding of the particles such as an increase in pH or ionic strength alteration, will lead to disruption of the particles due to the relatively fragile ionic bonds between chitosan and TPP (López-León et al., Citation2005). In this study, the ionic strength of the colloidal suspension was totally altered by adding the negatively charged gold nanoparticles. Hence, neutralizing the positive surface charges that stabilized the nano-sized colloidal suspension led to aggregation of chitosan nanoparticles. Besides, neutralizing the surface charges of gold nanoparticles probably led to their aggregation as well.
Regarding the gold–lecithin–chitosan hybrid nanoparticles (G2), it was found that adding gold nanoparticles to L ones did not cause aggregation; however, size enlargement from 118 nm to 195 nm was observed due to the interaction with the gold nanoparticles (p<.05). This could be rationalized by the presence of an additional stabilizing factor in case of L nanoparticles, besides the surface charge, which is Tween 80 (Bayoumi et al., Citation2021).
Regarding PDI values, the hybrid conjugate G1 showed a significant increase (p<.05) in PDI in comparison to C (0.76 vs. 0.43). This could be explained by the aggregation of C which in turn affected the homogeneity of the colloidal dispersion. On the other hand, G2 nanoparticles exhibited no significant change in the PDI relative to L nanoparticles (p>.05), insinuating the capability of the system to conjugate with the gold nanoparticles without affecting its homogeneity, probably due to the aforementioned stabilizing factors.
3.4. Zeta potential
The ZP results were found complementary to PS ones (). Bare gold nanoparticles (G0) demonstrated a negative surface charge. Regarding G1, the negative charge of bare gold nanoparticles was neutralized by the positive charge of C nanoparticles which dropped from 22 to 9.9 mV. This confirms that an ionic interaction took place between negatively charged gold and positively charged chitosan (Gilani et al., Citation2021; Rahat et al., Citation2021), hence destabilizing and disrupting C nanoparticles.
As for G2, the surface negativity of gold nanoparticles markedly increased on adding lecithin–chitosan nanoparticles to gold ones. Moreover, the positive surface charge of L nanoparticles (imparted by the chitosan moieties) was omitted as ZP flipped from 16.2 to −23.5 upon hybridization with gold nanoparticles (p<.01). It is suggested that an interaction took place between AuCl−1 and the choline groups in lecithin, in addition to, reacting with chitosan, leading to a huge increase of negative charges on the particles’ surface. The same phenomenon was previously reported on synthesizing gold–lecithin hybrid nanocarriers which showed highly negative surface charges (Javed et al., Citation2016). We hypothesize that lecithin–chitosan hybrid nanoparticles could withstand the interaction without disruption due to the flexible nature of the lipid–saccharide hybrid nanoparticles and their relative stability to stressful conditions (Gerelli et al., Citation2010). Moreover, the incorporation of Tween 80 probably enhanced the particles’ stabilization due to its amphiphilic nature, thus, orientation of its hydrophilic portions between polymer chains in the chitosan corona and the hydrophobic part within the lecithin core (Tan et al., Citation2011; Karjiban et al., Citation2012). Therefore, hindering the aggregation of chitosan and lecithin molecules upon omission of the stabilizing positive charges of amino and choline groups, respectively.
3.5. Microscopic examination of hybridized nanoparticles
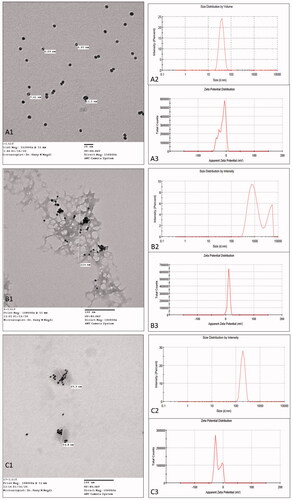
Upon examination under TEM, we could notice that G0, bare gold nanoparticles, were spherical in shape with a dark appearance and size range smaller than that detected by zeta-sizer (). This may be due to an overestimation of PS upon measuring by dynamic light scattering (DLS) technique as it depends on hydrodynamic diameter of particles which are in a colloidal form, i.e. dispersed in a liquid medium, while, TEM measures PS while in a dry form (Kaasalainen et al., Citation2017).
Figure 3. Transmission electron microscope images (A1, B1, and C1), particle size distribution by intensity (A2, B2, and C2), and zeta potential distribution by count (A3, B3, and C3). (A) G0 nanoparticles (bare-gold), (B) G1 nanoparticles (tacrolimus-loaded chitosan nanoparticles hybridized with gold), and (C) G2 nanoparticles (tacrolimus-loaded lecithin–chitosan nanoparticles hybridized with gold).
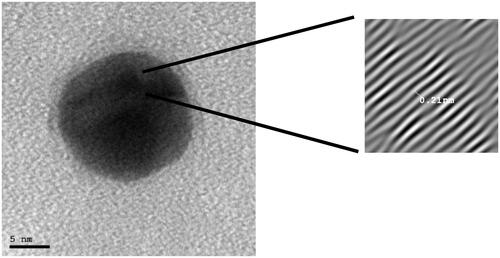
In order to further visualize the crystal morphology of G0, high resolution TEM was conducted, as shown in . The crystal lattice was observed as clear with lattice-fringe spacing of 0.21 nm between lattice fringes. These results are in agreement with those obtained in a previous study, in which the crystal lattice of gold nanoparticles was examined (Babu et al., Citation2012).
Figure 4. High resolution transmission electron microscope image of the crystal lattice of gold nanoparticles.
On the other hand, G1 image showed a chitosan polymeric network with aggregated gold nanoparticles adsorbed onto the network (). The appearance of gold nanoparticles adsorbed onto and surrounding the polymeric network rather than being uniformly dispersed and embedded in the field indicates an interaction between chitosan and gold, thus, confirming the disruption of C nanoparticles during hybridization. These results are in accordance with the PS results obtained by DLS.
More interestingly, G2 image revealed a spherical shape of L nanoparticles with gold nanoparticles embedded inside the core (). This suggests that the gold nanoparticles preferentially reacted with lecithin in the core rather than chitosan in the corona (Javed et al., Citation2016). It is noticeable that several gold nanoparticles are entrapped in each lecithin–chitosan particle, but the number of entrapped nanoparticles is random. However, the previously obtained net surface charge of G2 was negative; hence, it suggests that some of the gold nanoparticles might have reacted with the chitosan on the surface, as well.
3.6. X-ray diffraction analysis
To confirm the qualitative identification of G0 as gold nanoparticles, XRD was performed, as shown in , and the pattern showed three sharp distinctive peaks at ϴ equals: 38.2°, 44.4°, and 64.7°, corresponding to d-spacing hkl of 1 1 1, 2 0 0, and 2 2 0, respectively. These data prove the formation of crystalline gold nanoparticles, and is in consistence with previous findings (Babu et al., Citation2012; Goswami & Ghosh, Citation2013; Arafa et al., Citation2018; Xie et al., Citation2019).
Figure 5. X-ray diffraction pattern of: (A) G0 nanoparticles and (B) G2 nanoparticles.
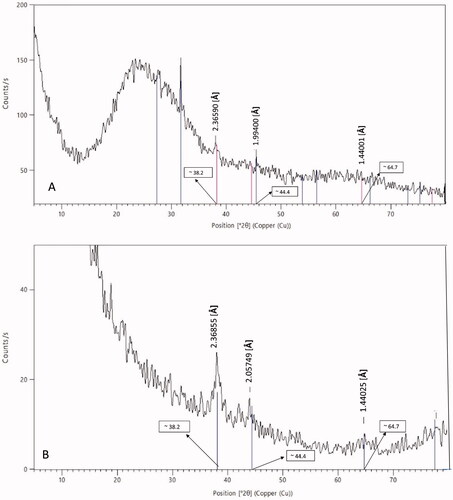
To validate successful hybridization of gold and L nanoparticles, XRD of G2 nanoparticles was conducted, as displayed in . The XRD pattern showed the same distinctive peaks of gold nanoparticles at ϴ equals; 38.2°, 44.4°, and 64.7°, corresponding to wavelengths equal to 2.47, 2.06, and 1.44 Å, respectively, but with a minimization in peaks’ intensity. This denotes that gold nanoparticles did not lose their crystalline structure upon conjugation with L nanoparticles; however, the peaks were weakened due to embedment of the gold nanoparticles in L nanoparticles, which exhibit an amorphous structure. A similar phenomenon was previously reported in a study on comparing XRD patterns of bare and polymer-coated iron oxide nanoparticles (Khalkhali et al., Citation2015).
According to the Scherrer equation, a formula that relates the size of solid crystallites to the broadening of a peak in XRD pattern (Ganesh Kumar et al., Citation2016):
The breadth B at half-peak-height of an XRD line is inversely proportional to the crystallite size (Dp); where λ is the X-ray wavelength, ϴ is the diffraction angle, and k is the constant. The average crystallite size (Dp) was calculated at a = 4.0699 Å, b = 4.0699 Å, and c = 4.0699 Å. It was found to be 21.7 nm for G0 and 21.57 nm for G2. Hence, the broadening of the gold characteristic peaks of gold nanoparticles upon conjugation with lecithin–chitosan ones denotes the minimization of the crystallite size.
Unfortunately, the XRD pattern of gold-conjugated tacrolimus-loaded chitosan nanoparticles (formula G1) could not be determined as the particles were resistant to lyophilization due to the presence of propylene glycol, which is a highly viscous solvent.
3.7. In vivo testing of the anti-psoriatic effect of tacrolimus nanoparticles and gold-hybridized tacrolimus nanoparticles on imiquimod-induced animal model
Induction of psoriasis by IMQ was done in groups A–E and the positive control, by applying Aldara® for three consecutive days (days 1–3 of the study). On day 3, all the previously mentioned groups showed typical psoriatic skin picture, skin thickness, and erythema were remarkable, and scales also appeared on the surface of the skin, as shown in .
Figure 6. A representative rat from each group of the in vivo study on day 3 (left) and day 6 (right). (A) Negative control group. (B) Positive control group. (C) Group A, treated with the marketed product. (D) Group B, treated with tacrolimus-loaded chitosan nanoparticles (figure adopted from our previous study Fereig et al., Citation2021a for comparison). (E) Group C, treated with tacrolimus-loaded lecithin–chitosan nanoparticles (figure adopted from our previous study Fereig et al., Citation2021b for comparison). (F) Group D, treated with tacrolimus-loaded chitosan nanoparticles conjugated with gold (G1). (G) Group E, treated with tacrolimus-loaded lecithin–chitosan nanoparticles conjugated with gold (G2).
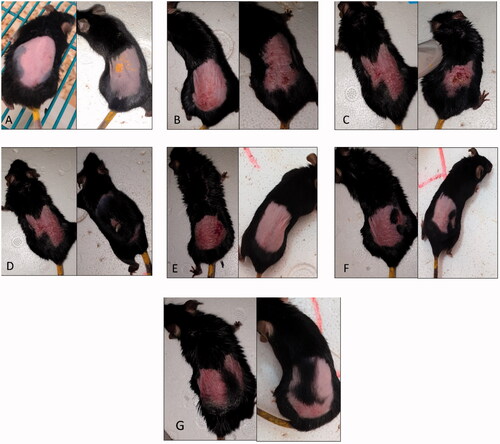
All treatment groups showed an improvement in erythema from day 4 of the study (after first dose of treatment). Also, erythema was improved, and scales fell off groups B, C, D, and E by the end of the study (day 6), while some of group A animals still retained skin scales ().
Groups B, C, D, and E animals showed more rapid and efficient improvement in the skin condition compared to group A; however, by the third dose of treatment erythema was slight to moderate in most animals of all treatment groups.
Group B animals showed an improved general skin condition (). Moreover, hair growth was remarkable which denotes a healthy condition of the skin and suppression of inflammation (Fereig et al., Citation2021a). This can be explained by the presence of chitosan in the applied treatment where it could play a role in enhancement of hair growth (Azuma et al., Citation2019). It is worth mentioning that hair growth is a sign of a healthy skin condition and psoriasis is reported to cause hair loss (Runne & Kroneisen-Wiersma, Citation1992).
Group C animals showed a skin condition that resembled normal skin () in terms of color, thickness, and skin texture with no sign of itching (Fereig et al., Citation2021b).
Group D animals showed an improved skin condition in terms of erythema, but with skin thickness and scales still noticeable by the end of the study (). This may be attributed to the aggregation that took place upon mixing gold nanoparticles with chitosan ones. This disruption of chitosan nanoparticles and their existence as a polymeric network rather than as nanoparticles, as visualized by TEM, probably hindered efficient deposition of the formulation in the upper skin layers. Another interesting observation was that group D animals did not show the rapid hair growth observed in group B, which further proves that the presence of chitosan in its nano-particulate form rather than merely its application as a polymer embedded with gold was crucial.
On the other hand, group E animals showed an improved skin condition by the end of the study (). The skin returned back to its normal condition, mimicking that of the negative control group in terms of color, thickness, and scaling. The anti-psoriatic therapeutic effect exerted by the tacrolimus-loaded lecithin–chitosan nanoparticles might have been re-enforced by the anti-inflammatory character of gold nanoparticles that minimized leukocytes’ migration and suppressed the pro-inflammatory cytokines, key elements in psoriasis’ pathogenesis. Hence, G2 acted not only as a drug carrier but also as a synergistic agent to inhibit the inflammatory process of psoriasis. Moreover, gold nanoparticles possess antioxidant and wound healing properties which, might have exerted a beneficial role in the suppression of inflammation.
Upon determining the total PASI score (), the success of induction from day 0 to day 3 of the study was evident from the elevated PASI values prior to treatment. It was noticeable that groups C, D, and E showed a rapid and efficient improvement in skin which was observable on day 4 of the study (after application of the first dose). On day 4, different treatment groups showed a significant difference upon applying ANOVA (p<.0001). Post hoc analysis showed that the difference between the positive control and groups A and B was not significant (p>.05), but was significant in comparison to groups C, D, and E, revealing success in the treatment of the aforementioned groups starting from the first application. On day 6, different groups showed statistically significantly different total PASI scores (p<.0001). All treatment groups (A, B, C, D, and E) were significantly different from the positive control group (p<.0001). The difference between groups A and B was non-significant (p>.05); however, they were significantly different from groups C, D, and E (p<.0001), which showed non-significant variation from one another (p>.05).
Figure 7. Psoriasis area severity index scores: (A) total psoriasis area severity index score, (B) skin thickness score, (C) erythema score, and (D) scaling score. Group C treated with tacrolimus-loaded chitosan nanoparticles, group L treated with tacrolimus-loaded lecithin–chitosan nanoparticles, group G1 treated with tacrolimus-loaded chitosan nanoparticles hybridized with gold and group G2 treated with tacrolimus-loaded lecithin–chitosan nanoparticles hybridized with gold. *Significantly different from positive control group (p<.05).
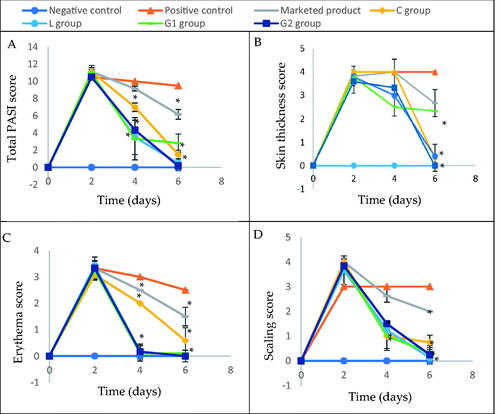
Regarding skin thickness (), there was no significant difference between group A animals and the positive control group (p>.05) at the end of the study. In contrast, all other treatment groups: B, C, D, and E showed significantly less skin thickness than the positive control (p<.0001). There was no significant difference between the aforementioned groups.
As for erythema score (), all treatment groups achieved an improvement that was significantly different from positive control by day 4 of the study (p<.0001), with groups C, D, and E showing less erythema. By day 6, groups C and E achieved zero erythema score in all animals.
Concerning scaling score (), all treatment groups, except group A, showed significantly less scales than the positive control on day 4 (p<.0001), an observation which was repeated on day 6, with group E being the lowest.
Conclusively, G2 formulation showed superior results in comparison to G1, and C formulations, but was as efficient as L formulation in most of the scores, indicating that the hybridization with gold nanoparticles only enhanced the anti-psoriatic effect of tacrolimus-loaded lecithin–chitosan in terms of scaling but not skin thickness and erythema. The results also emphasize the hypothesis that the disruption of chitosan nanoparticles upon conjugation with gold caused G1 formulation to be less efficient in psoriasis treatment than G2.
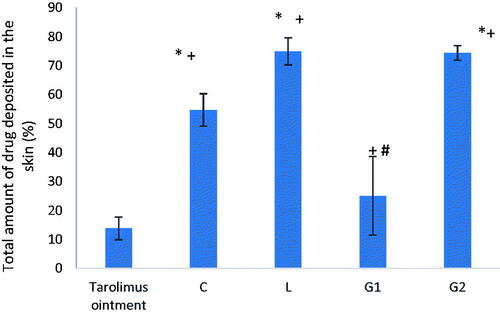
For further justification of the results of the in vivo experiment, the total amount of drug deposited in skin at the end of the in vivo study was determined. As shown in , G2 formula achieved high skin deposition (∼74%), comparable to that of L formula but significantly higher than C, G1 formulae and tacrolimus ointment (p<.0001). Thus, it is assumed that lecithin plays an important role in keeping the drug in the skin layer due to its lipid nature (Senyiğit et al., Citation2010). Therefore, the superior improvement observed in group D animals during the in vivo experiment may be attributed to the anti-inflammatory properties exerted by gold nanoparticles themselves, tacrolimus and chitosan due to its healing properties rather than acting as a drug carrier. While, both formulae L and G2 (groups C and E) achieved the same drug deposition percentage which denotes that the conjugation of gold nanoparticles did not boost skin deposition of the drug.
Figure 8. Total amount of drug deposited in the skin at the end of the in vivo study. Group C treated with tacrolimus-loaded chitosan nanoparticles, group L treated with tacrolimus-loaded lecithin–chitosan nanoparticles, group G1 treated with tacrolimus-loaded chitosan nanoparticles hybridized with gold, and group G2 treated with tacrolimus-loaded lecithin–chitosan nanoparticles hybridized with gold. *Significantly different from tacrolimus ointment group (p<.0001). +Significantly different from C formula group (p<.0001). #Significantly different from L formula group (p<.0001).
For further elucidation of the effect of gold nanoparticles (for their anti-inflammatory, antibacterial, and wound healing properties) hybridization with other nanoparticles on the deposition of the drug delivery system in the different skin layers, skin samples from groups D and E were examined under SEM microscope using a STEM detector. The negative control group skin was also examined as a control of the microscopic picture of the untreated mouse skin. Microscopic examination images of skin samples under STEM microscope are shown in .
Figure 9. Scanning transmission electron microscope images of skin samples with bright field: (A) negative control group, (C) group D, (E) group E and dark field: (B) negative control group, (D) group D, and (F) group E.
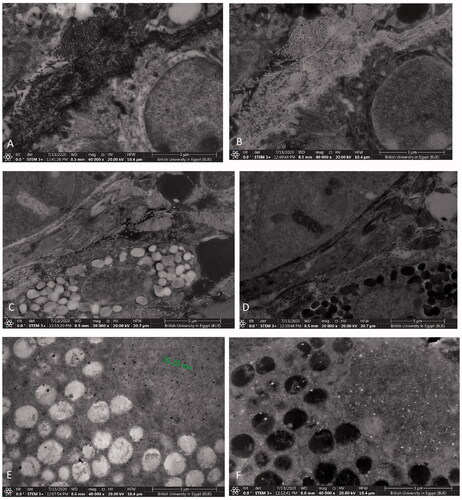
The negative control group sample () showed no characteristic particles in the examined sections of the skin as expected.
In group D treated with G1, a minute amount of gold particles were found in the skin () due to the aggregation of chitosan nanoparticles upon adding gold ones, leading to minimal skin deposition.
Whereas in group E treated with G2 (), the sample showed accumulation of gold nanoparticles in the skin. This clarifies the successful treatment of this animal group due to the efficient deposition of the nanoparticles in the target skin layers. The gold nanoparticles and gold nanoparticles’ aggregates are shown as dark spots on the bright field mode and white spots on the dark field mode. These results are similar to the pictures of gold nanoparticles in skin tissue previously taken by other researchers using TEM, high resolution SEM, and cryo-SEM imaging (Sonavane et al., Citation2008; Goldstein et al., Citation2014; Graf et al., Citation2015).
Therefore, STEM results revealed that the gold nanoparticles portion of G1 were not detected because G1 was deeply absorbed in the deeper layers beneath dermis where gold exerts its anti-inflammatory effect, which is in agreement with (Bessar et al., Citation2016; Barry, Citation2019; Fratoddi et al., Citation2019). Similarly, the same phenomenon was also reported for gold microparticles (Fuchs et al., Citation2020). In addition, decorating gold nanoparticles with chitosan which resulted in the positive charge of G1 resulted in the attraction of inflammatory cytokines from the inflamed microenvironment, our findings are in agreement with those obtained by Ahamad et al. (Citation2021). As for G2, it was retained in the skin due to several factors; the conjugation with L nanoparticles which have a higher tendency to deposit gold nanoparticles in the skin because of the chitosan corona, the high viscosity of G2 due to the presence of lecithin; in addition to, its lipidic nature and small PS, accordingly G2 was evidently retained in the skin upon imaging.
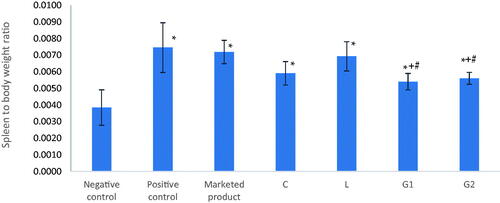
Furthermore, the ratio of spleen weight to body weight was determined as a marker of the inflammatory condition of the body. As shown in , the difference between positive control, negative control, and all treatment groups was significantly different on performing one-way ANOVA test. Post hoc analysis revealed that there was a significant difference (p<.05) between groups D and E (treated with G1 and G2, respectively) versus both the positive control and group A (treated with the marketed product). This emphasizes the role of gold nanoparticles conjugation with C and L nanoparticles in suppression of the inflammatory condition of the body, created by the autoimmune underlying pathology of psoriasis. The results are in accordance with previously reported data that proved the role of gold nanoparticles in management of psoriatic lesions (Bessar et al., Citation2016; Crisan, Citation2016; Crisan et al., Citation2018).
Figure 10. Spleen to body weight ratio of different groups that received different formulations at the end of the in vivo study. *Significantly different from negative control group (p<.05). +Significantly different from positive control group (p<.05). #Significantly different from marketed product group (p<.05).
Histopathological examination of skin samples () of all treatment and control groups emphasized the previous findings that groups C and E were the most superior in improving skin conditions, with all five treatment groups showing improved skin conditions compared to the positive control. In addition, all treatment groups which received nanoparticulate formulations (groups B, C, D, and E) showed a better skin condition than the marketed product group (group A).
Figure 11. Histopathological images of skin samples of different groups. (A) Negative control, (B) positive control, (C) group A, treated with the marketed product, (D) group B, treated with C nanoparticles, (E) group C, treated with L nanoparticles, (F) group D, treated with G1 nanoparticles, and (G) group E, treated with G2 nanoparticles. Black arrow: epidermal skin thickness. Red arrows: parakeratosis. Blue arrows: acanthosis. Green arrow: gold nanoparticles deposition around hair follicles.
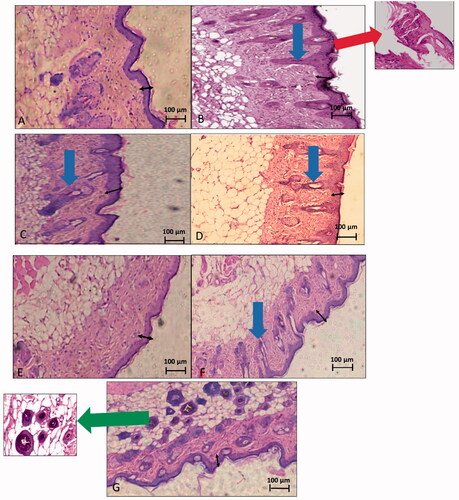
The negative control group () showed a completely normal skin picture with no signs of inflammation or psoriatic manifestations.
The positive control group () revealed a noticeable inflammatory condition of the skin. Inflammatory cells’ infiltration, hyperkeratosis; maximized thickness of the epidermal layer of the skin. Moreover, floating parakeratosis; an abnormal skin condition in which the granular layer of the skin migrates to the surface, was remarkable (red arrow) (Rosa & Mignogna, Citation2007), as well as, observable tubular acanthosis manifested as an abnormal extension of the epidermal layer that denotes migration of the stratum spinosum and stratum basale to the upper skin layers (Jain et al., Citation2011). Worthwhile to state that parakeratosis and tubular acanthosis are characteristic features of psoriatic skin.
In group A (), signs of mild skin improvement were apparent with remarkable persistent acanthosis of the epidermal layer and increased skin thickness with no signs of inflammatory cells’ infiltration. Floating parakeratosis also disappeared.
In group B (), the epidermal skin thickness was still remarkable, yet improved. Acanthosis was minimized compared to the positive control group. No signs of inflammatory cells’ infiltration nor floating parakeratosis were apparent.
Group C () exhibited a completely normal skin picture. No signs of parakeratosis or acanthosis were observable, with a skin thickness almost back to normal. Inflammatory cells’ infiltration was missing as well. The overall skin picture was comparable to that of the negative control group.
In group D (), an improved skin condition was apparent with no signs of inflammation in the subcutaneous tissue. Floating parakeratosis completely disappeared, too. However, epidermal skin was still hyperkeratosed and acanthosis was still remarkable (blue arrow).
Finally, group E () showed a skin picture that resembled that of the negative control group. Both parakeratosis and acanthosis were completely absent along with other inflammatory parameters such as inflammatory cells’ infiltration. The epidermal thickness was also remarkably improved with evident deposition of gold around hair follicles (green arrow).
4. Conclusions
The conjugation of chemically synthesized gold nanoparticles (G0) (prepared by citrate reduction) with tacrolimus-loaded chitosan nanoparticles (C) (synthesized by a modified ionic gelation technique) was unsuccessful and led to aggregation of both nanosystems (G1). The gold nanoparticles conjugation with tacrolimus-loaded self-assembled lecithin–chitosan hybrid nanoparticles (L) was successful (G2) and improved psoriatic plaques in vivo; in terms of visual observations, PASI score and histopathological examination of skin samples, but was indifferent from sole-tacrolimus-loaded lecithin–chitosan (L) nanoparticles’ effect in some markers. All gold-containing formulations displayed significantly lower spleen to body weight ratio in mice, compared to other formulations, as well as better skin histopathological examination, which confirms the anti-inflammatory effect exerted by the gold nanoparticles on the body. As a future perspective, we suggest synthesis of gold nanoparticles using chitosan as a reducing agent and assessment of its anti-psoriatic effect.
Supplemental Material
Download MS Word (13.4 KB)Disclosure statement
All authors declare that there are no financial and personal relationships with other people or organizations that could inappropriately influence their work or state.
Correction Statement
This article has been corrected with minor changes. These changes do not impact the academic content of the article.
Related Research Data
References
- Abdelbary AA, AbouGhaly MHH. (2015). Design and optimization of topical methotrexate loaded niosomes for enhanced management of psoriasis: application of Box–Behnken design, in-vitro evaluation and in-vivo skin deposition study. Int J Pharm 485:1726–43.
- Abdel-Mottaleb MM, Lamprecht A. (2016). In vivo skin penetration of macromolecules in irritant contact dermatitis. Int J Pharm 515:384–9.
- Abdel-Mottaleb MM, Neumann D, Lamprecht A. (2011). Lipid nanocapsules for dermal application: a comparative study of lipid-based versus polymer-based nanocarriers. Eur J Pharm Biopharm 79:36–42.
- Abosabaa SA, Arafa MG, ElMeshad AN. (2021). Hybrid chitosan-lipid nanoparticles of green tea extract as natural anti-cellulite agent with superior in vivo potency: full synthesis and analysis. Drug Deliv 28:2160–76.
- Agarwal H, Nakara A, Shanmugam VK. (2019). Anti-inflammatory mechanism of various metal and metal oxide nanoparticles synthesized using plant extracts: a review. Biomed Pharmacother 109:2561–72.
- Ahamad N, Kar A, Mehta S, et al. (2021). Immunomodulatory nanosystems for treating inflammatory diseases. Biomaterials 274:120875.
- Akashi T, Nefuji T, Yoshida M, Hosoda J. (1996). Quantitative determination of tautomeric FK506 by reversed-phase liquid chromatography. J Pharm Biomed Anal 14:339–46.
- Amaral M, Charmier AJ, Afonso RA, et al. (2021). Gold-based nanoplataform for the treatment of anaplastic thyroid carcinoma: a step forward. Cancers 13:1242.
- Arafa M, Ayoub B. (2017). Nano-vesicles of salbutamol sulphate in metered dose inhalers: formulation, characterization and in vitro evaluation. Int J Appl Pharm 9:100–5.
- Arafa M, Girgis G, El-Dahan M. (2020). Chitosan-coated PLGA nanoparticles for enhanced ocular anti-inflammatory efficacy of atorvastatin calcium. Int J Nanomedicine 15:1335–47.
- Arafa MG, Ayoub BM. (2018). Bioavailability study of niosomal salbutamol sulfate in metered dose inhaler: controlled pulmonary drug delivery. J Aerosol Med Pulm Drug Deliv 31:114–5.
- Arafa MG, El-Kased RF, Elmazar MM. (2018). Thermoresponsive gels containing gold nanoparticles as smart antibacterial and wound healing agents. Sci Rep 8:16.
- Azuma K, Koizumi R, Izawa H, et al. (2019). Hair growth-promoting activities of chitosan and surface-deacetylated chitin nanofibers. Int J Biol Macromol 126:11–7.
- Babu PJ, Saranya S, Sharma P, et al. (2012). Gold nanoparticles: sonocatalytic synthesis using ethanolic extract of Andrographis paniculata and functionalization with polycaprolactone-gelatin composites. Front Mater Sci 6:236–49.
- Barmettler G, Ziegler U. (2019). Standard preparation protocol of human skin samples for transmission electron microscopy. In: Böttcher-Haberzeth S, Biedermann T, eds. Skin tissue engineering: methods and protocols. New York (NY): Springer, 205–15.
- Barry SCL. (2019). Biogenic synthesis of gold nanoparticles using red and green pear fruit extracts.
- Bayoumi M, Arafa MG, Nasr M, Sammour OA. (2021). Nobiletin-loaded composite penetration enhancer vesicles restore the normal miRNA expression and the chief defence antioxidant levels in skin cancer. Sci Rep 11:20197.
- Bennett J, Cassidy H, Slattery C, et al. (2016). Tacrolimus modulates TGF-β signaling to induce epithelial-mesenchymal transition in human renal proximal tubule epithelial cells. J Clin Med 5:50.
- Bessar H, Venditti I, Benassi L, et al. (2016). Functionalized gold nanoparticles for topical delivery of methotrexate for the possible treatment of psoriasis. Colloids Surf B Biointerfaces 141:141–7.
- Calvo P, Remuñán-López C, Vila-Jato JL, Alonso MJ. (1997). Novel hydrophilic chitosan-polyethylene oxide nanoparticles as protein carriers. J Appl Polym Sci 63:125–32.
- Chen Y, Wu Y, Gao J, et al. (2017). Transdermal vascular endothelial growth factor delivery with surface engineered gold nanoparticles. ACS Appl Mater Interfaces 9:5173–80.
- Crisan D, Scharffetter-Kochanek K, Crisan M, et al. (2018). Topical silver and gold nanoparticles complexed with Cornus mas suppress inflammation in human psoriasis plaques by inhibiting NF-κB activity. Exp Dermatol 27:1166–9.
- Crisan M, David L, Moldovan B, et al. (2013). New nanomaterials for the improvement of psoriatic lesions. J Mater Chem B 1:3152–8.
- Crisan D. (2016). Anti-inflammatory effect of metallic silver and gold nanoparticles complexed with polyphenolic compounds in human chronic stationary plaque psoriasis [doctoral dissertation]. Universität Ulm.
- Dheer D, Jyoti Gupta PN, Shankar R. (2018). Tacrolimus: an updated review on delivering strategies for multifarious diseases. Eur J Pharm Sci 114:217–27.
- El-Zaafarany GM, Soliman ME, Mansour S, Awad GAS. (2016). Identifying lipidic emulsomes for improved oxcarbazepine brain targeting: in vitro and rat in vivo studies. Int J Pharm 503:127–40.
- Fereig SA, El-Zaafarany GM, Arafa MG, Abdel-Mottaleb MMA. (2021a). Tacrolimus-loaded chitosan nanoparticles for enhanced skin deposition and management of plaque psoriasis. Carbohydr Polym 268:118238.
- Fereig SA, El-Zaafarany GM, Arafa MG, Abdel-Mottaleb MMA. (2021b). Self-assembled tacrolimus-loaded lecithin–chitosan hybrid nanoparticles for in vivo management of psoriasis. Int J Pharm 608:121114.
- Fratoddi I, Benassi L, Botti E, et al. (2019). Effects of topical methotrexate loaded gold nanoparticle in cutaneous inflammatory mouse model. Nanomedicine 17:276–86.
- Friedman N, Dagan A, Elia J, et al. (2021). Physical properties of gold nanoparticles affect skin penetration via hair follicles. Nanomedicine 36:102414.
- Fuchs CS, Ardigo M, Haedersdal M, Mogensen M. (2020). In vivo reflectance confocal microscopy of gold microparticles deposited in the skin. A case report on cutaneous chrysiasis. Lasers Surg Med 52:13–6.
- Fultz B, Howe JM. (2001). Diffraction and the X-ray powder diffractometer. In: Fultz B, Howe JM, eds. Transmission electron microscopy and diffractometry of materials. Berlin, Heidelberg: Springer, 1–61.
- Ganesh Kumar C, Pombala S, Poornachandra Y, Vinod Agarwal S. (2016). Chapter 4 – synthesis, characterization, and applications of nanobiomaterials for antimicrobial therapy. In: Grumezescu AM, ed. Nanobiomaterials in antimicrobial therapy. Norwich, NY: William Andrew Publishing, 103–52.
- Gerelli Y, Di Bari MT, Barbieri S, et al. (2010). Flexibility and drug release features of lipid/saccharide nanoparticles. Soft Matter 6:685–91.
- Gilani SJ, Bin-Jumah M, Rizwanullah M, et al. (2021). Chitosan coated luteolin nanostructured lipid carriers: optimization, in vitro–ex vivo assessments and cytotoxicity study in breast cancer cells. Coatings 11: 158.
- Goldstein A, Soroka Y, Frušić-Zlotkin M, et al. (2014). High resolution SEM imaging of gold nanoparticles in cells and tissues: HRSEM imaging of gold nanoparticles. J Microsc 256:237–47.
- Goswami AM, Ghosh S. (2013). Biological synthesis of colloidal gold nanoprisms using Penicillium citrinum MTCC9999. J Biomater Nanobiotechnol 4:20–7.
- Graf C, Nordmeyer D, Ahlberg S, et al. (2015). Penetration of spherical and rod-like gold nanoparticles into intact and barrier-disrupted human skin. In: Parak WJ, Osinski M, Liang X-J, eds. Presented at the SPIE BiOS; San Francisco, CA, 93381L.
- Grine L, Dejager L, Libert C, Vandenbroucke RE. (2015). An inflammatory triangle in psoriasis: TNF, type I IFNs and IL-17. Cytokine Growth Factor Rev 26:25–33.
- Gunawan C, Lim M, Marquis C, Amal R. (2014). Nanoparticle–protein corona complexes govern the biological fates and functions of nanoparticles. J Mater Chem B 2:2060–83.
- Gupta R, Kashyap N, Rai B. (2017). Transdermal cellular membrane penetration of proteins with gold nanoparticles: a molecular dynamics study. Phys Chem Chem Phys 19:7537–45.
- Gupta R, Rai B. (2017). Effect of size and surface charge of gold nanoparticles on their skin permeability: a molecular dynamics study. Sci Rep 7:45292.
- Hsiao PF, Peng S, Tang T-C, et al. (2016). Enhancing the in vivo transdermal delivery of gold nanoparticles using poly(ethylene glycol) and its oleylamine conjugate. Int J Nanomedicine 11:1867–78.
- Hussein A, Abdel-Mottaleb MMA, El-assal M, Sammour O. (2020). Novel biocompatible essential oil-based lipid nanocapsules with antifungal properties. J Drug Deliv Sci Technol 56:101605.
- Jain A, Doppalapudi S, Domb AJ, Khan W. (2016). Tacrolimus and curcumin co-loaded liposphere gel: synergistic combination towards management of psoriasis. J Control Release 243:132–45.
- Jain S, Mittal A, Jain A. (2011). Enhanced topical delivery of cyclosporin-A using PLGA nanoparticles as carrier. Curr Nanosci 7:524–30.
- Javed I, Hussain SZ, Shahzad A, et al. (2016). Lecithin–gold hybrid nanocarriers as efficient and pH selective vehicles for oral delivery of diacerein—in-vitro and in-vivo study. Colloids Surf B Biointerfaces 141:1–9.
- Kaasalainen M, Aseyev V, von Haartman E, et al. (2017). Size, stability, and porosity of mesoporous nanoparticles characterized with light scattering. Nanoscale Res Lett 12:74.
- Karjiban RA, Basri M, Rahman MBA, Salleh AB. (2012). Structural properties of nonionic Tween80 micelle in water elucidated by molecular dynamics simulation. APCBEE Proc 3:287–97.
- Katas H, Hussain Z, Rahman SA. (2013). Storage stabilisation of albumin-loaded chitosan nanoparticles by lyoprotectants. Trop J Pharm Res 12:135–42.
- Khalkhali M, Rostamizadeh K, Sadighian SS, et al. (2015). The impact of polymer coatings on magnetite nanoparticles performance as MRI contrast agents: a comparative study. DARU J Pharm Sci 23:1–12.
- Li G, Jiang Y, Huang K, et al. (2008). Preparation and properties of magnetic Fe3O4–chitosan nanoparticles. J Alloys Compd 466:451–6.
- López-León T, Carvalho ELS, Seijo B, et al. (2005). Physicochemical characterization of chitosan nanoparticles: electrokinetic and stability behavior. J Colloid Interface Sci 283:344–51.
- Malecic N, Young H. (2016). Tacrolimus for the management of psoriasis: clinical utility and place in therapy. Psoriasis 6:153–63.
- Mao K-L, Fan Z-L, Yuan J-D, et al. (2017). Skin-penetrating polymeric nanoparticles incorporated in silk fibroin hydrogel for topical delivery of curcumin to improve its therapeutic effect on psoriasis mouse model. Colloids Surf B Biointerfaces 160:704–14.
- Micali G, Verzì AE, Giuffrida G, et al. (2019). Inverse psoriasis: from diagnosis to current treatment options. Clin Cosmet Investig Dermatol 12:953–9.
- Mihatsch M, Kyo M, Morozumi K, et al. (1998). The side-effects of ciclosporine-A and tacrolimus. Clin Nephrol 49:356–63.
- Montazer M, Harifi T. (2018). 2 – nanofinishing: fundamental principles. In: Montazer M, Harifi T, eds. Nanofinishing of textile materials. Woodhead Publishing, 19–34.
- Moothanchery M, Seeni RZ, Xu C, Pramanik M. (2017). In vivo studies of transdermal nanoparticle delivery with microneedles using photoacoustic microscopy. Biomed Opt Express 8:5483–92.
- Nativo P, Prior IA, Brust M. (2008). Uptake and intracellular fate of surface-modified gold nanoparticles. ACS Nano 2:1639–44.
- Nemati H, Ghahramani M-H, Faridi-Majidi R, et al. (2017). Using siRNA-based spherical nucleic acid nanoparticle conjugates for gene regulation in psoriasis. J Control Release 268:259–68.
- Patel P, Panchal S, Mehta T, et al. (2011). Reversed-phase high performance liquid chromatographic (RP-HPLC) method for determination of tacrolimus in bulk and pharmaceutical formulation. Int J Pharm Pharm Sci 3:220–2.
- Pecchio M, Salman H, Irache JM, et al. (2014). Development and validation of a HPLC method for the determination of cyclosporine A in new bioadhesive nanoparticles for oral administration. Indian J Pharm Sci 76:132–7.
- Perde-Schrepler M, David L, Olenic L, et al. (2016). Gold nanoparticles synthesized with a polyphenols-rich extract from cornelian cherry (Cornus mas) fruits: effects on human skin cells. J Nanomater 2016:1–13.
- Pischon H, Radbruch M, Ostrowski A, et al. (2017). Stratum corneum targeting by dendritic core–multishell-nanocarriers in a mouse model of psoriasis. Nanomedicine 13:317–27.
- Pissuwan D, Nose K, Kurihara R, et al. (2011). A solid-in-oil dispersion of gold nanorods can enhance transdermal protein delivery and skin vaccination. Small 7:215–20.
- Rahat I, Imam SS, Rizwanullah M, et al. (2021). Thymoquinone-entrapped chitosan-modified nanoparticles: formulation optimization to preclinical bioavailability assessments. Drug Deliv 28:973–84.
- Rosa G, Mignogna C. (2007). The histopathology of psoriasis. Reumatismo 59: 46–8.
- Runne U, Kroneisen-Wiersma P. (1992). Psoriatic alopecia: acute and chronic hair loss in 47 patients with scalp psoriasis. Dermatology 185:82–7.
- Senyiğit T, Sonvico F, Barbieri S, et al. (2010). Lecithin/chitosan nanoparticles of clobetasol-17-propionate capable of accumulation in pig skin. J Control Release 142:368–73.
- Silva LAD, Taveira SF, Lima EM, Marreto RN. (2012). In vitro skin penetration of clobetasol from lipid nanoparticles: drug extraction and quantitation in different skin layers. Braz J Pharm Sci 48:811–7.
- Singh H, Du J, Singh P, Hoo Y. (2018). Ecofriendly synthesis of silver and gold nanoparticles by Euphrasia officinalis leaf extract and its biomedical applications. Artif Cells Nanomed Biotechnol 46:1163–70.
- Sonavane G, Tomoda K, Sano A, et al. (2008). In vitro permeation of gold nanoparticles through rat skin and rat intestine: effect of particle size. Colloids Surf B Biointerfaces 65:1–10.
- Sonvico F, Cagnani A, Rossi A, et al. (2006). Formation of self-organized nanoparticles by lecithin/chitosan ionic interaction. Int J Pharm 324:67–73.
- Sun L, Liu Z, Lin Z, et al. (2018). Comparison of normal versus imiquimod-induced psoriatic skin in mice for penetration of drugs and nanoparticles. Int J Nanomedicine 13:5625–35.
- Swindell WR, Michaels KA, Sutter AJ, et al. (2017). Imiquimod has strain-dependent effects in mice and does not uniquely model human psoriasis. Genome Med 9:24.
- Tan Q, Liu W, Guo C, Zhai G. (2011). Preparation and evaluation of quercetin-loaded lecithin–chitosan nanoparticles for topical delivery. Int J Nanomedicine 6:1621–30.
- Turkevich J, Stevenson PC, Hillier J. (1951). A study of the nucleation and growth processes in the synthesis of colloidal gold. Discuss Faraday Soc 11:55–75.
- Uchiyama MK, Deda DK, Rodrigues SFdP, et al. (2014). In vivo and in vitro toxicity and anti-inflammatory properties of gold nanoparticle bioconjugates to the vascular system. Toxicol Sci 142:497–507.
- Xie P, Qi Y, Wang R, et al. (2019). Aqueous gold nanoparticles generated by AC and pulse-power-driven plasma jet. Nanomaterials 9:1488.
- Xu Y, Pan W, Qin M, et al. (2016). Combination of hydrotropic nicotinamide with nanoparticles for enhancing tacrolimus percutaneous delivery. Int J Nanomedicine 11:4037–50.
- Zonneveld IM, Rubins A, Jablonska S, et al. (1998). Topical tacrolimus is not effective in chronic plaque psoriasis. A pilot study. Arch Dermatol 134:1101–2.