
 ?Mathematical formulae have been encoded as MathML and are displayed in this HTML version using MathJax in order to improve their display. Uncheck the box to turn MathJax off. This feature requires Javascript. Click on a formula to zoom.
Abstract
Our study aimed to develop a self-microemulsifying drug delivery system for the poorly aqueous-soluble drug Coenzyme Q10, to improve the dissolution and the oral bioavailability. Excipients were selected based on their Coenzyme Q10 solubility, and their concentrations were set for the optimization of the microemulsion by using a D-optimal mixture design to achieve a minimum droplet size and a maximum solubility of Coenzyme Q10 within 15 min. The optimized formulation was composed of an oil (omega-3; 38.55%), a co-surfactant (Lauroglycol® 90; 31.42%), and a surfactant (Gelucire® 44/14; 30%) and exhibited a mean droplet size of 237.6 ± 5.8 nm and a drug solubilization (at 15 min) of 16 ± 2.48%. The drug dissolution of the optimized formulation conducted over 8 h in phosphate buffer medium (pH 6.8) was significantly higher when compared to that of the Coenzyme Q10 suspension. A pharmacokinetic study in rats revealed a 4.5-fold and a 4.1-fold increase in the area under curve and the peak plasma concentration values generated by the optimized formulation respectively, as compared to the Coenzyme Q10 suspension. A Coenzyme Q10 brain distribution study revealed a higher Coenzyme Q10 distribution in the brains of rats treated with the optimized formulation than the Coenzyme Q10 suspension. Coenzyme Q10-loaded self microemulsifying drug delivery system was successfully formulated and optimized by a response surface methodology based on a D-optimal mixture design and could be used as a delivery vehicle for the enhancement of the oral bioavailability and brain distribution of poorly soluble drugs such as Coenzyme Q10.
Introduction
The lipid-soluble antioxidant coenzyme Q (CoQ), also referred to as ubiquinone or 2,3-dimethoxy-5-methyl-6-polyprenyl-1,4-benzoquinone, is produced in animals (Laredj et al., Citation2014; Hernandez-Camacho et al., Citation2018; Sweed et al., Citation2021). It is composed of a benzoquinone ring equipped with redox-active sites, and a long polyisoprenoid lipid chain that is capable of placing the molecule in the mid-plane of a membrane bilayer (Diaz-Casado et al., Citation2019). Depending on the species, the polyisoprenoid lipid chain has between six and ten subunits. Six subunits can be found in Saccharomyces cerevisiae (CoQ6), seven subunits can be found in Crucianella Maritima (CoQ7), eight subunits can be found in Escherichia coli (CoQ8), nine and ten subunits can be found in rodents (CoQ9 and CoQ10), while ten subunits can be found in humans (CoQ10) (Hernandez-Camacho et al., Citation2018).
Mitochondria is the principal location of CoQ synthesis in eukaryotes. Nuclear-encoded CoQ proteins can biochemically synthesize CoQ; however, the exact mechanism of this process has not been fully described yet. Apart from mitochondria, CoQ can also be produced in other cellular organelles (mainly in the endoplasmic reticulum and the Golgi, apparatus), and it can be found virtually in all endomembrane, plasma membrane, and serum lipoproteins (Diaz-Casado et al., Citation2019). CoQ protects cell membranes and plasma lipoproteins against free radicals by keeping alpha-tocopherol and ascorbic acid in a reduced state (Lopez-Lluch et al., Citation2010). It controls apoptosis by reducing lipid peroxidation, and it is particularly significant for the plasma membrane, where it reduces vitamins C and E, thereby preventing ceramide-mediated apoptosis; a major regulator of longevity in normal aging (Hernandez-Camacho et al., Citation2018). Through local regulation of cytosolic redox intermediates such as NAD(P)H, CoQ10 can also regulate cellular metabolism, signaling, and proliferation (Lopez-Lluch et al., Citation2010). Moreover, treatment with CoQ has been shown to protect against cardiovascular diseases (Q-SYMBIO Study Investigators, 2014; Alehagen et al., Citation2016).
On the other hand, a variety of variables (including heredity, aging, and statin medication) can cause physiological CoQ10 levels to drop (Potgieter et al., Citation2013). CoQ10 deficiency has also been linked to ailments involving oxidative stress, such as neurological diseases, diabetes, cancer, and cardiovascular disease (Dhanasekaran and Ren, Citation2005). In fact, clinical improvement has been observed in CoQ10-deficient patients following CoQ10 supplementation; the latter is considered as highly safe, with almost no adverse effects at doses up to 1,200 mg/kg/day (Hidaka et al., Citation2008). Due to its strong antioxidant activity, CoQ10 has also been employed by the cosmetic industry (Fuller et al., Citation2006; Yue et al., Citation2010). However, CoQ10 is a highly hydrophobic molecule, and as such, it is exceedingly insoluble in water. As a result, the small intestine absorbs CoQ10 in a slow and incomplete manner, leading to limited oral bioavailability of CoQ10 in humans (Miles, Citation2007). Additionally, CoQ10 is known to be sensitive to heat, light, and oxygen (Fir et al., Citation2009). Hence, considering the physicochemical properties of CoQ10, high-dose and stable CoQ10 formulations are difficult to achieve (Fan et al., Citation2017). Accurately dosing the CoQ10 and pressing it into tablets might be difficult, due to the poor rheology and low melting point of a CoQ10 (Abdel-Hamid and Betz, Citation2012; Nakamura et al., Citation2016). Therefore, attempts should be made in order to overcome these limitations and improve the solubility, oral bioavailability, and stability of CoQ10 formulations (Kumar et al., Citation2016).
Considering the rheological, physiochemical, and poor oral bioavailability characteristics of CoQ10, lipid based formulations like emulsions could be potentially used as a vehicle for the administration of this compound, since previous reports have suggested an improvement in the absorption and bioavailability of hydrophobic drugs like CoQ10 when co-ingested with lipids (oils) (Xia et al., Citation2006; Arenas-Jal et al., Citation2020; Noh et al., Citation2022). Due to their small particle size, their ability to exert a good protection against enzymatic hydrolysis, their improved oral bioavailability, their superior thermodynamic stability, and their solubilization capacity, microemulsions are preferred over emulsions (Johal et al., Citation2016). However, the poor patient compliance (due to poor palatability of the microemulsion-based formulations, as well as due to our inability to encapsulate them into soft and hard gelatin capsules) is a major disadvantage of these formulations (Joshi et al., Citation2016). On the other hand, the self-emulsifying drug delivery system (SEDDS), a self-emulsifying oil formulation that presents a lipid-based approach for enhancing the solubility and bioavailability of lipophilic drugs, can reduce the dose frequency, avoid the first-pass metabolism, and bypass the P-glycoprotein (P-gp) efflux; therefore, SEDDS should be considered as a viable option for the formulation of CoQ10 that can overcome the limitations of microemulsions (Karun Kataria et al., Citation2014).
SEDDS is an isotropic mixture of oils, surfactants, and co-surfactants that allows for an oil-in-water microemulsion under mild agitation in gastrointestinal fluids, so that the lipophilic drug remains in the solution after bypassing the dissolution step; the rate-limiting step in the absorption of hydrophobic drugs (Garg et al., Citation2015). The SEDDS typically produces emulsion with a droplet size of >300 nm (in diameter); however, the latter may vary from coarse to micron size. On the other hand, self-microemulsifying drug delivery system (SMEDDS) is able to generate transparent microemulsions with a droplet size of 100 − 250 nm (in diameter). In contrast to emulsions that are delicate and metastable dispersed forms, the SMEDDS is physically stable, thereby enhancing both the pace and the level of absorption of lipophilic drugs, with a lower rate of dissolution resulting in improved blood-time profiles. Moreover, the use of long-chain unsaturated fatty acids for solubilizing poorly soluble drugs in a SMEDDS formulation is also known to promote lymphatic drug transport (Sweed et al., Citation2021; Tran and Park, Citation2021).
The formulation of SMEDDS by using the empirical design (based on trial and error) is known to be time-consuming, labor-intensive, expensive, and inefficient, thereby limiting the in-depth analysis of the effect of each formulation component and of their probable interactions. Therefore, statistical tools based on the response surface methodology and experimental design (such as the central composite, the Box-Behnken, the factorial, and the mixture designs) have been introduced. The main effect and interaction of all variables in a SMEDDS formulation can be estimated by employing statistical optimization. For the optimization of a SMEDDS formulation, the D-optimal mixture design is the most popular response surface methodology used; this is due to the fact that this design considers the entire (100%) SMEDDS formulation, while the central composite, the Box-Behnken, and the factorial designs do not.
In this study, a CoQ10-loaded SMEDDS was formulated and optimized by using the D-optimal mixture design, with the motive of improving the in vitro dissolution, the in vivo oral bioavailability, as well as the brain distribution of CoQ10 in Sprague Dawley rats.
Materials and methods
Materials
The CoQ10 used in the herein described experiments was obtained from Daewoong Pharmaceutical Co., Ltd. (Seoul, South Korea). Gelucire® 44/14, Lauroglycol® 90, Lauroglycol® FCC, Labrafil® M 1944 CS, Labrafil® M 2125 CS, Labrafac® PG, PeceolTM, Plurol® Oleique CC 497, Labrasol® ALF, Transcutol HP were purchased from Gattefossé (Saint Priest, France). PEG 400 was purchased from Sigma-Aldrich (St Louis, Missouri, USA). Capmule® MCM EP was purchased from Abitec Co (Janesville, WI, USA). Cremophor® ELP and Cremophore® RH40 were purchased from BASF SE (Ludwigshafen, Germany). All the chemicals and solvents used in this study were of the highest analytical grade.
Solubility studies
The equilibrium method was used for the estimation of the solubility of CoQ10 in various synthetic or semi-synthetic oils (namely, Capmul® MCM EP, Labrafil® M1944 CS, Labrafil® M 2125 CS, Labrafac® PG, PeceolTM, and omega-3), and surfactants/co-surfactants (namely, Lauroglycol® 90 or LG, Plurol® Oleique CC 497, Tween® 20, Tween® 80, Cremophor® ELP, Cremophore® RH40, Transcutol® HP, PEG 400, and Gelucire® 44/14 or GEL). The excess amount of CoQ10 was added to 1 mL of the various excipients selected. Test tubes containing the mixtures were sealed and kept in ambient conditions with intermittent shaking (Daihan Scientific, South Korea) for 48 h in order to achieve equilibrium. The mixtures were then centrifuged (Hanil Scientific Inc., South Korea) at 16,000 × g, for 10 min, in order to remove the excess CoQ10. The supernatant was then filtered through a 0.45-µm H-PTFE syringe membrane filter (WhatmanTM Puradisc), and the concentration of CoQ10 in the filtrate was measured by using high-performance liquid chromatography (HPLC; Agilent Technologies, California, USA) after appropriate dilution with dimethylformamide (Yeom et al., Citation2015).
HPLC analysis of CoQ10 concentrations
For the determination of CoQ10 solubility and in vitro drug release study, concentration of CoQ10 was determined by using reverse-phase HPLC. A 4.6 × 250 mm (5-µm particle size) Phenomenex Gemini XDB-C18 column was used. The column temperature was maintained at 20 °C, while the flow rate was maintained at 1 mL/min. The isocratic mobile phase used acetonitrile and tetrahydrofuran (65:35 [v/v]). Finally, 20 µL of each sample were injected into the column, and the samples’ CoQ10 concentrations were measured under ultraviolet detection at 274 nm.
Formulation of SMEDDS
Initially, a blank SMEDDS formulation was prepared by mixing oil, surfactant and co-surfactant. The mixtures were vortexed in order to obtain a clear homogenous solution. The CoQ10-loaded SMEDDS formulation was prepared by the addition of 20 mg of CoQ10 to 1 mL of the blank SMEDDS formulation (Yeom et al., Citation2015).
Construction of the pseudo-ternary phase diagram
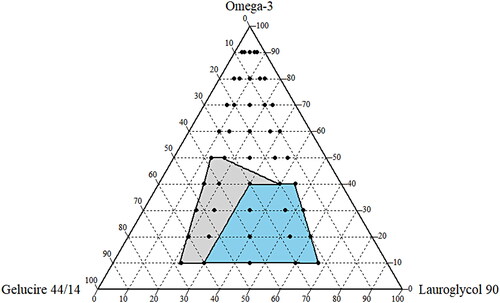
Based upon the solubility studies, omega-3, LG and GEL were chosen as oil, co-surfactant and surfactant, respectively. By employing the water titration method at 37 °C, the pseudo-ternary phase diagrams were constructed for the determination of the microemulsion area. The surfactant and co-surfactant mixture (Smix) was prepared in five different volume ratios (namely,1:3, 1:2, 1:1, 2;1 and 3:1). Each Smix ratio was combined with oil in a different ratio (namely, 1:9, 2:8, 3:7, 4:6, 5:5, 6:4, 7:3, 8:2, and 9:1) to a total volume of 1 mL. The prepared mixtures were then vortexed in order to achieve a clear homogenous solution. The homogenous solution was further subjected to an aqueous titration where 0.1 mL of each mixture was added in 10 mL of water (37 °C), and a magnetic bar was used in order to stir the mixture gently (at 300 rpm, for 2 min). The ability to self-emulsify was separated into two categories: grade I (where the formulation was clear or slightly bluish, with an emulsifying time of less than 1 min) and grade II (where the formulation was bluish white, with an emulsifying time of 1 − 2 min). Formulations with large oil droplets present on their surface exhibited poor or minimal emulsification and were therefore discarded. The identification of the microemulsion region was carried out by constructing a pseudo-ternary phase diagram through the CHEMIX School (version 10.0) software.
Optimization of CoQ10-loaded SMEDDS formulations by using the D-optimal mixture design
In order to optimize the CoQ10-loaded SMEDDS formulation, the D-optimal mixture design was used. The effect of three independent variable components on the dependent variables was evaluated. The concentrations of omega-3 (X1) as “oil,” of LG (X2) as “co-surfactant,” and of GEL (X3) as “surfactant,” were considered as independent variables based on the solubility study of CoQ10. Similarly, the mean droplet size (Y1) and the drug solubilization at 15 min (Y2) were considered as dependent variables. Based on the findings of the solubility study and of the pseudo-ternary phase diagram (), the concentrations of omega-3 (oil; X1), LG (co-surfactant; X2) and GEL (surfactant; X3) were set within the range of 10%−40%, 30%−65% and 15%−60%, respectively. The sum of the concentrations of X1, X2, and X3 were adjusted up to 100%. In order to develop and to evaluate the experiment design, the Design-Expert (version 11) software (Stat-Ease Inc., Minneapolis, MN, USA) was used. Sixteen formulations were obtained from this program. Various polynomial models (linear, quadratic, cubic, and special cubic models) were tested to fit the mean droplet size (Y1) and the drug solubilization at 15 min (Y2), while the suitable mathematical equations were also generated by the software. The most suitable mathematical model was selected based on the comparison of various statistical parameters provided by the analysis of variance (ANOVA), such as the sequential p-value, the lack of fit p-value, the σ-squared, and adequate precision. After using the desirability function, the selected models for each response were utilized in order to predict the desirability results of the optimized independent factors.
Figure 1. Ternary phase diagram of omega-3 (oil), Lauroglycol® 90 (co-surfactant), and Gelucire® 44/14 (surfactant). Light gray and blue areas indicate self-microemulsifying regions; blue areas were considered as an experimental domain.
In vitro evaluation and optimization of the SMEDDS formulation
Droplet size analysis
For the determination of the droplet size, the SMEDDS formulation (100 µL) was diluted to 10 mL of double-distilled water. After gentle stirring the mixture in order to obtain a homogenous dispersion, the microemulsion was transferred into an optical polystyrene cuvette, and a photon correlation spectrometer (Zetasizer Nano ZS; Malvern Instruments, Malvern, UK) was used for the determination of the size of the emulsion droplets (Yeom et al., Citation2015).
Drug solubilization at 15 min (DS15)
From the prepared formulation, 500 µL of the CoQ10-loaded SMEDDS formulation were added to 50 mL of simulated gastric fluid (SGF) at 37 °C, and gently stirred at 75 rpm with a magnetic stirrer for 15 min. Samples (1 mL) were collected and filtered through a 0.45-µm membrane filter. The filtrate was then collected and analyzed by HPLC for the determination of the solubilized CoQ10 content. For the preparation of SGF, 3.0 gm of sodium chloride was dissolved in 1,450 mL of deionized water, and the pH was adjusted to 1.2 with dilute HCl (Pan et al., Citation2015; Visetvichaporn et al., Citation2020).
Effect of dilution on SMEDDS consistency
To investigate the changes in the physical consistency of SMEDDS upon dilution, SMEDDS were prepared with the varying ratio of oil and surfactant mixture (1:1) and diluted with different proportions of water. The physical consistency upon dilution of the SMEDDS was observed visually and characterized as 2 phase system, viscous cream, cream, and stable microemulsion.
In vitro dissolution test
In order to conduct the dissolution test, the USP apparatus II (paddle) method was used by employing a dissolution tester at 37 ± 0.5 °C. The dissolution study was conducted with reference to previously reported papers (Yeom et al., Citation2015; Khattab et al., Citation2017). The revolution speed of the paddle was adjusted to 50 rpm, while the dissolution medium volume was maintained at 900 mL. Phosphate buffer solution (pH 6.8) was used as a dissolution media. At the start of the experiment, an optimized SMEDDS equivalent to 20 mg of CoQ10 was introduced into the dissolution medium. Samples (1 mL) were withdrawn at the predetermined time points (5, 15, 30, 60, 120, 240, 360, and 480 min) and filtered through a 0.45 µm PTFE membrane filter. The amount of dissolved CoQ10 in the filtrate was determined by using HPLC analysis. A similar dissolution study was conducted on CoQ10 in a 0.1% sodium carboxyl methylcellulose suspension, and the latter was considered as a control formulation.
In vivo pharmacokinetic study
Treatment of animals for pharmacokinetic evaluation
Six-week-old (180 − 200 g) male Sprague Dawley (SD) rats were fed with water and were allowed to acclimatize in laboratory conditions for more than three days. Subsequently, healthy rats were selected and used for the in vivo experiment as an animal model. All experiments were conducted according to the guidelines approved by the Institutional Animal Care and Use Committee (BHCC-IACUC-135 2016-04). Doses of CoQ10 (60 mg/kg) were prepared for both the CoQ10 suspension (0.1% sodium CMC) and the optimized SMEDDS formulation, and they were administered via oral gavage, twice a day, at 12-h intervals, for 4 days. Rats were fasted approximately for 10 h prior to blood collection. After the administration of the last dose of CoQ10, blood was collected hourly. During the procedure, animals were anesthetized 10 min prior to the blood collection by an intraperitoneal injection of a mixture of Zoletil® 50 (50 mg/mL) and Rompun® (23.32 mg/mL). Blood samples were collected from the tail vein at 0, 1, 4, 8, 12, and 24 h after the last CoQ10 dose; blood was collected in a heparinized tube by using a syringe. To study the effect of SMEDDS on CoQ10 distribution characteristics in the brain tissue, a comparison was made between the optimized SMEDDS formulation and the CoQ10 suspension. The brain distribution study was conducted on the different sets of male SD rats and divided into two groups: CoQ10 suspension and optimized SMEDDS formulation group. Both groups were subdivided into two subgroups (n = 5): 4 h and 8 h group. Brain tissues were collected at 4 h and 8 h after the last dose of CoQ10 administration and extent of CoQ10 distribution in brain was analyzed.
Extraction of CoQ10 from the rat plasma
For the preparation of the calibration curve, 20 µL of the standard CoQ10 solution (CoQ10 in hexane) was added to 200 µL of drug-free plasma samples, vortexed, and collected in a glass tube. Subsequently, 1 mL of 1-propanol was added to the solution and the latter was vortexed for 5 min, and then centrifuged at 3,000 × g for 5 min, for the precipitation of proteins. A rotary centrifugal vacuum evaporator was used in order to collect the supernatant and evaporate it. The residue was redistributed in 100 µL of 1-propanol, and analyzed by using HPLC (as described in the solubility study). After the last scheduled oral administration of the CoQ10 suspension and the CoQ10-loaded optimized SMEDDS to rats, 400 µL of blood samples were collected from the tail vein of each rat at 0, 1, 4, 8, 12, and 24 h. The collected blood samples were then centrifuged at 3,000 × g, for 15 min, at 4 °C, in order to prepare plasma samples, and these plasma samples were then stored at −70 °C until further analysis.
Extraction of CoQ10 from the rat brain tissue
Rats brains were collected by opening the skull after cervical dislocation at 4 h and 8 h after the last CoQ10 dose. After weighing, brain tissues were stored at −20 °C until the undertaking of the extraction experiment. Subsequently, 1 mL of distilled water was added to the brain tissue and homogenization was performed by using a homogenizer. After adding 900 μL of tetrahydrofuran to 100 μL of brain tissue homogenate of each experimental group sample, vortex-mixing was performed for 5 min, and centrifugation took place at 4 °C and 13,000 rpm, for 10 min, in order to precipitate the protein. The supernatant was then transferred to a new tube, diluted 10-fold, filtered, and analyzed by using liquid chromatography with tandem mass spectrometry (LC-MS/MS; Agilent 6410 Triple quad, Agilent Technologies, California, USA).
Determination of CoQ10 in the rat plasma samples and brains by LC-MS/MS
In this paper we developed and validated LC-MS/MS method, based on a liquid-liquid extraction procedure. The method was optimized using beta-carotene as internal standard. LC-MS/MS was used for the CoQ10 analysis in the obtained rat blood plasma samples and brain homogenates. A 4.6 × 250 mm (5 µm particle size) Agilent Technologies Eclipse XDB-C18 column was used. The column temperature was maintained at 35 °C, while the flow rate was set at 1.0 mL/min. The analysis wavelength was adjusted at 274 nm (UV) and the sample injection volume was 20 µL. Isocratic mobile phase containing acetonitrile and tetrahydrofuran (65:35, [v/v]) was used, and the retention time obtained was in the range of 6.2 − 6.4 min.
Calculation of pharmacokinetic parameters of CoQ10
The plasma drug concentration, peak plasma drug concentration (Cmax), and the time to reach the peak plasma concentration (Tmax), were obtained directly from the blood concentration versus time profile. The area under the curve (AUC) was calculated by using a trapezoidal rule.
In vivo imaging of cyanine 5.5 loaded suspension and SMEDDS
To visually conform the brain distribution characteristics of CoQ10, SD rats were divided in two groups, a cyanine 5.5 SMEDDS group and a cyanine 5.5 suspension group. Two hundred µL of cyanine 5.5 loaded SMEDDS and suspension at a dose equivalent to 0.2 mg/kg were delivered to the rats orally. Optical imaging was performed using a VISQUE Invivo ART100 imaging system (Anyang, South Korea). Finally, near-infrared fluorescence (NIR) images were obtained with a cyanine 5.5 filter channel.
Statistical analysis
Statistical analysis was performed by using Sidak multiple comparison tests (p < 0.05). Pharmacokinetic data were expressed as the mean ± standard deviation (SD).
Results
Solubility of CoQ10 in selected excipients; selection of oil, co-surfactant and surfactant
During the formulation of nano-dispersion systems like SMEDDS, the solubilization of the active components is very important. Therefore, components exhibiting greater solubility for CoQ10 should be selected. The solubility of CoQ10 in various excipients is summarized in . Omega-3 exhibited a significantly higher solubility for CoQ10 (362.87 ± 6.9 mg/mL) than other oils (17.83 − 288.99 mg/mL). On the other hand, LG exhibited maximum solubility of CoQ10 (67.89 ± 10.47 mg/mL) as compared to other co-surfactants. Similarly, GEL demonstrated the maximum solubility of 0.2587 ± 0.035 mg/mg as compared to other surfactants.
Table 1. Solubility of coenzyme Q10 in various excipients.
Construction of the pseudo-ternary phase diagram
After the selection of oil (omega-3), co-surfactant (LG), and surfactant (GEL) based on the CoQ10 solubility study (), a ternary phase diagram was constructed in the drug-free condition in order to determine the appropriate ratio of components for the SMEDDS formulation. As shown in , each component was marked as 100% at the apex of the diagram. The colored area (blue and light gray) represents the microemusification region (grade I and grade II). In particular, the stable SMEDDS region (grade I) was designated with a blue area () with the highest self-emulsifying capacity. The boundary ranges of 10%−40% for omega-3, 30%−65% for LG, and 15%−60% for GEL, were considered as the testing ranges for the experimental study ().
Table 2. Variables and responses used in the D-optimal mixture design.
Statistical analysis by using the D-optimal mixture design
For the optimization of the CoQ10-loaded SMEDDS formulation, a D-optimal mixture design was applied by using the Design-Expert software. The concentrations of oil (X1), co-surfactant (X2), and surfactant (X3) were considered as critical factors for the formulation of the SMEDDS, and have been previously reported to influence the in vitro dispersion of the SMEDDS formulation. Therefore, these concentrations were considered as independent variables (Kamboj and Rana, Citation2016). On the other hand, the mean droplet size (Y1) and DS15 (Y2) were selected as response variables. The range of the independent variables and the goals of the response variables in this D-optimal mixture design are presented in . A total of 16 experimental runs were assessed as shown in . Y1 ranged from 195.4 to 386 nm, while Y2 ranged from 5.12% to 15.96%. The responses were fitted to the linear, quadratic, special cubic, and cubic models. summarizes the statistics for the four models. A sequential p-value of <0.05 indicates that the model terms are significant. Moreover, a lack of fit p-value of greater than 0.1 indicates the adequacy of the model fit. Similarly, the predicted residual error sum of square (PRESS) assesses how well a model fits the data: the lower the value, the better the model’s prediction abilities. The variation in the response variable of all independent variables in a given model is represented by R2: the higher values of R2 indicate that the model explains all the variability of the response variable. Based upon the p-value, the lack of fit p-value, PRESS, and R2, the linear and the cubic models were considered to be the best-fitted models for Y1 and Y2, respectively. Hence, the linear and the cubic models were selected to fit Y1 and Y2, respectively, for the undertaking of further optimization.
Table 3. Composition and observed responses from randomized runs in the D-optimal mixture design (n = 3).
Table 4. Summary of the results of statistical analysis and model equations for the measured responses.
Effect of an independent variable on the responses recorded by the experimental design
The overall results of the ANOVAs for the two response variables are presented in . For Y1, the F-test for the linear effect parameters revealed a significant difference (F (2,13) = 6.17, p < 0.01), thereby suggesting that at least one regression coefficient for the linear parameters is significantly different from zero. The statistical significance for Y2 was F (2,6) = 61.10, p < 0.0001, thereby indicating that at least one independent variable resulted in a significant effect on Y2. The remaining polynomial effect parameters were also found to be statistically significant. As shown in , the p-values of both the linear and the cubic effect parameters were <0.05; thereby indicating that they were statistically significant within the model.
Table 5. Analysis of variance of a linear and cubic model of the measured response.
Effect of an independent variable on mean droplet size
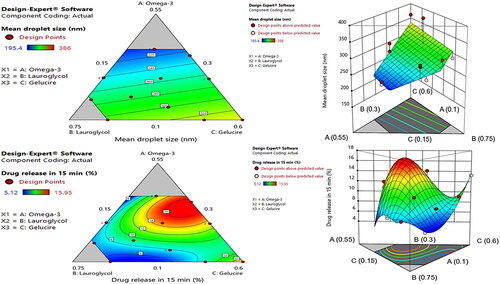
The emulsion droplet size in the gastrointestinal (GI) tract is a primary concern in the case of oil-based formulations, because the oil droplet size not only has a direct impact on the in vitro study (stability and release kinetics), but it also has a positive effect on the drug’s bioavailability (Cherniakov et al., Citation2015). Therefore, the SMEDDS was optimized in order to have a minimum droplet size (Y1) value. As shown in , formulations #16 and #2 demonstrated the highest (362.7 nm) and the lowest (195.4 nm) values, respectively. The data were statistically fitted well to the linear model (), and the following polynomial equation was obtained in order to validate the relationship between the independent variables and the mean droplet size (Y1):
The magnitude of the coefficient of the three independent variables indicating the influence of response was in the order of X3 > X2 > X1. The positive value of all coefficients indicates that the mean droplet size increases with the increase in oil, co-surfactant, and surfactant levels. In general, due to the surface tension lowering property resulting in the reduction of surface free energy in the oil-water interface by surfactants, the reduction of the emulsion droplet size is expected along with the increase in surfactant concentration (Buya et al., Citation2020). However, the highest magnitude and positive coefficient of X3 indicate that the amount of GEL was a critical factor in having a positive effect on Y1. The increase in particle size with the increment of the GEL and LG might be due to the higher penetration of water in the lipid droplet resulting in the disruption of the oil-water interface, and the relaxation of the oil droplets (Zupančič et al., Citation2016). The mean droplet size of the SMEDDS is predominantly increased with the increase of the GEL level. The results were also consistent with the contour and the three-dimensional response surface plots of the mean droplet size ().
Figure 2. Contour and three-dimensional response surface plots of (a) mean droplet size, and (b) drug solubilization at 15 min.
Effect of the independent variable in drug solubilization
Drug solubilization is directly associated with the extent of drug absorption and, eventually, increases drug bioavailability. Since the solubilization study was conducted after 15 min of dispersion of SMEDDS, SGF was used as a study medium to mimic the in vivo model. The formulations were optimized in order to achieve maximum DS15 (Y2). As depicted in , formulations #8 and #14 demonstrated the highest (15.95%) and the lowest (5.12%) values, respectively. The data were statistically fitted to the cubic model (), and the following polynomial equation was obtained from the program, based on the results of the ANOVA to validate the relationship between the independent variables and DS15 (Y2):
The magnitude of the coefficient of the three independent variables indicating the influence of response was in the order of X1 > X3 > X2. The negative value of the coefficient of X1 indicates that the DS15 decreases with the increase in the level of oil (omega-3). However, the positive values of the coefficients of X2 and X3 indicate an increment in DS15 with the increase in LG and GEL levels. A higher value of the coefficient of X3 suggests a more pronounced increase in DS15 along with the increment in GEL level, as compared to the LG level. Similar results were depicted by the contour and the three-dimensional response surface plots ().
Optimization of SMEDDS formulation by desirability function
The desirability function of the Design-Expert program was used for the optimization of all the responses in which the Y1 was set to minimize, while the Y2 was set to maximize (). The optimization was carried out for Y1 and Y2 after obtaining the polynomial equations for the correlation between the responses and the examined independent variables. shows the overlay plot generated by the software for the effect of different variables on the two responses. The program suggested the independent variables of 38.55% of omega-3 (X1; oil), 31.42% of LG (X2; co-surfactant), and 30% of GEL (X3; surfactant), as the optimized formulation with a desirability value of 0.931. In an attempt to validate the D-optimal design model, the optimized SMEDDS was prepared, and the comparison was made between the experimentally-measured response value and the predicted value (). The percentage prediction error for Y1 and Y2 were 7.0538 and 0.312, respectively, thereby suggesting a successful optimization of the SMEDDS formulation by the D-optimal design. Moreover, the final composition comprising omega-3 (38.55%), LG (31.42%) and GEL (30%) will have the final surfactant system HLB value of 8.37, which is similar to the HLB value of sacha inchi oil (HLB = 8.5) that predominantly comprises of omega-3 (44.11%) (Saengsorn and Jimtaisong, Citation2017). Therefore, according to the HLB theory higher stability of the formulation and higher solubility of CoQ10 was also predicted. The droplet size of the optimized SMEDDS was 237.6 ± 5.8 nm, with a PDI value of 0.190; thereby indicating a homogenous size distribution of the formulation.
Figure 3. Overlay plot for the effect of different variables. Values in contour lines represent desirability, while values in the box represent the percentages of the three examined components and the predicted responses for the optimized SMEDDS.
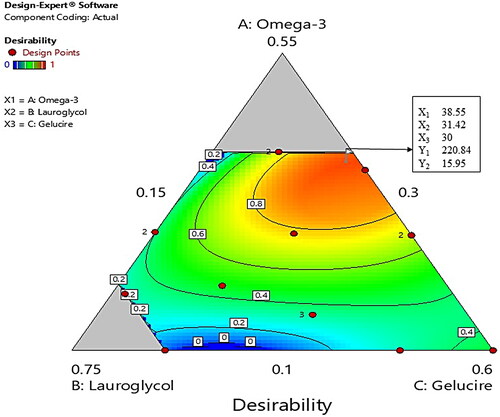
Table 6. Experimental and predicted values for the optimized SMEDDS.
Effect of dilution on SMEDDS consistency
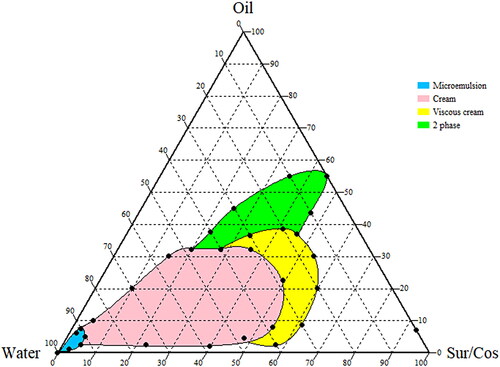
During the study, we prepared the SMEDDS preconcentrate with different proportion of oil and surfactant mixture and observed the change in its physical consistency upon dilution with the different proportion of water phase. We observed that, at lower water phase the preconcentrate had 2-phase-like consistency and upon dilution, a viscous cream and cream-like consistency was observed. A stable microemulsion phase was observed only after the adequate dilution with water. In case of the optimized formulation, similar changes in physical consistency were predicted. Preliminary dilution of the optimized formulation resulted in the generation of a 2-phase system as depicted in . The cream-like consistency appeared after dilution of the optimized SMEDDS with an equal proportion of water, and the stable microemulsion was able to form only after dilution of the optimized SMEDDS with a nearly 10-fold water phase.
Figure 4. Ternary phase diagram of omega-3 (oil), surfactant to co-surfactant ratio (Sur/Cos), and water. Blue areas indicate microemulsion.
In vitro dissolution study
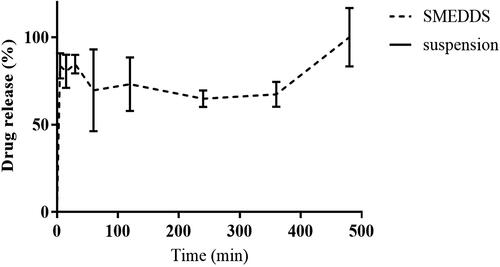
The result of the in vitro dissolution of the optimized SMEDDS and the CoQ10 suspension is presented in . CoQ10 is a water-insoluble drug and was not released from the CoQ10 suspension throughout the experimental period (up to 8 h). However, more than 80% of the CoQ10 underwent dissolution in the case of the optimized SMEDDS formulation within the first 5 min. The drug release from SMEDDS was almost complete at 8 h.
Figure 5. In vitro drug dissolution profile of the optimized SMEDDS and the CoQ10 suspension (control), in a 6.8 pH buffer, for 8 h.
In vivo pharmacokinetics of CoQ10 in rats
The primary concern of this study was to increase the drug’s oral bioavailability, for which the relative bioavailability of the optimized CoQ10 SMEDDS was evaluated with respect to that of the CoQ10 suspension. The study suggested a higher CoQ10 blood concentration as a result of the CoQ10 SMEDDS administration (in comparison to the CoQ10 suspension; ). The pharmacokinetic parameters (such as Cmax and AUC) were calculated from the plasma profile of CoQ10 as presented in and results are depicted in . The SMEDDS had a significantly higher AUC (17.42 ± 2.3 µg.h/mL) and Cmax (1.54 ± 0.62 µg/mL) and in fact, the AUC and Cmax values of the SMEDDS were more than four times higher than those of the CoQ10 suspension (AUC: 3.8 ± 1.3 µg.h/mL; Cmax: 0.37 ± 0.09 µg/mL). The relative bioavailability of SMEDDS was 4.6-fold higher than CoQ10 suspension. On the other hand, the CoQ10 SMEDDS formulation appeared late in terms of the Tmax (8.0 ± 0.32 h), when compared the CoQ10 suspension (4.0 ± 0.1 h).
Figure 6. Coenzyme Q10 (CoQ10) plasma profiles after the administration of CoQ10 SMEDDS and CoQ10 suspension formulations in rats. Each value represents the mean ± SD of six measurements (n = 6); *, p < 0.05.
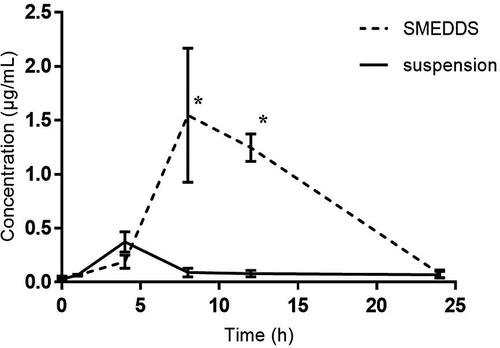
Table 7. Pharmacokinetic parameters of CoQ10 after oral administration of CoQ10 suspension and optimized CoQ10 SMEDDS formulation at an equivalent dose of 60 mg/kg of CoQ10 in rats.
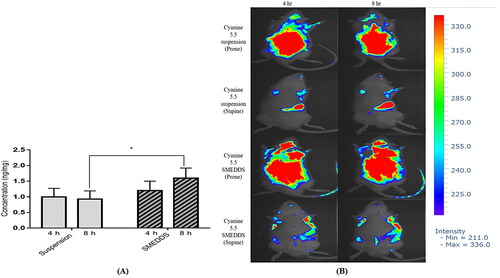
The study of the brain tissue distribution characteristics of CoQ10 suggests a significant delivery of CoQ10 at the 8th h (1.60 ± 0.32 ng/mL) in the CoQ10 SMEDDS formulation as compared to that of the 4th h (1.20 ± 0.30 ng/mL) (). However, the CoQ10 brain tissue distribution was lower at the 4th h in the CoQ10 suspension (1.00 ± 0.27 ng/mL) and did not change substantially in 8th h (0.93 ± 0.26 ng/mL). The findings of the brain tissue distribution characteristics of CoQ10 were further compared to the in vivo imaging study which suggests the higher uptake of cyanine 5.5 in SMEDDS comparative to suspension both in 4 hr and 8 hr ().
Figure 7. Brain coenzyme Q10 (CoQ10) deposition profiles of (A) rats administered with a CoQ10 suspension formulation, and CoQ10 SMEDDS formulation. Each value represents the mean ± SD (n = 5); *, p < 0.001. (B) in vivo fluorescence imaging of SD rats in prone and supine position at 4 hr and 8 hr after oral delivery of Cy 5.5 suspension and Cy 5.5 loaded SMEDDS.
Discussion
The solubility of CoQ10 in the oil component is important to solubilize the hydrophobic drugs. Therefore, omega-3 was selected as an oil phase during the development of the herein tested SMEDDS formulation, based upon the maximum solubility of CoQ10 that could improve both the drug loading and the drug absorption capacity (Buya et al., Citation2020). However, during the selection process for a suitable co-surfactant and surfactant, the HLB values should also be considered along with solubility. Due to the higher micelle-forming ability, water-soluble surfactants with HLB values greater than 12 are generally preferred for use in a SMEDDS formulation (Dokania and Joshi, Citation2015). However, surfactants with an HLB value lower than 10 play a vital role in the reduction of the interfacial tension of films formed by emulsion droplets and improve film flexibility. Therefore, a blend of low- and high-HLB surfactants can be utilized in order to improve the stability of the formulation. Omega-3 was selected as an oil, based on its CoQ10 solubility, whereas LG (HLB = 3) and GEL (HLB = 14) were selected as a co-surfactant and surfactant, respectively, based on their CoQ10 solubility and their corresponding HLB values. LG (LD50, 2.003 g/kg/day) and GEL (LD50, 20 g/kg) were used as a co-surfactant and surfactant, within generally recognized as safe limits (Veeravalli et al., Citation2020). The combination of omega-3 as an oil, LG as a co-surfactant, and GEL as a surfactant, was further evaluated by employing a pseudo-ternary phase diagram. However, since the concentrations of the oil and the surfactant affect the emulsification time, it is also important to maintain the concentrations of the surfactants and co-surfactant to an optimum limit. With the increase in the surfactant and co-surfactant concentrations roughly above 60% (w/w), there is a possibility of an increase in the emulsification time due to the high viscosity of the surfactants (Buya et al., Citation2020); the latter could delay the drug release onset of action (Czajkowska-Kośnik et al., Citation2015). Somehow, the surfactant and co-surfactant concentrations of the optimized SMEDDS in this study roughly fall within the acceptable limits, where, the appropriate concentration for omega-3, LG and GEL was successfully estimated by using D-optimal mixture design.
In vitro drug dissolution study suggests complete drug release from optimized SMEDDS. Whereas, there was no drug release from CoQ10 suspension throughout the study period. SMEDDS is a lipid-based formulation that when in contact with GI fluids, it forms an oil-in-water type emulsion that spontaneously dissolute lipophilic drugs such as CoQ10. However, the generation of the microemulsion from the SMEDDS also depends upon the water level in the dissolution medium. As discussed previously, at the lower water content, the optimized SMEDDS exhibited viscous cream and cream-like properties, but the increased water penetration into the oil droplet (when in contact with the higher water level of the GI fluid) triggered the self-emulsification of the oils, thereby preventing the coalescence through the mechanical barrier, and consequently forming a stable microemulsion (Rani et al., Citation2019). The fine droplets of the microemulsion (containing solubilized drug) exhibit a greater effective surface area of exposure and, hence, exert a higher drug dissolution. Therefore, our results suggest that the optimized CoQ10 SMEDDS formulation might increase the effective surface area by generating nano-sized emulsion droplets, thereby, increasing the solubilization and dissolution of CoQ10.
The low aqueous solubility and oral bioavailability are major challenges for the delivery of Biopharmaceutical Classification System (BCS) class II drugs like CoQ10 (Papich and Martinez, Citation2015). The poor aqueous solubility alone is not a major hurdle for the limited oral bioavailability of BCS class II drugs. Intestinal metabolism, phase I first-pass metabolism, as well as the effect of the efflux transport by P-gp can also significantly limit the oral bioavailability of the BCS class II drugs (Benet, Citation2010; Cherniakov et al., Citation2015). These reports were further confirmed by a similar study conducted by Wu et al where cyclosporine A, a potent P-gp and CYP3A substrate with better permeability (86% absorbed) when solubilized with corn oil, exhibited limited oral bioavailability due to a significant (60%) intra-enterocyte first-pass extraction and P-gp-mediated efflux (Wu et al., Citation1995). Therefore, it is important to improve the aqueous solubilization of the drug, minimize or bypass the potential phase I first-pass metabolism, and to diminish the P-gp efflux for the improvement of the oral bioavailability. The higher pharmacokinetic parameters like AUC and Cmax in the SMEDDS formulation might be due to the presence of long-chain triglycerides like omega-3, LG, and GEL that eventually break down into diglyceride, monoglyceride, and fatty acids in the presence of gastric and pancreatic lipases (Singh et al., Citation2009). These lipid digestion products trigger the secretion of endogenous biliary lipids from the gallbladder, along with bile salts, cholesterol, and phospholipids. These secretions enhance the solubilization and the absorption of drugs through the formation of mixed micellar structures and micelles, in which the polar head group of the micelles projects into the aqueous phase and the non-polar hydrocarbon tail group protrudes the center (Kollipara and Gandhi, Citation2014; Cherniakov et al., Citation2015). The mixed micellar phase expands the solubilization capacity of the small intestine. The higher AUC and Cmax of the herein optimized SMEDDS could also be attributed to the presence of GEL, which is a well-known P-gp inhibitor that can diminish the P-gp efflux of CoQ10 [Shin et al., 2019). Similar results were observed in a previous study conducted by Zhang et al in which the Cmax and the AUC of digoxin (a well-known P-gp substrate) increased when orally administered with Tween® 80; a potent P-gp inhibitor (Zhang et al., Citation2003).
The other possible reason for the observed increased Cmax and AUC values of the CoQ10 SMEDDS formulation might be due to its ability to circumvent the phase I hepatic metabolism. The intestinal lymphatic absorption system, which is a physiological pathway for the absorption of dietary lipid digestion products (like long-chain fatty acids), might be the most likely mechanism for the systemic absorption of the CoQ10 SMEDDS as well. Within the intestinal cells, the long-chain fatty acids (such as omega-3, LG, and GEL) and their monoglycerides might be re-esterified into triglyceride in the endoplasmic reticulum, thereby eventually being incorporated into chylomicrons. The latter are the largest lipoproteins that cannot enter blood capillaries due to the tight intercellular junction; instead, chylomicrons enter the leakier and more permeable lymphatic capillaries situated in the villi of the enterocyte (Porter et al., Citation2007; Cherniakov et al., Citation2015). The lymphatic capillaries ultimately reunite with the blood, after bypassing the hepatic portal route at the junction of the left jugular and the left subclavian veins, consequently contributing to the increased Cmax and AUC values of the SMEDDS formulation (O’Driscoll, Citation2002). On the other hand, the low AUC and Cmax of the CoQ10 suspension (as compared to that of the SMEDDS) might be due to the poor aqueous solubility of CoQ10 and interaction with the multi-drug efflux pump P-gp located in the intestinal epithelial cells, thereby pumping the compound back into the intestinal lumen (Itagaki et al., Citation2008; Davis et al., Citation2017).
As stated previously, the lymphatic delivery requires the drug to be incorporated into chylomicrons within the enterocytes. However, the rate of the drug entry into lymph (and, finally, in the blood) is directly correlated with the rate of appearance of the chylomicrons and the triglycerides into the these fluids (Brocks and Davies, Citation2018). This effect contributes to the establishment of the lag time (up to 3 h) after the ingestion of lipids and until their passage into the lymph and/or the blood. The effect is observed in humans, rats, and sheep (Brocks and Davies, Citation2018), and it might be responsible for the observed prolonged Tmax values in SMEDDS (8 h) compared to CoQ10 suspension (4 h). Similar findings were reported by Brocks and Davis in 2018, in which they studied the effect of the lymphatic absorption and lag time on pharmacokinetic parameters such as Cmax and Tmax under different hepatic extraction ratio (HER) values (Brocks and Davies, Citation2018). In lower HER values (0.1), they observed a drop of the Cmax value, while Tmax increased upon an increase of the fraction of lymphatic absorption. In higher HER values, the same authors observed a drastic increase in Cmax along with the increment of the Tmax value, thereby suggesting that the lymphatic absorption not only improves the Cmax value of drugs undergoing an extensive first-pass hepatic metabolism, but it also results in the increment of the Tmax. Moreover, they also concluded that the lag time contributes to the increment of Tmax in all HER values. Similar findings were observed in a study conducted by Nadhamuni et al in which they correlated the critical effects of the lag time on pharmacokinetic parameters such as ka, AUC, and Tmax (Nerella et al., Citation1993).
Additionally, in vivo imaging and brain distribution study suggests the highest CoQ10 brain distribution in the optimized CoQ10 SMEDDS formulation in 8 h, which could be attributed to the role of GEL as a potential P-gp efflux inhibitor, thereby resulting in a decrease in the P-gp-mediated efflux of CoQ10, and in an increase of the brain distribution level of the latter (Shin et al., Citation2019). Moreover, smaller droplet size of SMEDDS and their lipidic nature also may have contributed the permeation of CoQ10 across the blood brain barrier (BBB) (Shah, Citation2021). The finding of the brain distribution study hints the potential role of lipid-based formulations like SMEDDS for the successful delivery of drugs like CoQ10 for the treatment of various neurological diseases like Alzheimer’s and Huntington’s disease.
Conclusion
A CoQ10-loaded SMEDDS was successfully formulated and optimized by a response surface methodology based on a D-optimal mixture design. The optimized CoQ10-loaded SMEDDS formulation containing 38.55% omega-3 (oil; X1), 31.42% LG (co-surfactant; X2), and 30% GEL (surfactant; X3) exhibited enhanced in vitro dissolution, superior in vivo oral bioavailability, and better brain distribution when compared to a CoQ10-loaded suspension. The predicted model and the experimental values of the mean droplet size (Y1) and the DS15 (Y2) were in agreement. Thus, for the successful optimization of the SMEDDS, the use of a statistical experimental design could be considered as a useful tool. Our study provides evidence that an optimized SMEDDS could be used as a delivery vehicle for the enhancement of the oral bioavailability of poorly soluble drugs such as CoQ10.
Disclosure statement
The author reports no conflicts of interest in this work.
Additional information
Funding
References
- Abdel-Hamid S, Betz G. (2012). A novel tool for the prediction of tablet sticking during high speed compaction. Pharm Dev Technol 17:747–54.
- Alehagen U, Alexander J, Aaseth J. (2016). Supplementation with selenium and coenzyme Q10 reduces cardiovascular mortality in elderly with low selenium status. A secondary analysis of a randomised clinical trial. PLoS One 11(7):1–16.
- Arenas-Jal M, Sune-Negre JM, Garcia-Montoya E. (2020). Coenzyme Q10 supplementation: Efficacy, safety, and formulation challenges. Compr Rev Food Sci Food Saf 19:574–94.
- Benet LZ. (2010). Predicting drug disposition via application of a biopharmaceutics drug disposition classification system. Basic Clin Pharmacol Toxicol 106:162–7.
- Brocks DR, Davies NM. (2018). Lymphatic drug absorption via the enterocytes: pharmacokinetic simulation, modeling, and considerations for optimal drug development. J Pharm Pharm Sci 21:254s–70s.
- Buya AB, Beloqui A, Memvanga PB, et al. (2020). Self-nano-emulsifying drug-delivery systems: from the development to the current applications and challenges in oral drug delivery. Pharmaceutics 12:1194.
- Cherniakov I, Domb AJ, Hoffman A. (2015). Self-nano-emulsifying drug delivery systems: an update of the biopharmaceutical aspects. Expert Opin Drug Deliv 12:1121–33.
- Czajkowska-Kośnik A, Szekalska M, Amelian A, et al. (2015). Development and evaluation of liquid and solid self-emulsifying drug delivery systems for atorvastatin. Molecules 20:21010–22.
- Davis BM, Tian K, Pahlitzsch M, et al. (2017). Topical coenzyme Q10 demonstrates mitochondrial-mediated neuroprotection in a rodent model of ocular hypertension. Mitochondrion 36:114–23.
- Dhanasekaran M, Ren J. (2005). The emerging role of coenzyme Q-10 in aging, neurodegeneration, cardiovascular disease, cancer and diabetes mellitus. Curr Neurovasc Res 2:447–59.
- Diaz-Casado ME, et al. (2019). The paradox of coenzyme Q10 in aging. Nutrients 11:1–33.
- Dokania S, Joshi AK. (2015). Self-microemulsifying drug delivery system (SMEDDS)–challenges and road ahead. Drug Deliv 22:675–90.
- Fan L, Feng Y, Chen G-C, et al. (2017). Effects of coenzyme Q10 supplementation on inflammatory markers: a systematic review and meta-analysis of randomized controlled trials. Pharmacol Res 119:128–36.
- Fir MM, Smidovnik A, Milivojevic L, et al. (2009). Studies of CoQ10 and cyclodextrin complexes: solubility, thermo- and photo-stability. J Incl Phenom Macrocycl Chem 64:225–32.
- Fuller B, Smith D, Howerton A, et al. (2006). Anti-inflammatory effects of CoQ10 and colorless carotenoids. J Cosmet Dermatol 5:30–8.
- Garg T, Rath G, Goyal AK. (2015). Colloidal drug delivery systems: current status and future directions. Crit Rev Ther Drug Carrier Syst 32:89–147.
- Hernandez-Camacho JD, et al. (2018). Coenzyme Q10 supplementation in aging and disease. Front Physiol 9:44.
- Hidaka T, Fujii K, Funahashi I, et al. (2008). Safety assessment of coenzyme Q10 (CoQ10). Biofactors 32:199–208.,
- Itagaki S, Ochiai A, Kobayashi M, et al. (2008). Interaction of coenzyme Q10 with the intestinal drug transporter P-glycoprotein. J Agric Food Chem 56:6923–7.
- Johal HS, Garg T, Rath G, et al. (2016). Advanced topical drug delivery system for the management of vaginal candidiasis. Drug Deliv 23:550–63.
- Joshi D, Garg T, Goyal AK, et al. (2016). Advanced drug delivery approaches against periodontitis. Drug Deliv 23:363–77.
- Kamboj S, Rana V. (2016). Quality-by-design based development of a self-microemulsifying drug delivery system to reduce the effect of food on Nelfinavir mesylate. Int J Pharm 501:311–25.
- Karun Kataria AS, T, GargAmit K, Goyal, et al. (2014). Novel technology to improve drug loading in polymeric nanofibers. Drug Delivery Letters 4:7.
- Khattab A, Hassanin L, Zaki N. (2017). Self-nanoemulsifying drug delivery system of coenzyme (Q10) with improved dissolution, bioavailability, and protective efficiency on liver fibrosis. AAPS PharmSciTech 18:1657–72.
- Kollipara S, Gandhi RK. (2014). Pharmacokinetic aspects and in vitro-in vivo correlation potential for lipid-based formulations. Acta Pharm Sin B 4:333–49.
- Kumar D, Jacob D, PS S, et al. (2016). Enhanced bioavailability and relative distribution of free (unconjugated) curcuminoids following the oral administration of a food-grade formulation with fenugreek dietary fibre: A randomised double-blind crossover study. J Funct Foods 22:578–87.
- Laredj LN, Licitra F, Puccio HM. (2014). The molecular genetics of coenzyme Q biosynthesis in health and disease. Biochimie 100:78–87.
- Lopez-Lluch G, et al. (2010). Is coenzyme Q a key factor in aging? Mech Ageing Dev 131:225–35.
- Miles MV. (2007). The uptake and distribution of coenzyme Q10. Mitochondrion 7 Suppl:S72–S7.
- Mortensen SA, Rosenfeldt F, Kumar A, Q-SYMBIO Study Investigators, et al. (2014). The effect of coenzyme Q10 on morbidity and mortality in chronic heart failure: results from Q-SYMBIO: a randomized double-blind trial. JACC Heart Fail 2:641–9.
- Nakamura S, Otsuka N, Yoshino Y, et al. (2016). Predicting the occurrence of sticking during tablet production by shear testing of a pharmaceutical powder. Chem Pharm Bull (Tokyo) 64:512–6.
- Nerella NG, Block LH, Noonan PK. (1993). The impact of lag time on the estimation of pharmacokinetic parameters. I. One-compartment open model. Pharm Res 10:1031–6.
- Noh G, Keum T, Bashyal S, et al. (2022). Recent progress in hydrophobic ion-pairing and lipid-based drug delivery systems for enhanced oral delivery of biopharmaceuticals. J Pharm Investig 52:75–93.
- O’Driscoll CM. (2002). Lipid-based formulations for intestinal lymphatic delivery. Eur J Pharm Sci 15:405–15.
- Pan X-M, Li J, Gan R, et al. (2015). Preparation and in vitro evaluation of enteric-coated tablets of rosiglitazone sodium. Saudi Pharm J 23:581–6.
- Papich MG, Martinez MN. (2015). Applying biopharmaceutical classification system (BCS) criteria to predict oral absorption of drugs in dogs: challenges and pitfalls. Aaps J 17:948–64.
- Porter CJ, Trevaskis NL, Charman WN. (2007). Lipids and lipid-based formulations: optimizing the oral delivery of lipophilic drugs. Nat Rev Drug Discov 6:231–48.
- Potgieter M, Pretorius E, Pepper MS. (2013). Primary and secondary coenzyme Q10 deficiency: the role of therapeutic supplementation. Nutr Rev 71:180–8.
- Rani S, Rana R, Saraogi GK, et al. (2019). Self-emulsifying oral lipid drug delivery systems: advances and challenges. AAPS PharmSciTech 20:129.
- Saengsorn K, Jimtaisong A. (2017). Determination of hydrophilic–lipophilic balance value and emulsion properties of sacha inchi oil. Asian Pacific Journal of Tropical Biomedicine 7:1092–6.
- Shah B. (2021). Microemulsion as a promising carrier for nose to brain delivery: journey since last decade. J Pharm Investig 51:611–34.
- Shin D, Chae B, Goo Y, et al. (2019). Improved dissolution and oral bioavailability of valsartan using a solidified supersaturable self-microemulsifying drug delivery system containing Gelucire(®) 44/14. Pharmaceutics 11:58.
- Singh B, Bandopadhyay S, Kapil R, et al. (2009). Self-emulsifying drug delivery systems (SEDDS): formulation development, characterization, and applications. Crit Rev Ther Drug Carrier Syst 26:427–521.
- Sweed NM, Fayez AM, El-Emam SZ, et al. (2021). Response surface optimization of self nano-emulsifying drug delivery system of rosuvastatin calcium for hepatocellular carcinoma. J Pharm Investig 51:85–101.
- Tran P, Park J-S. (2021). Recent trends of self-emulsifying drug delivery system for enhancing the oral bioavailability of poorly water-soluble drugs. J Pharm Investig 51:439–63.
- Veeravalli V, Cheruvu HS, Srivastava P, Vamsi Madgula LM. (2020). Three-dimensional aspects of formulation excipients in drug discovery: a critical assessment on orphan excipients, matrix effects and drug interactions. J Pharm Anal 10:522–31.
- Visetvichaporn V, Kim K-H, Jung K, et al. (2020). Formulation of self-microemulsifying drug delivery system (SMEDDS) by D-optimal mixture design to enhance the oral bioavailability of a new cathepsin K inhibitor (HL235). Int J Pharm 573:118772.
- Wu CY, Benet LZ, Hebert MF, et al. (1995). Differentiation of absorption and first-pass gut and hepatic metabolism in humans: studies with cyclosporine. Clin Pharmacol Ther 58:492–7.
- Xia S, Xu S, Zhang X. (2006). Optimization in the preparation of coenzyme Q10 nanoliposomes. J Agric Food Chem 54:6358–66.
- Yeom DW, Song YS, Kim SR, et al. (2015). Development and optimization of a self-microemulsifying drug delivery system for atorvastatin calcium by using D-optimal mixture design. Int J Nanomedicine 10:3865–77.
- Yue Y, Zhou H, Liu G, et al. (2010). The advantages of a novel CoQ10 delivery system in skin photo-protection. Int J Pharm 392:57–63.
- Zhang H, Yao M, Morrison RA, et al. (2003). Commonly used surfactant, Tween 80, improves absorption of P-glycoprotein substrate, digoxin, in rats. Arch Pharm Res 26:768–72.
- Zupančič O, Grieβinger JA, Rohrer J, et al. (2016). Development, in vitro and in vivo evaluation of a self-emulsifying drug delivery system (SEDDS) for oral enoxaparin administration. Eur J Pharm Biopharm 109:113–21.