Abstract
Kinetics of color changes of aonla (Emblica officinalis) shreds were investigated using objective colorimetric measurements during drying with different blanching treatments. Kinetic parameters chroma, hue, total color difference, and browning index for the color change were determined using Hunter L, a, b values. The drying process changed all three color parameters (L, a, b), causing a color shift towards the darker region. Parameters L and b decreased and a-value increased during drying. The reaction associated with color change followed zero-order reaction kinetics. The minimum change was observed in the KMS (potassium metabisulphite) blanched shreds.
Keywords:
INTRODUCTION
The Aonla (Emblica officinalis), known as Indian gooseberry, is an important fruit crop of tropical and subtropical regions of India. It is grown all over Asia for its nutritional, pharmacological, and commercial significance. In recent years, the processing and value addition of aonla has increased many fold due to an increase in area and production. Aonla has acquired wide popularity all over the world for its medicinal properties. It is the richest source of ascorbic acid (vitamin C) and also contains tannin, polyphenol, pectin, gallic acid, and fiber. About 600–900 mg of vitamin C is found in 100 g of aonla pulp.[Citation1]
The aonla fruits are used in the traditional Indian system of medicines, like ayurvedic and unani, due to its therapeutic values.[Citation2] The aonla fruits are used in medicines to treat the common cold, gastric troubles, headache, constipation, enlarged liver, etc.[Citation3] Besides, it is used in cosmetics for enriching hair growth and pigments. However, due to its sour and astringent taste, it has very limited table value. So, it is processed into various value-added products, like preserves, candy, pickle, jam, sauce, juice, squash, laddu, barfi, chutney, dried powder, etc.[Citation4] The fruit has great potential for processing into quality products and can create a great demand in national, as well as in international, markets. The aonla shreds and powder are required as basic materials for most of the above-mentioned products.
The drying of fruits and vegetables is one of the most common processes used for improving the stability, because it decreases considerably the water activity of the material, reduces microbiological activity, and minimizes physical and chemical changes during its storage.[Citation5] Drying can be performed by using different kinds of equipment: air cabinet, belt drier, tunnel drier, fluidized bed, spray drier, drum drier, foam drier, freeze-drier, and microwave oven. The effectiveness of a drying process depends on different factors: method of heat transfer, continuity or discontinuity of the process, direction of the heating fluids with respect to the product, and pressure. However, during processing, the food material may be exposed to temperatures that have an adverse effect on quality and making these products susceptible to color deterioration.[Citation6–9] In order to minimize the color deterioration, suitable pretreatments like simple blanching or dipping/blanching with some additive viz sodium/potassium metabisulphite (0.1–0.5%), ascorbic acid, sodium chloride (3%), etc., have been used for color retention of fruits and vegetables.[Citation10–13] Among them, the most common are pigment degradation, especially carotenoids and chlorophyll, and browning reactions, such as Maillard condensation of hexoses and amino components, and oxidation of ascorbic acid.[Citation6,Citation7,Citation14] Other factors affecting color include fruit pH, acidity, processing temperature and duration, fruit cultivar, and heavy metal contamination.[Citation15–17] Product color is one of the most important quality factors of processed fruit products. Color change in fruit juice and purees during manufacture and storage is of vital interest to the industry, because the first quality judgement made by a consumer on a food at the point of sale is its visual appearance.
During drying, different indicators are assayed to determine the extent of color change. Hunter color parameters L, a, and b have previously been proven to be valuable in describing visual color deterioration and providing useful information for quality control in fruits and fruit products, such as double concentrated tomato paste,[Citation6] concentrated fruit pulp,[Citation7] peach puree,[Citation8] blackcurrant syrup,[Citation16] sultana grapes,[Citation18] diced apples,[Citation19] banana,[Citation20] and kiwifruit slabs.[Citation21] There are many literature studies on the kinetics of color change in fruits and fruit derivatives. However, little work has been conducted on the production of aonla shreds, and negligible kinetic studies related with the color change during drying were found in the literature. Therefore, the purpose of this research was to study the color change during drying of aonla shreds.
MATERIALS AND METHODS
Aonla fruits of cultivar NA-7, raised in semi-arid conditions and the most prominent variety for commercial pertain due to less fiber content requisite for sweet products like mouth freshner, chayanprash, etc., were used for the preparation of shreds. The aonla fruits were obtained from the orchard of CIPHET (Punjab, India) and stored in a cool place (15 ± 1°C) due to its hardy nature and to avoid chilling injury before conducting the experiment.
Preparation of Aonla Shreds
The initial moisture content of the aonla shreds was 243.17% (db). After thorough washing, the fruits were shredded manually. Prior to drying, the shreds were subjected to pretreatments to accomplish the good color. The shreds were blanched in hot water (simple blanched) (T 1), 3% salt solution (T 2), and 0.3% KMS (potassium metabisulphite) (T 3) for 3 min at 80°C to prevent leaching of nutrients at high temperature and complete inactivation of native enzymes peroxides and catalyzed. The product–solution ratio was always 1:5 (w/w). Different treated blanched and control (raw) (T 0) shreds were dried at temperatures 60 ± 3°C in a cabinet tray dryer (Narang Scientific Works, New Delhi, India) at an atmospheric RH of 17%. The dryer consisted of trays (800 × 400 × 30 mm), temperature controller (0–300°C, dry bulb temperature, accuracy ±1°C), and a centrifugal fan for airflow (1.2 m/sec). The experiment was performed in three replications.
Color Measurement
Sample color was measured before drying and at pre-specified time intervals during drying by a Hunter- Lab model colorimeter (illumination source: D65, view angle 2°, and aperture area 10 mm2; Hunter Lab, Reston, VA, USA). The reflectance of the sample was measured as a function of the wavelength in the area of 400–700 nm. The color values were expressed as L (whiteness or brightness/darkness), a (redness/greenness), and b (yellowness/blueness) at any time, respectively. Two standard tiles (one white and one black) were used for the calibration of color before measurements. A number of parameters could result from the main color spectrum. Like the total color difference (EquationEq. 1), chroma (EquationEq. 2), Hue angle (EquationEq. 3), and browning index (BI) (i.e., intensity of pure brown color) (EquationEq. 4) were calculated from the Hunter L, a, b values[Citation22] and used to describe the color change during drying:
where subscript “0” refers to the color reading of fresh aonla shreds.
Arctangent assumes positive values in the first and third quadrants and negative values in the second and fourth quadrants. Therefore, its negative values should be readjusted for useful interpretation. If its values are in the second quadrant, they should be summed by 180. If its values are in the fourth quadrant, they should be summed by 360.[Citation22]
where
Kinetic Considerations
For the design process, kinetic modeling is necessary to derive basic kinetic information for a system in order to describe the reaction rate as a function of experimental variables and, hence, to predict changes in a particular food during processing and storage.[Citation23] There are numerous references on the kinetics of color of food materials in the literature. The majority of these works report zero-order (EquationEq. 5) or first-order (EquationEq. 6) degradation reaction kinetics.
where (+) and (−) indicate formation and degradation of any quality parameter, respectively, and k is a kinetic constant. The parameters of the kinetic models for EquationEqs. (5) and (Equation6) were estimated by the linear regression procedure of the MS-Excel 2007 (Microsoft, Inc., USA).
Statistical Analysis
Analysis of variance of the results was conducted by means of a general linear model using SPSS 11.0.1 (SPSS South Asia Pvt., Bangalore, India) to determine the effect of different treatments on color parameters. In order to determine which means are significantly different from each other, the least significant difference (LSD) multiple range test method was used.
RESULTS AND DISCUSSION
Color Parameters L, a, and b
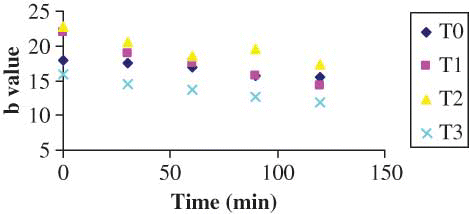
The results of color parameters of the shreds obtained from different treatments are shown in –, for L, a, and b values, respectively. The L value decreased with drying time irrespective of the pretreatments. However, the decrease in L value was highest for the control sample of shreds, i.e., the shreds without any pretreatment. Since it is a measure of the color in the light-dark axis, this falling value indicates that the samples were turning darker. It has been stated that the variation in the brightness of dried samples can be taken as a measurement of browning.[Citation8,Citation9] A similar trend was observed in a-value (sharp increase, ) and in b-value (sharp decrease, ). The shreds blanched with 0.3% KMS had a bright visual appearance. However, the control shreds appeared to have more darkness after drying. Therefore, they lost their natural brightness and showed redness when dried. This change was manifested by an increase in a-value () and a decrease of the b-value (). This may be due to decomposition of chlorophyll and other pigments[Citation24–26] and formation of brown pigments[Citation20,[Citation27,Citation28] or ascorbic acid browning and non-enzymatic Maillard browning,[Citation9,Citation15,Citation16] which can be depicted with the least change in brightness of blanched shreds with different additives. Similar observations were also reported in the literature.[Citation8] The Hunter L, a, b parameters were more influenced in the samples without any treatment (i.e., blanching). The least change was observed in the shreds blanched with 0.3% KMS, where L, a, and b values varied from 67.370 to 63.15, −9.36 to −4.58, and 15.87 to 11.77, respectively. The L-values did not differ significantly among the control, simple blanched, and salt-treated shreds, whereas a-values did not differ significantly among the simple blanched and salt-treated shreds. In the KMS-blanched shreds, the value changed significantly till 30 min and after that there was no statistical difference till 120 min. Nevertheless, b-values differ significantly () between the applied pretreatments.
Table 1 The results of analysis of variance for color values
Figure 1 ‘L’ value color parameter as a function of time during drying (color figure available online).
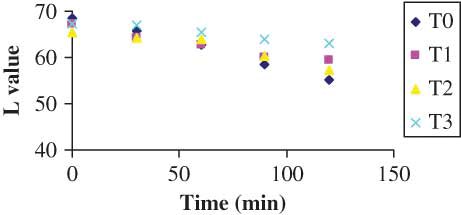
Figure 2 ‘a’ value color parameter as a function of time during drying (color figure available online).
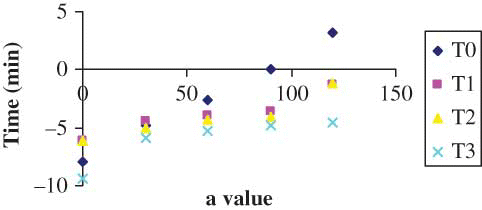
Figure 3 ‘b’ value color parameter as a function of time during drying (color figure available online).
Color Kinetics
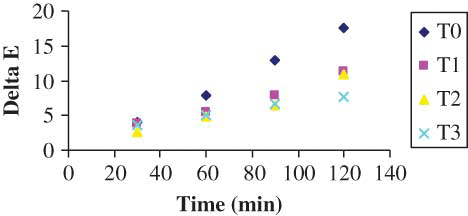
Experimental data for change in parameters L, a, b were fit to different kinetic models. The drying data were divided into four sections, namely, control, simple blanch, salt blanch, and KMS blanch and each were regressed separately. shows the kinetic parameters obtained for these fittings. The results revealed that regardless of the treatment, both zero- and first-order reaction kinetic models have almost equivalent R 2 values for L and b values (i.e., from 0.82 to 0.99). The zero-order model kinetic constant values (k 0) were higher in all cases than those of the first-order model (k 1). Based on RMSE and MRE () and residual plot (), it can be observed that zero order (i.e., EquationEq. 5) is predicting better than the first order with the least error values. The residual plot of zero order () is scattered and, hence, will predict better than the first order. However, the following authors have stated that the first-order kinetic model was better for L and b values of concentrated tomato paste,[Citation6] peach puree,[Citation8] and pear puree.[Citation9] On the other hand, only the zero-order model fit well with the data of a-value (R 2 0.939–0.987) in this study. These authors[Citation6,Citation8,Citation9,Citation28] have applied some other models other than zero and first-order, such as combined models or fractional conversion models, for a-value. The kinetic rate constants for the color change were observed to have different values for different pretreatments studied. The total color difference, ΔE, which is a combination of parameters L, a, and b values, is a colorimetric parameter extensively used to characterize the variation of colors in foods during processing. The variation of ΔE with time of different pretreatments is shown in . It was calculated from EquationEq. (1). The significant (P < 0.05) change in ΔE was observed with drying time. However, the ΔE values did not differ significantly between the salt and KMS-blanched shreds. The regression analyses results showed that all the data obtained from different treatments can be described successfully by zero-order kinetics (). Similar zero-order reaction has been reported[Citation28] for color change of grape juice. The kinetic constants describing the change in total color of control shreds was greater than that of blanched shreds indicating the more color deterioration. There was a significant difference P < 0.05 between the control and ΔE values of other pretreatments. However, the salt-treated shreds did not differ significantly from the simple and KMS-blanched shreds while no difference was detected among the simple and salt-blanched shreds.
Table 2 Kinetic parameters for color evaluation during drying
Table 3 Values of derived color measures of aonla shreds during drying
Figure 4 Residual plot of ΔE (color change) for shreds (color figure available online).
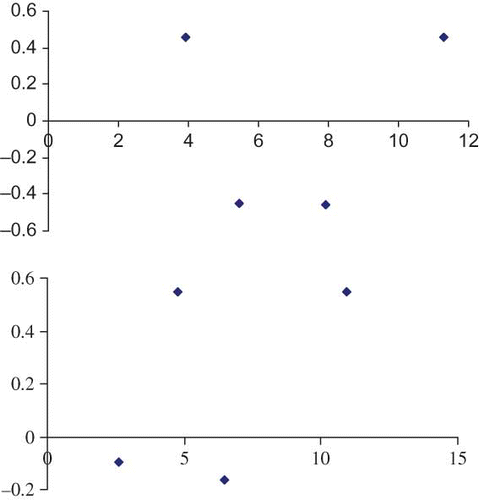
Figure 5 Variation of ΔE (color change) as a function of time during drying (color figure available online).
Chroma, Hue, and BI
These values were calculated using EquationEqs. (1) Equation Equation–Equation(4) and shown in . Chroma values decreased during drying regardless of the treatments. The chroma value indicates the degree of saturation of color and is proportional to the strength of the color. The main effects of pretreatments were found to be statistically significant (P < 0.05). However, the chroma values varied significantly till 60 min and after that no significant change was observed. Nonetheless the hue angle values did not differ significantly between the simple and salt blanched shreds. The Hue angle values increased during drying process irrespective of the applied blanching treatments. It suggested reduction from a more green to an orange-red color of dried shreds. The changes in hue angle values of control shreds were significant compared to applied blanching treatments. However, the hue angle obtained from other blanching pretreatments did not differ significantly (P > 0.05). Another color parameter is BI, which represents the purity of brown color and is reported as an important parameter in processes where enzymatic and non-enzymatic browning takes place.[Citation25] In this study, BI value did not differ significantly for KMS-blanched shreds; however, in simple and salt-blanched shreds the values differ significantly after two consecutive time intervals. Statistically, the change between the derived color parameters of different pretreatments was significant (P < 0.05). These results suggested that the KMS-treated shreds strongly affected the color quality of and produced less brown compound(s) leading to superior quality of the shreds.
CONCLUSION
The variation in the color of aonla shreds having different treatments, such as simply blanched, 3% salt blanched, and 0.3% KMS blanched, and control and dried at 60°C depends upon the time of drying and treatment applied. The utmost and least change in color parameters was observed in the control and KMS-blanched shreds, respectively. The color browning of shreds was maximum in the control, whereas it was in decreasing order in salt, simple blanched, and KMS-treated samples, respectively. The color of shreds blanched with 0.3% KMS was better (light and green), which could be preferred for further industrial uses as compared to raw and other treated shreds. The reaction associated with color change during drying followed zero-order reaction kinetics.
Related Research Data
REFERENCES
- Pokharkar , S.M. 2005 . Development and performance evaluation of Aonla shredding machine . Beverage and Food World , 32 ( 2 ) : 52 – 53 .
- Agrawal , S. and Chopra , C.S. 2004 . Changes in ascorbic acid and total phenols in making aonla product . Beverage and Food World , 31 ( 5 ) : 32 – 34 .
- Goyal , R.K. , Patil , R.T. , Kingsly , A.R.P. , Walia , H. and Kumar , P. 2008 . Status of post harvest technology of Aonla in India—A review . American Journal of Food Technology , 3 ( 1 ) : 13 – 23 .
- Gaganana , K. , Rokhade , A.K. and Patil , C.P. 2005 . Effect of pectinase enzymes and microorganisms on aonla juice recovery and quality . Beverage and Food World , 32 ( 1 ) : 67 – 68 .
- Araujo , E.A.F. , Ribeiro , S.C.A. , Azoubel , P.M. and Murr , F.E.X. 2004 . “ Drying kinetics of nectarine (Prunus persica) with and without shrinkage ” . In Proceedings of the 14th International Drying Symposium , Edited by: Silva , M.A. and Rocha , S.C.S. 2189 – 2194 . Campinas, São Paulo, , Brazil : Campinas State University .
- Barreiro , J.A. and Milano , M. 1997 . Sandoval, A.J. Kinetics of color change of double concentrated tomato paste during thermal treatment . Journal of Food Engineering , 33 : 359 – 371 .
- Lozano , J.E. and Ibarz , A. 1997 . Colour changes in concentrated fruit pulp during heating at high temperatures . Journal of Food Engineering , 31 : 365 – 373 .
- Avila , I.M.L.B. and Silva , C.L.M. 1999 . Modelling kinetics of thermal degradation of color in peach puree . Journal of Food Engineering , 39 : 161 – 166 .
- Ibarz , A. , Pagan , J. and Garza , S. 1999 . Kinetic models for color changes in pear puree during heating at relatively high temperatures . Journal of Food Engineering , 39 : 415 – 422 .
- Jokiæ , S. , Veliæ , D. , Biliæ , M. , Lukinac , J. and Planiniæ , M. 2009 . Buciæ-Kojiæ, A. Influence of process parameters and pre-treatments on quality and drying kinetics of apple samples . Czech Journal of Food Science , 27 : 88 – 94 .
- Fageria , M.S. , Khandelwal , P. and Dhaka , R.S. 2003 . Effect of fruit harvesting stages and processing treatments on the quality of sun dried fruits of lehsua (Cordia myxa Roxb.) . Journal of Applied Horticulture , 5 : 32 – 38 .
- Severini , C. and Baiano , A. 2003 . de Pilli, T. Microwave blanching of cubed potatoes . Journal of Food Processing and Preservation , 27 ( 6 ) : 475 – 491 .
- Kadam , D.M , Samuel , D.V.K. and Parsad , R. 2006 . Optimization of pre-treatments of solar dehydrated cauliflower . Journal of Food Engineering , 77 ( 3 ) : 659 – 664 .
- Lee , H.S. and Coates , G.A. 1999 . Thermal pasteurization effects on color of red grapefruit juices . Journal of Food Science , 64 : 663 – 666 .
- Abers , J.E. 1979 . Wrolstad, R.E. Causative factors of color deterioration in strawberry preserves during processing and storage . Journal of Food Science , 44 : 75 – 78 .
- Skrede , G. 1985 . Color quality of blackcurrant syrups during storage evaluated by Hunter L, a, b values . Journal of Food Science , 50 : 514 – 517 .
- Garcia-Viguera , C. , Zafrilla , P. , Romero , F. , Abellan , P. and Artes , F. 1999 . Tomas-Barberan, F.A . Colour stability of strawberry jam as affected by cultivar and storage temperature. Journal of Food Science , 64 : 243 – 247 .
- Aguilera , J.M. , Oppermann , K. and Sanchez , F. 1987 . Kinetics of browning of sultana grapes . Journal of Food Science , 52 : 990 – 993 . 1025
- Feng , H. and Tang , J. 1998 . Microwave finish drying of diced apples in a spouted bed . Journal of Food Science , 63 : 679 – 683 .
- Maskan , M. 2000 . Microwave/air and microwave finish drying of banana . Journal of Food Engineering , 44 : 71 – 78 .
- Maskan , M. 2001 . Drying, shrinkage and rehydration characteristics of kiwifruits during hot air and microwave drying . Journal of Food Engineering , 48 : 177 – 182 .
- Gazanfer , E. and Sefa , T. 2006 . Color retention of red peppers by chemical pretreatments during greenhouse and open sun drying . Journal of Food Engineering , 76 : 446 – 452 .
- Van Boekel , M.A.J.S. 1996 . Statistical aspects of kinetic modeling for food science problems . Journal of Food Science , 61 : 477 – 485 .
- Kostaropoulos , A.E. and Saravacos , G.D. 1995 . Microwave pretreatment for sun-dried raisins . Journal of Food Science , 60 : 344 – 347 .
- Lee , H.S. and Coates , G.A. 1999 . Thermal pasteurization effects on color of red grapefruit juices . Journal of Food Science , 64 : 663 – 666 .
- Weemaes , C. , Ooms , V. , Indrawati, L.; Ludikhuyze , L. , Van den Broeck , I. , Van Loey , A. and Hendrickx , M. 1999 . Pressure temperature degradation of green color in broccoli juice . Journal of Food Science , 64 : 504 – 508 .
- Lopez , A. , Pique , M.T. , Boatella , J. , Romero , A. , Ferran , A. and Garcia , J. 1997 . Influence of drying conditions on the hazelnut quality: III. Browning . Drying Technology , 15 : 989 – 1002 .
- Rhim , J.W. , Nunes , R.V. , Jones , V.A. and Swartzel , K.R. 1989 . Kinetics of color change of grape juice generated using linearly increasing temperature . Journal of Food Science , 54 : 776 – 777 .