Abstract
This article reports on the implementation of visible and near infrared spectroscopy for the detection of glucose concentration in a mixture of Saudi and imported honey samples adulterated by glucose syrup of five concentrations: 0, 5, 12, 19, and 33 g/100 g. Honey samples were scanned in trans-reflectance mode with an AgroSpec mobile, fibre type, visible and near infrared spectrophotometer (tec5 Technology for Spectroscopy, Germany), with a measurement range of 305–2200 nm. The entire data set of 345 spectra was randomly divided into calibration (70%) and prediction (30%) sets. The first group was subjected to a partial least squares regression analysis with a leave-one-out cross-validation to establish a calibration model for the prediction of glucose concentration, whereas the second group was used to validate the partial least squares model. For the cross-validation, the values for root mean square error of prediction, coefficient of determination, and ratio of prediction deviation, which is the standard deviation divided by root mean square error of prediction were 4.52 g/100 g, 0.85, and 2.53, respectively. A slightly lower range of accuracy was obtained in the prediction set, with root mean square error of prediction, coefficient of determination, and ratio of prediction deviation values of 5.56 g/100 g, 0.78 and 2.06, respectively. The results achieved suggest that the visible and near infrared spectroscopy is a powerful technique for the quantification of glucose adulteration in Saudi honey.
INTRODUCTION
Honey has a wide range of applications in the food industry, food preservation or use as an ingredient in hundreds of manufactured foods for its sweetness, colour, flavour, caramelisation, and viscosity.[Citation1] Honey is an excellent source of energy containing approximately 80 g/100 g carbohydrates (35 g/100 g glucose, 40 g/100 g fructose, and 5 g/100 g sucrose) and 20 g/100 g water. Also, it contains more than 180 substances, including amino acids, vitamins, minerals, enzymes, organic acids, and phenol compounds.[Citation2] It is also consumed fresh in large amounts due to the associated health and medical characteristics. The high sugar concentration, low pH, and the presence of flavonoids, hydrogen peroxide, phenolics, and terpenes make honey a powerful antiseptic and antimicrobial agent useful in the treatment of burns, wounds, gastroenteritis stomach, and skin ulcers.[Citation3,Citation4] Due to its superior nutritional and health value and unique flavour, natural bee honey is preferred by consumers; hence, the price of bee honey is much greater than other sweetening commodities, such as refined cane sugar and corn syrup. The high price of natural honey encourages workers in the honey industry, including beekeepers and merchants, to adulterate honey worldwide, which leads to deterioration of honey quality, but increases honey quantity that is sold at the same price of natural authentic honey.
Adulteration of bee honey with cheaper sweetening materials has been widely reported in the literature.[Citation5Citation–Citation7] In Saudi Arabia, honey adulteration is performed by mixing with cheap imported honey, diluting with water, and/or the addition of glucose syrup. Sometimes producers of authentic honey are obliged to artificially feed bees with glucose syrups, due to the lack of natural flora or the cost associated with moving the bee colony to areas rich with natural flora. Since the price of the Saudi natural honey is a multiple of ten for that of adulterated honey, a robust detection method of honey adulteration with glucose syrup will have a clear economic impact on Saudi consumers.
To guarantee authenticity of honey and protect the consumer from commercial exploitation, the quality of honey must be controlled analytically.[Citation8] Strict standards for commercial honey were set in various countries, based on specific physical properties and chemical compositions acquired with traditional analytical methods. However, Saudi Arabia currently lacks such standards, which emphasizes the importance of this research to the Saudi Arabian honey market. Since analytical methods require extensive sample preparation and experienced operators, they are time consuming, expensive, and destructive methods.
Spectroscopic techniques are advantageous over traditional methods, including mid infrared (MIR), fluorescence, and visible and near infrared (vis-NIR) spectroscopy. Although vis-NIR has been used intensively for sugar analysis in the food sector (e.g., He et al.[Citation9]), fewer publications about the use of this technique in honey can be found in the open literature. Ruoff et al.[Citation10] reported accurate measurement of fructose, glucose, sucrose, and maltose as well as the fructose/glucose and glucose/water ratios in honey samples from different crops.[Citation11,Citation12] Quiu et al.[Citation13] determined the main chemical composition of commercial honey, such as moisture, fructose, glucose, sucrose, and maltose with R2 values of 1.0, 0.97, 0.91, 0.86, and 0.93, respectively. Kelly et al.[Citation14] implemented the near coupled with principal component analysis to detect adulteration of Irish honey by beet invert syrup and high fructose corn syrup. Adulterated honey samples were well discriminated from authentic samples, particularly at a high fructose level of 10 g/100 g w/w. The near was also used to detect honey adulteration by addition of fructose and glucose.[Citation15] Similarly, adulteration of Mexican honey by sugar syrups, such as corn syrup and cane sugar syrup, was successfully detected with the near spectroscopy.[Citation16] This brief literature review demonstrates that no report is available on the use of the vis-NIR spectroscopy for the detection and quantification of glucose syrup adulterated in Saudi honey, although this is needed in a country that lacks standards for quality control of commercial honey. The aim of this article was to quantify adulteration with glucose syrup in authentic Saudi honey and imported honey in the Saudi market.
MATERIALS AND METHODS
Honey Samples
A total of 69 honey samples were collected and stored at room temperature. The majority of these samples (56 samples) were produced in the Kingdom of Saudi Arabia. Among these samples, 32 authentic samples, produced in different regions of Saudi Arabia, were collected directly from the beekeepers with guaranteed quality. The majority of these samples were from the southern part of the Kingdom. Further, 13 other authentic Saudi samples were produced with bees fed complementary with glucose syrup. The intention of the beekeepers was not to adulterate honey to increase the profit, but to feed bees when natural feed lacks in the fields. These samples were collected from the northern and southern part of the Kingdom. Another 11 Saudi samples were commercially available in the Saudi market without guaranteed quality. The majority of these samples were from the western part of the country, except two samples from the central and southern parts. The remaining 13 samples were non-Saudi samples, which were imported from different countries into Saudi Arabia. It is worth noting that none of these imported samples (except one sample from Egypt) is from any neighbouring countries of the Kingdom, indicating different floras than that of Saudi Arabia.
Honey Adulteration with Glucose
In order to evaluate the potential of the vis-NIR spectroscopy to quantify honey adulteration with glucose, glucose syrup of four different concentrations of 5, 12, 19, and 33 g/100 g were added to the honey samples. This practice is common in Saudi Arabia and in other countries in the Middle East and North Africa. The sugar solution was prepared by weight as 1:1 of glucose:water solution. After adding the sugar to water, the mixture was stirred properly at the boiling temperature, until the sugar melted completely in the solution. The solution was left to cool down before it was added to the honey samples. The honey samples were liquefied in a heating cabinet at 30°C for 2–5 h to allow for cooling down before optical scanning with the vis-NIR spectrophotometer took place.
Visible and Near Infrared Spectroscopy and Scanning of Honey Samples
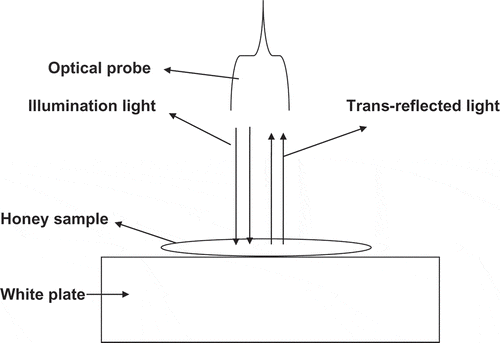
Optical scanning was carried out with an AgroSpec mobile, fibre type, vis-NIR spectrophotometer (tec5 Technology for Spectroscopy, Oberursel, Germany), with a measurement range of 305–2200 nm. The measurement in trans-reflectance mode was chosen in this study to measure honey spectra, as this measurement mode was recommended by other researchers.[Citation15] The data logging system consisted of tec5 analogue to digital converter data acquisition hardware and AgroSpec software (tec5 AG, Oberursel, Germany). The light source was a separate 20 watt halogen lamp that illuminated the honey samples by means of optical fibres. An A40 reflection probe from tec5 (tec5 AG, Oberursel, Germany) was used to illuminate and collect the trans-reflected light from honey samples. Before scanning, several experimental trials were attempted until an optimised measurement set up was achieved (). The trans-reflectance measurement was performed using a ceramic white plate, on which a honey sample (1–2 mm thick) was placed. The light penetrates the honey sample and reaches the white plate, from which light reflects through the honey sample back to the optical probe. A 100% ceramic was used as the white reference, which was scanned once every 30 min. From each honey sample three replicates were prepared, and from each, 10 scans were collected and averaged in one spectrum.
Principal Component Analysis
The principal component analysis (PCA) was applied on the vis-NIR spectra recorded on selected honey samples to discriminate between non-adulterated and adulterated honey with glucose syrup with a different ratio of concentrations of 5, 12, 19, and 33 g/100 g. In order to allow more detailed analysis with PCA, only 75 honey spectra of 15 randomly selected honey samples and their four adulterated versions were selected. PCA transforms the original independent variables (wavelengths) into new axes, or principal components (PCs). These PCs are orthogonal, so that the datasets presented on these axes are uncorrelated with each other.[Citation17,Citation18] Therefore, the PCA expresses the total variation in the dataset in only a few PCs and each successively derived PC expresses decreasing amounts of the variance. The first PC covers as much of the variation in the data as possible. The second PC is orthogonal to the first PC and covers as much of the remaining variation as possible, and so on. By plotting the PCs, one can view interrelationships between different variables, and detect and interpret sample patterns, groupings, similarities, or differences. Similarity maps allow comparison of the spectra in such a way that two neighbouring points represent two similar spectra. It was found that maximum normalization was the best pre-treatment to provide a detailed discretion of the spectra variation, and this resulted in the best performance of PCA. Spectral pre-treatments and PCA were carried out using Unscrambler 7.8 software (Camo Inc., Oslo, Norway).
Partial Least Squares Regression Analysis
Before conducing partial least squares (PLS) regression analysis, pre-treatment of honey spectra was carried out. The spectral pre-treatment aimed at removing the noisy part in the spectrum or eliminating some sources of variation not related to the measured value. Different spectra pre-treatments were tested, and the pre-treatment that resulted in the best result was withheld. The first step in spectra pre-treatment was noise cut at both edges of honey spectra, which resulted in a spectral range of 340 to 2148 nm. More data points were removed from the high end of the spectra because of the low signal-to-noise ratio at that end. Noise cut was successively followed by: (a) spectra wavelength reduction by averaging 4 adjacent wavelengths, which resulted in 453 wavelength variables; (b) baseline correction with baseline offset method; (c) first derivation with the Savitzky–Golay algorithm based on the second-order polynomial; and (d) smoothing with the Savitzky–Golay method.
The PLS regression analysis was used to develop quantitative models to predict the amount of artificially added glucose content in adulterated honey samples. The PLS is a bilinear modelling method where information in the original x data is projected onto a small number of underlying (“latent”) variables called PLS components. The y data are actively used in estimating the “latent” variables to ensure that the first components are the most relevant for predicting the y variables. Interpretation of the relationship between x data and y data is then simplified as this relationship is concentrated on the smallest possible number of components. More detailed information about the PLS can be found in Martens and Naes.[Citation18]
A total of 345 spectra of 69 non-adulterated and 276 adulterated honey samples with five glucose concentrations (0, 5, 12, 19, and 33 g/100 g) were randomly divided into calibration (70%) and prediction (30%) sets (). The first group was used for the establishment of the PLS model, whereas the second group was used for model validation. The leave-one-out cross-validation method was used during the PLS analysis. Spectral pre-treatments and PLS analysis were carried out using Unscrambler 7.8 software (Camo Inc., Oslo, Norway). A maximum of 3% of samples were considered as outliers, and were excluded from the PLS regression analysis.
Table 1 Sample statistics of glucose adulterated in the calibration and validation data sets
Evaluation of Model Performance
For the evaluation of the model performance, root mean square error of prediction (RMSEP) in calibration and validation was used.[Citation19] The RMSEP can be expressed as follows:
where is the predicted value and
is the observed value.
Ratio of prediction deviation (RPD), which is the ratio of standard deviation (SD) of the measured values to RMSEP, was used to compare between different calibration models developed. The third parameter considered was the coefficients of determination (R2). In fact, R2 indicates the percentage of the variance in the Y variable that is accounted for by the X variable. A value for R2 between 0.50 and 0.65 indicates that more than 50% of the variance in Y is accounted for by variance X, so that discrimination between high and low concentrations can be made. In the successful analysis of agricultural commodities, it is desirable to have R2 > 0.50 and RPD > 5. Nevertheless, for samples of complex material, Williams and Norris[Citation19] classified values as follows: RPD < 1.0 indicates very poor model/predictions and their use is not recommended; RPD between 2.4 and 3.0 indicates poor model/predictions where only high and low values are distinguishable; RPD between 3.1 and 4.9 indicates fair model/predictions, which may be used for assessment and correlation; RPD values between 5.0 and 6.4 indicates good model/predictions where quantitative predictions are possible; RPD between 6.5 and 8.0 indicates very good, quantitative model/predictions; and RPD > 8.1 indicates excellent model/predictions. Others reported that RPD is desired to be larger than 2 for a good calibration.[Citation20,Citation21] These reports considered RPD ratio ≤ 1.5 to indicate incorrect model predictions to prevent further prediction. Due to the conflicting information available in the literature about RPD values and the absence of information about RPD limits in honey, it was proposed to consider the following RPD values:
RPD ≤ 1.5: Poor model accuracy;
RPD = 1.5–2: Moderate model prediction accuracy, where discrimination between high and low values can be made;
RPD = 2–2.5: Good model prediction;
RPD = 2.5–3: Very good model prediction; and
RPD ≥ 3: Excellent model prediction.
The RPD values obtained in this study were classified according to the above proposed limits, and were used to evaluate the accuracy of PLS models for the prediction of glucose content in adulterated honey samples.
RESULTS AND DISCUSSION
Characteristics of Honey Spectra
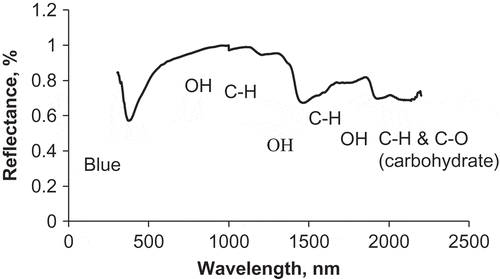
shows an average spectrum of the authentic honey samples (32 samples). The spectrum illustrates a typical spectral feature and absorption bands to those reported for honey.[Citation22] Several absorption peaks (dips on ) of different amplitude can be distinguished. A clear absorption peak in the vis range at 400 nm is observed, which can be attributed to colour variation of honey samples. Two absorption peaks appearing at 984 and 1450 nm in the NIR range are attributed to the O–H absorption bands at the third and second overtones, respectively. However, the absorption peak at 1450 nm is much larger and obvious. A third and largest O–H absorption band at 1930 nm is attributed to the OH stretch + OH bending. The fourth absorption peak in the NIR region locates at about 1170 nm and corresponds to C–H stretching in the second overtone region. This waveband is similar to the corresponding waveband observed by Shenk et al.[Citation23] at 1150 nm. Two small dips at 1688 and 1760 nm might be attributed, respectively, to CH2 anti-symmetric stretching and CH3 symmetric stretching in the first overtone region. Shenk et al.[Citation23] reported that 1700 nm waveband is associated with C–H first overtone, which is comparable to that at 1688 nm observed in this study. Murray and Williams[Citation24] attributed the spectral features around 1720 nm to C–H bond of carbonyl compounds. The absorption band at 2102 nm is assigned to C–H deformation and combination or C–O stretch combination overtones and was assigned to carbohydrate in honey.[Citation25−Citation27] Protein has also a reflectance peak at about 2180 nm, which was not detectable in the current study.21
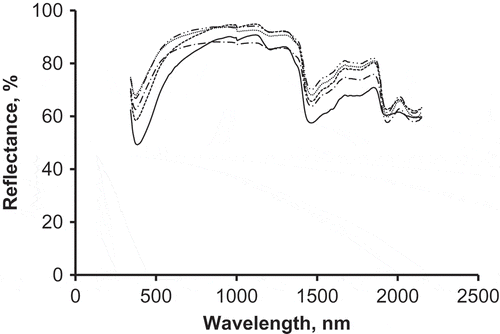
compares average spectrum of non-adulterated honey with four average spectra of adulterated honey samples with four sugar concentrations of 5, 12, 19, and 33 g/100 g. Clear differences can be observed between spectra of adulterated honey samples, as compared to the non-adulterated sample. The authentic non-adulterated spectrum demonstrates less reflectance and higher absorption, as compared to glucose-adulterated spectra. Generally, in the visible range, reflectance increases with the amount of glucose added to the adulterated samples, which might be attributed to changes in honey colour. With increasing the amount of glucose syrup added, honey samples become lighter in colour; hence, reflectance increases due decreasing the overall absorption. However, in the near range mixed behaviour is observed, which is difficult to be explained. The water absorption band, particularly at 1950 nm, is more evident in the adulterated honey spectra as compared to the non-adulterated spectra.
Discrimination between Adulterated from Non-Adulterated Honey Samples
shows a PC similarity map (PCs 1 and 2), resulted from PCA carried out on normalised honey spectra of adulterated and non-adulterated samples. A good separation is observed between the 15 non-adulterated samples from the adulterated samples. One observation that may be made about this perfect separation is the diagonal direction of separation, with non-adulterated samples located on the left and bottom sides of PC2 and PC1, respectively. Separation along PC1 appears to be more pronounced, as compared to separation along PC2. However, minor overlap can be observed. Since adulteration with 5 g/100 g glucose syrup is considered as small concentration,[Citation15] it might be difficult to be detected by the vis-NIR spectroscopy. Therefore, by excluding samples with 5 g/100 g adulteration rate, from the PCA enables perfect separation (). This result proves the capability of vis-NIR spectroscopy coupled with PCA to discriminate between authentic honey samples from the corresponding adulterated samples with different glucose contents of 12, 19, and 33 g/100 g. However, samples of different ratios of glucose concentration are completely overlapped, which is not a good sign for the sensitivity of the vis-NIR spectroscopy to quantify the amount of sugar used to adulterate honey.
Table 2 Results of cross-validation and independent validation for the prediction of glucose concentration in adulterated honey samples
Glucose Quantification in Adulterated Honey Samples
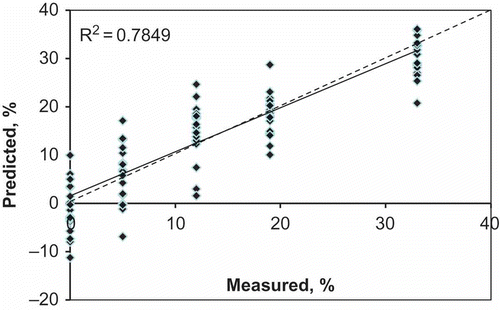
summarises results of PLS regression analysis for the prediction of glucose content in adulterated honey samples in the cross-validation and in the prediction sets. Values of RPD of 2.56 and 2.06 obtained for the calibration and the prediction sets indicate very good and good model predictions, respectively. This result is in line with results reported in the literature for the prediction of glucose ratio used to adulterate honey samples. Ruoff et al.[Citation10] obtained R2 values in the range of 0.81–0.88, which is in the same range of the current study (0.78–0.86) for both the cross-validation and prediction sets (). The scatter plot of measured versus predicted glucose concentrations in adulterated honey samples in the prediction set is shown in .
Figure 5 Scatter plot of measured versus predicted glucose concentration in adulterated honey samples of the independent validation data set.
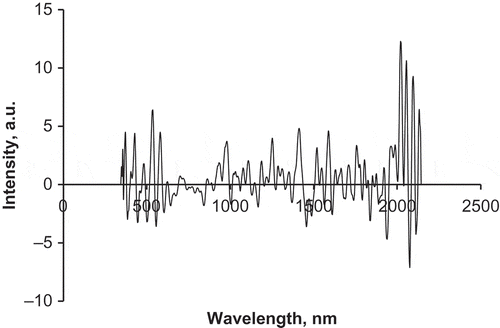
During the PLS regression analysis, the observed response values are approximated by a linear combination of the values of the predictors. The coefficients of that combination are called regression coefficients or B-coefficients. The regression coefficients plot is a useful plot to identify the important wavelengths for the prediction of a property. The absolute value of the regression coefficients is the largest for the wavelengths that contribute most to the prediction equation. This plot over the entire wavelength range shows distinguished wavelength bands for glucose prediction (). There are distinct absorption peaks throughout the vis and NIR regions, with the most significant being at two spectral ranges of 400–600 nm (visible range) and 1900–2145 nm (near range). In the vis range, significant wavebands at 428, 532, and 580 nm are thought to be associated with colour changes. The peaks around 1700, 1150, 930, and 780 nm in the near range correspond to C–H first, second, third, and fourth overtones, respectively.[Citation23] Comparable bands in the NIR range to those found by Shenk et al.[Citation23] were observed in this study, respectively, at 1756, 1160, 976, and 840 nm. Other bands at 1000, 1456, and 1944 nm associated with O–H stretch in the third, second, and first overtones, respectively, can also be observed. The large positive peak at 2020 nm and negative peak at 2076 nm can be assigned to carbohydrate. The absorption bands at 2102 nm is assigned to C–H deformation and combination or C–O stretch combination overtones and were both assigned to carbohydrate in honey.[Citation25−Citation27] The detailed information about significant wavebands for the detection of glucose adulteration derived from the correlation coefficient plots is in agreement with that for the honey raw spectra reported in this article and in the literature.
CONCLUSIONS
This study evaluated the potential of the visible and near infrared (vis-NIR) spectroscopy coupled with chemometrics for the detection of glucose adulteration in Saudi honey. Honey spectral features enabled clear discrimination between non-adulterated and adulterated honey samples. Larger overall absorption and smaller water absorption bands characterised the non-adulterated spectra, as compared to the adulterated samples. The vis-NIR spectroscopy coupled with principal component analysis (PCA) was found to be a useful technique to discriminate between non-adulterated from adulterated samples with glucose ratios of 12, 19, and 33 g/100 g. However, small overlap was observed between the two sample groups only at small concentration of glucose syrup of 5 g/100 g. The vis-NIR spectroscopy coupled with partial least squares (PLS) regression enabled the prediction of the amount of glucose added to the adulterated honey samples with very good to good model prediction accuracy. The regression coefficients plot obtained from PLS regression showed distinguished bands in the visible range, associated with colour changes and in the near range, associated with C–H, C–O, O–H bonds; both reflected the addition of glucose syrup to the honey samples. More advanced mathematical modelling techniques, e.g., artificial neural network and support vector machine that can handle the non-linear responses in the dataset are recommended for future work to improve the prediction accuracy of glucose concentration in adulterated Saudi honey.
FUNDING
The authors gratefully acknowledge the financial support received from the government of the Kingdom of Saudi Arabia.
REFERENCES
- Rodriguez, G.O.; Ferrer, B.S.; Ferrer, A.; Rodriguez, B. Characterization of honey produced in Venezuela. Food Chemistry 2004, 84, 499–502.
- Ouchemoukh, S.; Louaileche, H.; Schweizer, P. Physicochemical characteristics and pollen spectrum of some Algerian honeys. Food Control 2007, 18, 52–58.
- McCarthy, J. The antibacterial effects of honey: Medical fact or fiction? American Bee Journal 1995, 135, 341–342.
- Dunford, C.; Cooper, R.; Molan, P.; White, R. The use of honey in wound management. Nursing Standard 2000, 15(11), 63–68.
- Cienfuegos, E.; Casar, I.; Morales, P. Carbon isotopic composition of Mexican honey. Journal of Apiculture Research 1997, 36, 169–179.
- Tien, L.L.; Shau, M.O.A. Quality analysis of Longan honey in Taiwan market. Food Science Taiwan 1997, 24, 479–489.
- Gonzalez, M.I.; Marques, M.E.; Sanchez, S.J.; Gonzalez, R.B. Detection of honey adulteration with beet sugar using stable isotope methodology. Food Chemistry 1997, 61(3), 281–286.
- Mendes, E.; Brojo Proenca, E.; Ferreira, I.M.P.L.V.O.; Ferreira, M.A. Quality evaluation of Portuguese honey. Carbohydrate Polymers 1998, 37, 219–222.
- He, Y.; Wu, D.; Feng, S.; Li, X. Fast measurement of sugar content of yogurt using vis/NIR-spectroscopy. International Journal of Food Properties 2007, 10(1), 1–7.
- Ruoff, K.; Luginbuehl, W.; Bogdanov, S.; Bosset, J.O.; Estermann, B.; Ziolko, T.; Kheradmandan, S.; Amado, R. Quantitative determination of physical and chemical measurands in honey by near-infrared spectrometry. European Food Research and Technology 2007, 225, 415–423.
- Cho, H.J.; Hong, S.H. Acacia honey quality measurement by near infrared spectroscopy. Journal of Near Infrared Spectroscopy 1998, 6, A329–A331.
- Garcia Alvarez, M.; Ceresuela, S.; Huidobro, J.F.; Hermida, M.; Rodriguez Otero, J.L. Determination of polarimetric parameters of honey by near-infrared transflectance spectroscopy. Journal of Agriculture and Food Chemistry 2002, 50, 419–425.
- Quiu, P.Y.; Ding, H.B.; Tang, Y.K.; Xu, R.J. Determination of chemical composition of commercial honey by near-infrared spectroscopy. Journal of Agriculture and Food Chemistry 1999, 47, 2760–2765.
- Kelly, J.D.; Downey, G.; Fouratier, V. Potential of near infrared spectroscopy to detect adulteration of irish honey samples by beet inverted syrup and high fructose corn syrup. Journal of Near Infrared Spectroscopy 2006, 14(2), 139–146.
- Downey, G.; Fouratier, V.; Kelly, J.D. Detection of honey adulteration of fructose and glucose using near infrared transflectance spectroscopy. Journal of Near Infrared Spectroscopy 2003, 11, 447–456.
- Rios-Corripio, M.A.; Rios-Leal, E.; Rojas-López, M.; Delgado-Macuil, R. FTIR characterization of Mexican honey and its adulteration with sugar syrups by using chemometric methods. Journal of Physics: Conference Series 2011, 274 (1), 012098I.
- Jolliffe, I.T. Principal Component Analysis; Springer: New York, 1986; 393 pp.
- Martens, H.; Naes, T. Multivariate Calibration, 2nd Ed.; John Wiley & Sons: Chichester, UK, 1989; 419 pp.
- Williams, P.C.; Norris, K. Variables affecting near-infrared spectroscopic analysis. In Near-Infrared Technology in Agricultural and Food Industries; Williams, P.C.; Norris, K.; Eds.; American Association of Cereal Chemists, Inc.: St. Paul, MN, 2001, 171–189.
- Williams, P. A short course in the practical implementation of near infrared spectroscopy for user. Near-Infrared Technology—Getting the Best Out of Light; PDK Grain Project, Inc.: Nanaimo, Canada, 2008.
- Karoui, R.; Mouazen, A.M.; Dufour, É.; Pillonel, L.; Schaller, E.; De Baerdemaeker, J.; Bosset, J-O. Chemical determination of European Emmental cheeses by near infrared spectroscopy using chemometric tools. International Dairy Journal 2006, 16(10), 1211–1217.
- Webster, T.C.; Dowell, F.E.; Maghirang, E.B.; Thacker, E.M. Visible and near-infrared spectroscopy detects queen honey bee insemination. Apidologie 2009, 40(5), 565–569.
- Shenk, J.S.; Workman, J.J.; Westerhaus, M.O. 2001. Application of NIR spectroscopy to agricultural products. In Handbook of Near-Infrared Analysis; Burns, D.; Ciurczak, E.; Eds.; Marcel Dekker Inc.: New York, NY, 2001; 419–474.
- Murray, I.; Williams, P.C. Chemical principles of near infrared technology. In Near Infrared Technologies in Agricultural and Food industries; Williams, P.; Norris, K.; Eds.; American Association of Cereal Chemists: St. Paul, MN, 2001; 17–31.
- Osborne, B.G.; Fearn, T.; Hindle, P.H. Practical NIR Spectroscopy with Application in Food and Beverage Analysis, 2nd Ed.; Longman Scientific and Technical, Harlow: Essex, UK, 1993; 228 pp.
- Cozzolino, D.; Smyth, H.E.; Gishen, M. Feasibility study on the use of visible and near infrared spectroscopy together with chemometrics to discriminate between commercial white wines of different varietal origins. Journal of Agriculture and Food Chemistry 2003, 51, 7703–7708.
- Murray, I. The NIR spectra of homologous series of organic compounds. In Proceedings International NIR/NIT Conference; Hollo, J.; Kaffka, K.J.; Gonczy, J.L.; Eds.; Akademiai Kiado: Budapest, Hungary, 1986; 13–28.

