
Abstract
The aim of this research was to predict quality factors of tomato fruit during storage using backscattering and multispectral imaging techniques. To gather the required information for developing prediction models, batches of 200 tomatoes (cv. Pannovy) harvested at two maturity stages, were stored at standard condition up to four weeks. During storage, the modulus of elasticity, moisture content, soluble solid content, titratable acidity, hyperspectral data, and backscattering images were acquired on 40 tomatoes at regular intervals of one week. After extracting the spectral data from 40 points on each sample, they were subjected to preprocessing operations. Several feature selection techniques, including filter (Relief F, Fisher-Score, and t-Score) and wrapper (genetic algorithm) methods were used to find the sensitive wavelengths for each fruit quality parameter. With the novel strategy used, the wavelengths found by the fusion of genetic algorithm and t-Score techniques showed good prediction performance for all considered qualitative parameters. In order to verify the usefulness of selected wavelengths, backscattering and multispectral imaging techniques were applied. The artificial neural network produced the calibration models which gave a reasonably good correlation for estimating the modulus of elasticity, soluble solid content, and titratable acidity at 660 nm and moisture content at 830 nm of tomato from backscattering images. The correlation coefficient between the multispectral and backscattering imaging prediction results and reference measurement results were 0.952 and 0.891 for modulus of elasticity, 0.727 and 0.539 for moisture content, 0.736 and 0.561 for soluble solid content, and 0.811 and 0.706 for titratable acidity, respectively.
INTRODUCTION
Because of increasing awareness of quality and enhanced perspicacity of consumers, there is a strong demand for high quality products in both marketing of horticultural products and in the food industry. Over the years, many non-destructive testing methods have been developed based on mimicking human sensory characteristics for quality evaluation of agro-food materials. These include visual, acoustic, spectroscopic, and mechanical techniques.[Citation1] Recently, a growing interest and attention has been paid to hyperspectral imaging as an analytical tool for quality assessment of agro-food products. Providing the simultaneous spectral and spatial information leads this technique to be nominated as a deliberated tool for monitoring of food production processes.[Citation2] Hyperspectral images are data rich and need long acquisition and processing time. Therefore, at the present time it is impractical to implement the hyperspectral imaging technique as an online system in the food industry.[Citation3] Multispectral and backscattering imaging are good alternatives to hyperspectral imaging since they work in a limited number of wavelengths, and consequently, need low acquisition and processing time.[Citation4]
Determination of effective optimal wavelengths is one of the key steps in designing a multispectral or backscattering imaging system. The sensitive wavelengths are normally selected according to the analysis of the hyperspectral data, which can be recorded from either a hyperspectral imaging setup or a spectrometer. Wavelength selection process leads to reduce the spectral dimensionality while most important information is preserved in the new data space. The selected wavelengths should provide a reasonable prediction performance for monitoring qualitative factors (e.g., titratable acidity [TA], modulus of elasticity, and moisture content [MC]) comparing with prediction by whole spectral space.
A number of data analysis and data mining techniques have been used by researchers to find the optimum wavelengths of agro-food materials. They include analysis of spectral differences for detection of fecal contaminants in apples,[Citation5] spectrum derivatives for broiler carcass inspection,[Citation6] stepwise regression for prediction of beef tenderness,[Citation7] discriminant analysis for prediction of the microbial spoilage of beef,[Citation8] correlation coefficient for predicting physicochemical properties of apple,[Citation9] independent component analysis for predicting the pH value in peach,[Citation10] etc. According to El Masry et al.,[Citation11] the nature of the problem, the size of the dataset, ease of implementation, and economic feasibility are the main effective factors in choosing the particular approach. Application of data mining for optimum wavelength selection of agro-food materials is essential since a reduction in the number of wavelengths by an inappropriate method may lead to a loss in the discrimination power and thereby lower the performance of the prediction model.
The objectives of this study were two-folds: (a) use of several data mining based techniques with a novel strategy to search optimal wavelengths in the hyperspectral images that would be most closely related to modulus of elasticity, MC, soluble solid content (SSC), and TA of tomato fruit, and (b) develop calibration models using artificial neural networks (ANNs) to predict the above mentioned qualitative indices by hyperspectral, multispectral, and backscattering imaging techniques.
MATERIALS AND METHODS
Fruit Samples
Two hundred defect free “Pannovy” tomato fruits obtained from two different sources were used in the experiment. One hundred tomatoes in the third and fourth stage of maturity according to the OECD color chart were harvested from a greenhouse equipped with an energy-saving system while the rest of the samples, in the same maturity level, were harvested from a conventional greenhouse both located in the Humboldt University of Berlin, Germany. Immediately after harvesting, samples were transported to the laboratory (21 ± 1°C) for numbering and measuring some basic properties such as mass and dimensions. To generate fruits with variations in their properties, fruits were separated into five groups (40 samples each) and stored at 15 ± 1°C and 92 ± 2% relative humidity. The day after the storage was defined as the beginning of experiments. From the start of the storage experiment, samples were withdrawn at regular intervals of one week during a period of 30 days. Fruits were removed from the storage and left in room temperature (21 ± 1°C) for at least 2 h prior to experiments.
Hypercubes Acquisition
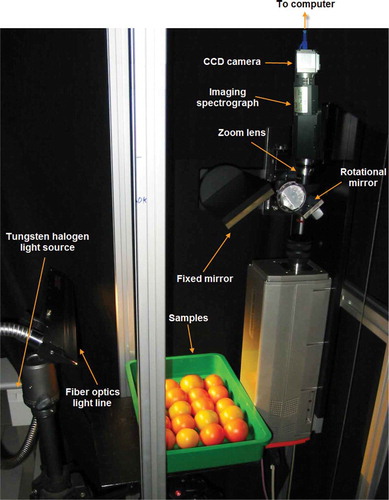
A hyperspectral imaging system in the visible and shortwave near infrared range (VIS-SWNIR), i.e., 400–1000 nm, was used to acquire hypercubes of tomato samples in the reflectance mode (). The system was consisted of a charge-coupled device (CCD) camera (pco.oem uc, PCO Co., Germany), connected to a spectrograph (ImSpector V10E, Specim Co., Finland) coupled with a standard C-mount zoom lens and a sample holder unit. The optics of this imaging system allowed studying tomato properties associated with the spectral range of 400–1000 nm with spectral and spatial resolution of 1.215 nm and 1392 × 1024 pixels, respectively. The lighting unit was a direct current regulated light source from a 225 W tungsten halogen lamp (Model 4900, Illumination Technologies Inc., NY, USA) delivered through a fiber optic light line. The imaging spectrograph, with a slit size of 30 μm and an F-number of 2.4, scanned the samples one line at a time using a mirror system equipped with a stepper motor to rotate the rotational mirror through the camera’s field of view. The spectral images were collected in a dark room where only the halogen light source was available. The exposure time was adjusted to 20–30 ms throughout the test.
FIGURE 1 Hyperspectral imaging system for acquiring reflectance images from tomato samples.
After image acquisition, the hypercubes were subjected to the following treats:
Increasing the signal to noise ratio (SNR)
Pixel binning is a powerful technique to increase the SNR. In this technique, the spectral information of adjacent pixels is combined to create a low-noise pixel. In the current study, the spatial resolution of hypercubes was decreased to 696 × 512 pixels by averaging over a mask with the window size of 2 × 2 pixels.
Image intensity correction
To correct the acquired image (I) from the dark current of the camera, white and dark reference images were captured. The white reference image (W) of approximately 100% reflectance was acquired from a white Teflon calibration tile, while the dark reference image (B) of approximately zero reflectance was obtained by turning off the lighting source and covering the lens of the camera by its black cap. The calibrated image (R) was then calculated using the following equation:[Citation12]
Extraction and Preprocessing of Spectral Data
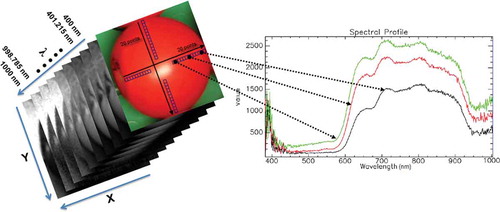
After acquisition of hyperspectral images, the spectral information of 40 points (the average of a 3 × 3 pixels window for each point) in different sections of samples was collected manually according to the pattern shown in . Observations showed that the light reflectance from different sections of fruit is not the same so that its value increased when we moved from the marginal sections toward the center of the fruit. In some sections the specular reflection of the illumination source at the tomato surface caused to produce regions with high-intensity values in the hyperspectral images. These regions act like a mirror and saturate the CCD. The saturated pixels were not included in the pattern of extracting spectral data.
FIGURE 2 The pattern of extracting spectral data and effect of fruit curvature on the intensity of light reflectance in a hyperspectral image.
For each fruit, the following preprocessing operations were carried out on each spectrum:
Improving the spectral resolution
In order to increase the precision of the wavelength selection process, it was necessary to improve the spectral resolution. Interpolation over the spectral data is a mathematical way to solve this problem when there are hardware limitations in the spectrograph. The “piecewise cubic spline,” as a numerical method, is a good technique for interpolation since the interpolation error is kept small even when low degree polynomials for the spline are used. Using this technique the resolution of tomato’s reflectance spectra was improved from 1.215 to 0.5 nm.
Removing the random noises
As stated in the literature, “curve smoothing” is an accepted way to remove the effect of random noises from VIS-SWNIR spectra.[Citation13] Savitzky-Golay filter was used to smooth the spectra. Smoothing parameters were filter width of 45 and the order of polynomial as two.
Reducing the effect of fruit curvature
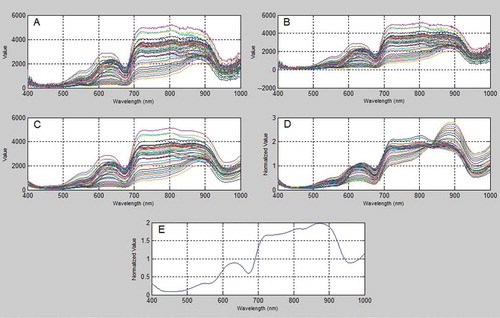
The curvature of tomato surface leads to a scaling difference in the reflectance spectra so that the spectrum from the central sections of tomato exhibited higher reflectance intensity than marginal sections (). Non-uniform lighting over the curved surface of fruit and relative difference in path length from different points of the curved tomato surface to the CCD camera were the main reasons for causing of this phenomenon. Researchers showed that “mean normalization,” i.e., divide each spectrum by its mean intensity value, is an effective procedure to decrease spectral variability due to curvature.[Citation3] Hence, tomato spectra were subjected to this preprocessing operation. After applying the above preprocessing operations, the average of 40 spectra was collected and reported as the spectral signature of each sample. shows raw, interpolated, Savitzky-Golay smoothed, and mean normalized spectra, along with the final reflectance spectrum of a sample tomato.
FIGURE 3 Preprocessing reflectance spectra of a tomato sample: (a) Raw, (b) Interpolated, (c) Savitzky-Golay smoothed, (d) Mean normalized, and (e) Final spectrum.
Wavelength Selection Methods
Basically, wavelength selection is a process like feature selection in pattern recognition problems. So, the feature selection techniques can be used to find the sensitive wavelengths of fruits in spectroscopy. Feature selection methods are categorized in two main groups: Filter and wrapper. The main difference between two groups is that whether or not they are classification/prediction model dependent.
In the filter methods, the selection criterion is self determined, i.e., it is independent of the classification/prediction model. In these methods, feature selection and classification/prediction model designs are separated since a subset of features is firstly selected and then classification/prediction models are trained based on these selected features. Researchers proposed several ranking criteria for filter methods, which use features individually (such as SNR and symmetric divergence techniques) or consider the interaction of features (such as feature weighting technique) in the selection process.
In the wrapper methods, classification/prediction model is predetermined. They use a search algorithm to search through the features and evaluate each feature by running the model on it. Since the ultimate goal of feature selection is to increase classification/prediction accuracy, it is intuitive to choose a particular classification/prediction method and use its parameters or its performance on training data to guide the feature selection process. Typically, this is done by selecting a subset of features and evaluating its performance on the chosen classification/prediction model, and the process is repeated until the best subset is obtained.
Several filter and wrapper approaches have been proposed for feature selection process by researchers. Here Fisher-Score, Relief F, and t-Score were used as filter techniques and genetic algorithm (GA) as a wrapper technique (). The standard MATLAB based feature selection packages provided by Arizona State University[Citation14] and Leardi[Citation15] were used for wavelength selection by filter and wrapper techniques, respectively. The inputs to the wavelength selection procedures were the light intensity at each wavelength and the quality attributes of tomato obtained by destructive tests. All of these procedures have the ability to weight the features. The wavelengths were first evaluated by each of these techniques. Then, they were sorted according to their weights. The larger the weight, the higher the importance of wavelength is. The output of wavelength selection was a vector containing the list of wavelengths in order of importance for evaluation of tomato fruit by each quality characteristic.
TABLE 1 Technical details of techniques used to find optimal wavelengths for quality monitoring of tomato fruit
Verification of Selected Wavelengths
After selecting the appropriate wavelengths using the methods described in the previous section, the next step is to determine whether or not these wavelengths are suitable for predicting different quality characteristics of tomato fruit. For this aim, ANNs were designed to investigate the prediction power of selected wavelengths. In fact, the power of hyperspectral imaging to predict the qualitative characteristics of tomato by ANN was compared with that of multispectral and backscattering imaging techniques. Two ANN models were constructed based on the hyperspectral data. The input to the first model was preprocessed reflectance data in the range of 400 to 1000 nm (full spectra with 1200 data point). The second model was designed based on the principal component (PC) scores of preprocessed spectra as the input vector. The reason for constructing a prediction model based on the PC scores is that principal component analysis (PCA) has been commonly used by researchers to reduce the dimensionality of hyperspectral images. PCA, as a feature compression technique, converts a set of observations of possibly correlated variables into a set of values of linearly uncorrelated variables called PCs.[Citation16] Unlike the feature selection methods, that find a subset of the original features from the feature space, PCA transforms the data in the high-dimensional space to a space of fewer dimensions. Therefore, it is expected that in the PCA method, the useful spectral formation is retained more than the feature selection methods.
Multispectral imaging is the simplified version of hyperspectral imaging technique in which reflectance images are acquired in a limited number of wavelengths. The wavelengths may be separated by filters or by the use of instruments that are sensitive to particular wavelengths in the multispectral imaging systems. Another way to create a multispectral image is to extract spectral images in a specific number of wavebands from a hyperspectral image. In the current study, the spectral information in the selected wavelengths for monitoring each quality characteristic was extracted from the hypercubes of tomato fruits. This information was then utilized as an input vector to build ANN prediction models.
As an inexpensive technique, laser light backscattering imaging (LLBI) has attracted attention of researchers in recent years for monitoring quality of agro-food products.[Citation4] In this technique, laser light at predetermined wavelengths is incident on the fruit surface. The LLBI system used in this study consisted of a wide dynamic range monochrome CCD camera (JAI A50IR CCIR, JAI, Denmark), a zoom lens (model H6Z810, PENTAX Europe GmbH, Germany), laser diode as the light source (LPM series, Newport Corp., USA), laser driver, sample holder unit, video converter (VRM AVC-1, Stemmer Imaging GmbH, Germany), and a computer (). Laser diodes were selected according to the wavelengths found in the previous section. In order to improve the SNR, image acquisition took place in a dark room. The camera was placed perpendicular to the sample holder while the incident angle of the laser beam was adjusted to 15°. The system was adjusted according to that proposed by Baranyai and Zude.[Citation17] After image acquisition, the PC scores of images were extracted. The scores were then fed to the ANN forecaster to produce prediction models.
FIGURE 4 Schematic view of LLBI system to capture backscattering signature of tomato fruits. (a) CCD camera, (b) Zoom lens, (c) Laser diode, (d) Laser driver, (e) Sample holder, and (f) Computer equipped with a video converter.

Statistical Analysis
In order to design each ANN model, 60% of data set was randomly selected as training set (120 samples), 15% for cross-validation (30 samples), and the remaining 25% of data set (or 50 samples) was used as testing set. To objectively evaluate the performance of ANN models, three different statistical indicators were used. These indicators were the correlation coefficient of testing data set (rt), mean squared error (MSEt) of testing data set, and ratio of prediction to deviation (RPD).[Citation18,Citation19] These statistical indicators can be expressed mathematically as follows:
Measurement of Quality Parameters
Immediately after image recording, modulus of elasticity, MC, SSC, and TA of tomato fruits were measured by destructive tests. Products modulus of elasticity was established from compression tests with a universal testing machine (Zwicki 1120, Zwick, Germany). From the length of depression at a maximum force of 0.5 N and assuming the spherical body of tomato, the apparent quasi static elastic modulus was calculated according to Mohsenin.[Citation20] After modulus of elasticity measurement, each fruit was divided into two equal halves. One half was used for MC determination and the other half was juiced to determine SSC and TA. The MC was determined by oven-drying method using forced-air convection oven at 105°C for 24 h; meanwhile, the TA of the tomato juice, expressed as citric acid g/100 ml, was determined with a 0.01N NaOH solution according to the method reported by Tung-Sung, Siddiq, Sinha, and Cash,[Citation21] and the SSC (°Brix) was measured using a digital refractometer (Model DR301-95, A. Krüss Optronic Corp., Germany).
Software
To control the hyperspectral imaging system and acquiring the hyperspectral imaging data, software was developed in LabView 8.6 (HyBiS 1.0 datalog, ATB, Germany). The Environment for Visualization Images (ENVI) software, Version 4.8, (Research Systems Inc., Boulder, CO, USA) was used for correction of hyperspectral images and extraction of spectral information. The MATLAB R2009a (Mathworks, Natick, USA) for Windows 7 was used for processing of backscattering images as well as for building the ANN models.
RESULTS AND DISCUSSION
Suitable Wavelengths
The Fisher-Score, Relief F, t-Score, and GA techniques were applied on the preprocessed spectral data, individually. The output of these techniques was a vector containing the list of wavelengths in order of their weights so that the upper wavelengths had the higher degree of importance. Since the goal was to find the optimum wavelengths, spectral data in top 200 ranked wavelengths (total number of wavelengths was 1200) were considered for further investigation. To find the appropriate number of selected wavelengths and to compare the capability of different wavelength selection methods, it was necessary to use a standard prediction model so that the prediction strength of input data be determined. Prediction technique should be such that it always provides the same outputs for the fixed inputs. ANN was not used since the initial neuron weights and biases are randomly selected and would result in different outputs with the fixed inputs. Therefore, in this research, support vector machines (SVMs) was implemented in the MATLAB software.[Citation18] In SVMs the optimal boundary, known as hyperplane, of two sets in a vector space is obtained independently on the probabilistic distribution of training vectors in the set. This hyperplane locates the boundary that is most distant from the vectors nearest to the boundary, known as supporting vectors, in both sets. If the space is not linearly separable there may be no separating hyperplane to start with, for which a kernel function is used to solve this problem. Here the Gaussian kernel function was used.
shows the result of prediction by SVM when the input data provided by different wavelength selection methods increased from rank 1st to rank 200th of selected wavelengths. In most cases GA provided the highest r and lowest MSE values in the initial number of wavelengths. As shown in , some wavelengths lead to a decrease in the value of r. This comes from the fact that there is no certainty in the selected wavelengths, since each wavelength selection method has its own drawback. To minimize the effect of this uncertainty, the following solution has been proposed as a novel treat: “Removing those wavelengths that produce negative r step value from the data set and repeating the prediction process by SVM on the new data set.” The r step for the rank n wavelength () was determined using the following formula:
TABLE 2 Optimum number of wavelengths obtained after applying equation (5)
FIGURE 5 Results of prediction by SVM using the original selected wavelengths: (a) Modulus of elasticity, (b) MC, (c) SSC, and (d) TA.
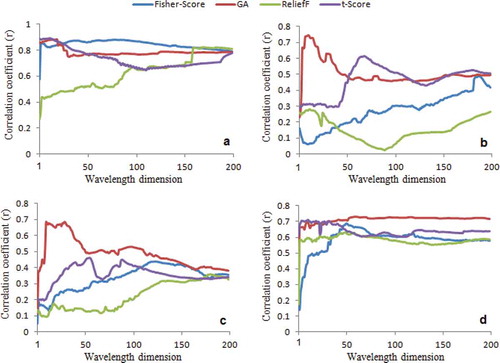
FIGURE 6 The process of merging the wavelengths selected by GA and t-Score in the fusion technique “GAt-Score” for monitoring modulus of elasticity changes in tomato fruit.
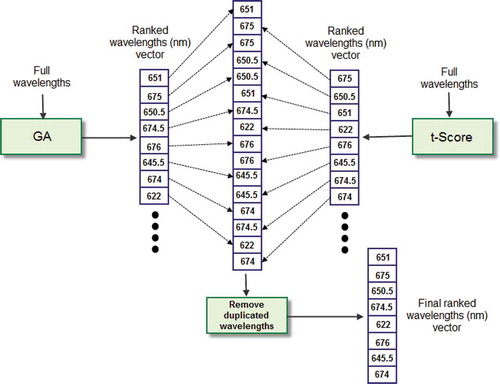
As shown in , the fusion process led to improve the performance of SVM for predicting the qualitative factors of tomato fruit compared to that presented in . Therefore, the wavelength subset selected by the fusion process is proposed. Obviously, the performance increases rapidly at small wavelength size and becomes saturated at around 11, 26, 15, and 3 for modulus of elasticity, MC, SSC, and TA, respectively (the performance even drops slightly because of the curse of dimensionality), suggesting only a few number of wavelengths are useful for prediction. The list of final selected wavelengths for monitoring internal qualitative changes in tomato fruit is shown in . Findings show that the modulus of elasticity, SSC, and TA are correlated with the chlorophyll content; while, the MC is related to the water absorption band in the shortwave near infrared range (SWNIR). The optimal wavelengths selected in this study are in good agreement with the reported works using NIR spectroscopy that the wavelength 680 nm is suitable for modulus of elasticity prediction,[Citation23] the spectral range between 800 and 1000 nm is appropriate for MC prediction,[Citation9] the spectral range between 600 and 1000 nm is more appropriate for SSC prediction,[Citation24] and the spectral range between 400 and 1000 nm is suitable for TA prediction.[Citation25]
TABLE 3 Sensitive wavelengths for internal qualitative analysis of tomato fruit
Verification of Selected Wavelengths
To verify whether selected wavelengths work the same or more efficiently as the full wavelength region and its PC scores, performance of ANN models for hyperspectral, multispectral, and backscattering imaging techniques were compared together. The ANN models had the structure known as multilayer perception (MLP) with one hidden layer, in which neurons are organized in three layers: the first is the input layer (fed by a pattern of data), the second is the hidden layer, and the last is the output layer (which provides the answer to the presented pattern). To find the optimum topology of networks in which the best prediction result is obtained, various MLPs with hidden neurons ranging from one to 20 with step size of 2 were trained, validated, and tested. For the PCA data set, a similar approach was used to find the optimum number of PC scores in the first layer of models. In developing MLP models, the tangent sigmoid and linear functions were used as the hidden and the output layer transfer functions, respectively. Training of the MLP models was performed using back propagation algorithm, which calculates the weights of the activation function for each neuron. Furthermore, the error minimization during training was carried out by gradient descent with momentum (moment coefficient: 0.6) technique.
Results of ANN prediction with the hyperspectral and multispectral data set are summarized in . Compared to the PCA of spectra, the prediction performance of entire spectra was much better since the RPD value for all tomato qualitative factors was greater than two. The lower RPD values obtained for the PCA of spectra data set result from the larger RMSEt as compared with the variability (STDVref) of the reference values of modulus of elasticity, MC, SSC, and TA. Furthermore, prediction by selected wavelengths (multispectral imaging) is encouraging too, since its statistical indicators were better than those of entire spectra and PCA of spectra for most of the qualitative factors. The reason comes from the fact that wavelengths were selected appropriately by fusion method so that a powerful correlation exists between spectral information in the selected wavelengths and fruit qualitative factors.
TABLE 4 Investigation the usefulness of selected wavelengths for tomato fruit monitoring by comparing its statistical criteria with those of entire spectra and PCA of spectra
According to the optimal wavelengths obtained, backscattering images at 660 nm were used to predict the modulus of elasticity, SSC and TA and 830 nm for MC of tomato samples by ANNs. Segmentation is an important step in processing of backscattering images, because an unsuccessful segmentation leads to lose useful information from the captured images. Segmentation involves separating the region of interest (ROI), the region containing backscattering photons without saturated sections, from the background. Since saturated sections contain photons which directly return to the CCD of camera, the light intensity values of these pixels was nearly 255. Thus, the threshold value of 252 was used to segment these regions so that pixels with intensity greater than or equal to this threshold were eliminated from the original image. The thresholding process was then completed by utilizing the Otsu’s method.[Citation26]
If the segmented backscattering image data be used directly as the input for ANN, the dimension of measurement vector will be too large. As a result, the computational complexity becomes too large and would degrade the prediction performance. Hence, segmented images were subjected to the PCA. To find the optimal number of PCs, two procedures were used: Use of cumulative variance table () and visual inspection of PC’s complemented images (). In the , the cumulative sum of the contribution from the first six variances of backscattering images at 660 and 830 nm is displayed. According to the results, the first PC contains most of the information of original image since the proportion of variance is 0.8797 and 0.7878 for 660 and 830 nm, respectively for a tomato sample. Nonetheless, visually there is low similarity between 1st PC complemented image and original segmented image. Visual correspondence between the original image and the complemented image of first four PCs appear to be appropriate for both 660 and 830 nm. Finally, the input vector to the ANN models was selected as a 200 (number of samples) × 2304 (4PCs × 576[the size of image]) matrix.
TABLE 5 Cumulative variance accounted for principal components of backscattering images of a tomato sample
FIGURE 7 The visual effect of retaining principal components (PCs) with different compression ratios (CR) for a tomato sample.
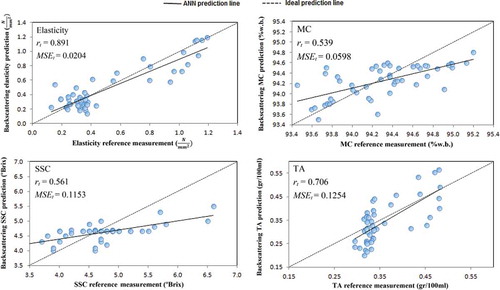
gives a scatter plot showing a correlation between backscattering imaging prediction value and reference measurement of tomato qualitative indices by the ANN prediction method. All dots represent prediction data, which are in good correlation with the reference measurement data; many points fall on or close to the unity line for modulus of elasticity and TA. The RPD value was found as 2.07, 2.41, 1.61, and 2.61 for modulus of elasticity, MC, SSC, and TA, respectively. The lower RPD value of SSC results from the narrow range of the reference values (small STDVref). The performance of backscattering imaging for predicting the MC (rt = 0.539) and SSC (rt = 0.561) was slightly lower than that of multispectral imaging. This is attributed to the fact that PCA did not provide satisfactory results for MC and SSC, since it is an unsupervised technique and as such does not include fruit quality information of the wavelengths. So there is no reason to assume that components are useful for discriminating between wavelengths in different fruit quality information. This is in agreement with the findings of Cheriyadat,[Citation27] which mathematically has pointed that PCA is not necessarily an optimal feature extraction method when the features are used in a supervised classifier. In general, backscattering imaging method provided acceptable results and confirms the usefulness of selected wavelengths for non-destructively quality assessment of tomato fruit. Use of supervised feature extraction algorithms, instead of PCA, in processing of backscattering images is advised in the future works in order to improve the overall performance of LLBI systems.
FIGURE 8 Reference determinations versus backscattering prediction for different qualitative indices of testing set data of tomato fruits.
CONCLUSIONS
The reflectance images of tomatoes were acquired using a hyperspectral imaging system for selecting the optimum wavelengths for predicting several qualitative parameters. Relief F, Fisher-Score, t-Score, and GA were applied to the spectra extracted from the hypercubes to determine the optimal wavelengths to enhance the correlation between the prediction results and reference measurements. The results of the wavelength selection procedures indicated that the fusion of a filter with a wrapper technique provides better prediction performance compared to when each of these techniques is used individually. According to the results obtained the wavelength region between 600 to 680 nm, 660 to 860 nm, 610 to 730 nm, and 620 to 710 nm are suitable, respectively, for predicting tomato modulus of elasticity, MC, SSC, and TA by a multispectral imaging system. Moreover, results indicated the possibility of developing a non-destructive technique using backscattering imaging for measuring tomato quality parameters. The ANN produced the calibration models which gave a reasonably good correlation for estimating the modulus of elasticity, SSC, and TA of tomato from backscattering images obtained at 660 nm. Similar results were found for MC prediction at 830 nm. More works are needed with respect to increase the performance of backscattering system for monitoring the quality of tomato fruit by using the advanced image processing operations.
ACKNOWLEDGMENTS
The authors would like to thank Christian Regen, Joachim Intreß, David Sakowsky, Amin Ghadiri Khozroughi, and Birgit Seifert at Leibniz Institute for Agricultural Engineering (ATB), for assistance with the experimental work.
FUNDING
The Iran’s Ministry of Science, Research, and Technology as well as University of Tehran, Grant No. 1305051/6/18, and ATB, Germany, are gratefully acknowledged for financial support provided in this research.
REFERENCES
- Butz, P.; Hofmann, C.; Tauscher, B. Recent developments in non-invasive techniques for fresh fruit and vegetable internal quality analysis. Journal of Food Science 2005, 70, 131–141.
- Sun, D.W. Hyperspectral Imaging for Food Quality Analysis and Control, Academic Press/Elsevier: San Diego, CA, 2010.
- Gowen, A.A.; O’Donnell, C.P.; Taghizadeh, M.; Cullen, P.J.; Frias, J.M.; Downey, G. Hyperspectral imaging combined with principal component analysis for bruise damage detection on white mushrooms (Agaricus bisporus). Journal of Chemometrics 2008, 22, 259–267.
- Mollazade, K.; Omid, M.; Akhlaghian Tab, F.; Mohtasebi, S.S. Principles and applications of light backscattering imaging in quality evaluation of agro-food products: A review. Food and Bioprocess Technology 2012, 5 (5), 1465–1485.
- Liu, Y.; Chen, Y.R.; Kim, M.S.; Chan, D.E.; Lefcourt, A.M. Development of simple algorithms for the detection of fecal contaminants on apples from visible/near infrared hyperspectral reflectance imaging. Journal of Food Engineering 2007, 81 (2), 412–418.
- Chao, K.; Yang, C.C.; Chen, Y.D.; Kim, M.S.; Chan, D.E. Fast line-scan imaging system for broiler carcass inspection. Sensing and Instrumentation for Food Quality and Safety 2007, 1, 62–71.
- Peng, Y.; Wu, J. Hyperspectral scattering profiles for prediction of beef tenderness. Proceeding of Annual International Meeting for ASABE 2008, Providence, RI, June 29--July 2; Paper No. 080004.
- Peng,Y.; Zhang, J.; Wu, J.; Hang, H. Hyperspectral scattering profiles for prediction of the microbial spoilage of beef. Proceedings of the SPIE 2009, 7315,73150Q-73150Q-12.
- Qing, Z.; Ji, B.; Zude, M. Wavelength selection for predicting physicochemical properties of apple fruit based on near infrared spectroscopy. Journal of Food Quality 2007, 30, 511–526.
- Shao, Y.; Bao, Y.; He, Y. Visible/near-infrared spectra for linear and nonlinear calibrations: A case to predict soluble solids contents and pH value in peach. Food and Bioprocess Technology 2011, 4 (8), 1376–1383.
- ElMasry, G.; Wang, N.; ElSayed, A.; Ngadi, M. Hyperspectral imaging for non-destructive determination of some quality attributes for strawberry. Journal of Food Engineering 2007, 81, 98–107.
- Singh, C.B.; Jayas, D.S.; Paliwal, J.; White, N.D.G. Fungal damage detection in wheat using short-wave near-infrared hyperspectral and digital colour imaging. International Journal of Food Properties 2012, 15 (1), 11–24.
- Nicolai, B.M.; Beullens, K.; Bobelyn, E.; Peirs, A.; Saeys, W.; Theron, K.I.; Lammertyn, J. Non-destructive measurement of fruit and vegetable quality by means of NIR spectroscopy: A review. Postharvest Biology and Technology 2007, 46, 99–118.
- Zhao, Z.; Morstatter, F.; Sharma, S.; Alelyani, S.; Anand, A.; Liu, H. Advanced Feature Selection Research-ASU Feature Selection Repository. Technical Report; Arizona State University: USA, 2010.
- Leardi, R. Application of genetic algorithm-PLS for feature selection in spectral data set. Journal of Chemometrics 2000, 14, 643–655.
- Wang, R.J.; Hu, M.L. Antioxidant capacities of fruit extracts of five mulberry genotypes with different assays and principle components analysis. International Journal of Food Properties 2011, 14 (1), 1–8.
- Baranyai, L.; Zude, M. Analysis of laser light propagation in kiwi fruit using backscattering imaging and Monte Carlo simulation. Computers and Electronics in Agriculture 2009, 69, 33–39.
- Mollazade, K.; Omid, M.; Arefi, A. Comparing data mining classifiers for grading raisins based on visual features. Computers and Electronics in Agriculture 2012, 84, 124–131.
- Kamruzzaman, M.; ElMasry, G.; Sun, D.W.; Allen, P. Prediction of some quality attributes of lamb meat using near-infrared hyperspectral imaging and multivariate analysis. Analytica Chimica Acta 2012, 714, 57–67.
- Mohsenin, N.N. Physical Properties of Plant and Animal Materials, Gordon and Breach Science: New York, NY, 1986.
- Tung-Sung, C.; Siddiq, M.; Sinha, N.; Cash, J. Commercial pectinase and the yield and quality of Stanley plum juice. Journal of Food Processing and Preservation 1995, 19, 89–101.
- Mak, M.W.; Kung, S.Y. Fusion of feature selection methods for pairwise scoring SVM. Neurocomputing 2008, 71, 3104–3113.
- Moons, E.; Dardnne, P.; Dubois, A.; Sindic, M. Non-destructive visible and NIR spectroscopy measurement for the determination of apple internal quality. Acta Horticulturae 1997, 517, 441–448.
- McGlone, V.A.; Jordan, R.B.; Martinsen, P.J. Vis/NIR estimation at harvest of pre and post storage quality indices for “Royal Gala” apple. Postharvest Biology and Technology 2002, 25 (2), 135–144.
- Cozzolino, D.; Esler, M.B.; Dambergs, R.G.; Cynkar, W.U.; Boehm, D.R.; Francis, I.L.; Gishen, M. Prediction of colour and pH in grapes using diode array spectrophotometer (400–1100 nm). Journal of Near Infrared Spectroscopy 2004, 12, 105–111.
- Gonzalez, R.C.; Woods, R.E.; Eddins, S.L. Digital Image Processing using MATLAB, Pearson Prentice Hall: New Jersey, 2004.
- Cheriyadat, A. Why principal component analysis is not an appropriate feature extraction method for hyperspectral data. Proceedings: Geoscience and Remote Sensing Symposium, IGARSS ‘03 2003, Toulouse, France, July 21–25; 6, 3420–3422.
- Duda, R.O.; Hart, P.E.; Stork, D.G. Pattern Classification, John Wiley & Sons Press: New York, NY, 2001.
- Liu, H.; Motoda, H. Computational Methods of Feature Selection, Chapman & Hall/CRC Press: Boca Raton, FL, 2008.
- Zhao, Z.A.; Liu, H. Spectral Feature Selection for Data Mining, Chapman & Hall/CRC Press: Boca Raton, FL, 2011.