
Abstract
A hyperspectral imaging system has been built for detecting external insect damage and acquiring reflectance images from jujubes in the near-infrared region of 900–1700 nm. Spectral information was extracted from each jujube, and six optimal wavelengths (987, 1028, 1160, 1231, 1285, and 1464 nm) were obtained using principal component analysis. The first principal component images (PC-1) using the selected six wavelengths were obtained for further image processing. The detection algorithm was then developed based on principal component analysis and two-band ratio (R1160/R1464) coupled with image subtraction algorithm (R1160-R1464). An identification accuracy of 93.1% for insect-infested jujubes and 100% classification rate for the intact ones were achieved. The results of this research demonstrated that it is feasible to discriminate insect-infested jujubes from intact jujubes using the near-infrared hyperspectral imaging technology.
INTRODUCTION
Zizyphus jujuba Mill.cv. “Lingwu Changzao,” also called Ningxia Changzao, is one of the fine fresh-eating varieties with over 800 years history of cultivation in China. It is favored because of its thin edible skin, sweet whitish flesh, and pleasant flavor. As the origin of jujube fruit, the planting area and production of “Lingwu Changzao” in Ningxia ranks first in China. Over the past ten years, Lingwu City in Ningxia Hui Autonomous Region has increased its fruit export to many countries. Long-distance transportation requires delivering higher quality and more consistent fresh jujube fruit from the origin in order to meet the quality standards upon arrival at the destination.[Citation1,Citation2]
Accurate evaluation of jujube quality is challenging because the individual fruit is small and has great variations in external as well as internal quality characteristics. Insect damage consists of internal and external insect infestations. The internal infesting insects lay their eggs within the jujube, so their larvae can feed on the inside, external infesting insects feed on the outside of the jujube. The external defects such as mildew, insect damage, bird pecks, and phytotoxicity seriously affect the quality of red jujubes, and thus, external insect damage is a key indicator for assessing external quality of jujube fruits. So it is necessary to remove the defect ones from the normal ones. Insects cause severe damages to jujube fruits by darkening the skin color of the fruits and making holes on the surface. Carposina niponensis walsingham is a particularly problematic pest that causes external damage to jujubes. Its larvae often bore holes from the jujube fruits’ surface into the interior of the jujube where they are fed until maturity, which will result in the lost of the commodity value of the jujube fruit completely.[Citation3] Moreover, the presence of a few jujube fruits with insect damage in a shipment may render the whole shipment unmarketable. So it is of particular interested for the producers or industries to detect such surface defect on insect-infested fruits and eliminate the problematic ones before shipment. Manual removal of insect-infested jujubes is tedious, time-consuming, and inefficient. Therefore, it is important to develop a system that can efficiently identify insect damage and assure fruit quality and safety, which would increase the marketability and enhance or maintain the shelf life of jujubes.[Citation4]
In the past 20 years, non-destructive methods of detecting the fruit and vegetable quality have received increasing attention, such as machine vision for shape classification and defect detection,[Citation5−Citation7] x-ray imaging for inspection internal quality,[Citation8,Citation9] and near-infrared (NIR) spectroscopy for prediction internal quality of fruit.[Citation10−Citation12] However, machine vision has been found to be unreliable because other kinds of surface damage may leave marks that are similar to holes.[Citation13] X-ray imaging is not practical for online detection.[Citation14] NIR spectroscopy can’t be used to collect spatial information of fruits quality as a point-source detection technique.
Hyperspectral imaging is a rapid, non-destructive technique which combines conventional spectroscopy and imaging techniques to acquire both spectral and spatial information from the fruits simultaneously.[Citation15] It has more advantages for evaluating fruit quality in an in-line system based on multispectral imaging where only the optimal wavelengths are inspected. Example applications of hyperspectral imaging include detecting bruises and other defects on apples,[Citation16−Citation19] identifying citrus canker in grapefruit and resulting in 100% classification,[Citation20] discriminating internal infestation in Montmorency tart cherry,[Citation21−Citation23] distinguishing insect-damaged wheat kernels,[Citation24] and detecting insect-damaged vegetable soybeans.[Citation1] Numerous research articles have been published about discriminating insect damage in many fruit cultivars. However, relatively few studies have been specifically targeted on external insect damage in the jujube. Therefore, the goal of this research is to combine image processing algorithm with spectral information to identify insect-infested jujubes from intact jujubes.
The objectives of this research were to: (1) build a NIR hyperspectral imaging system in the spectral range of 900–1700 nm and collect the hyperspectral image data, (2) determine the optimal wavelength for detecting of external insect infestations on jujube fruits, and (3) develop an image processing algorithm and discriminate insect-infested jujubes from intact jujubes.
MATERIALS AND METHODS
Jujube Samples
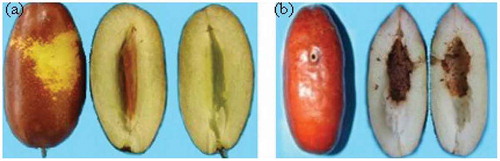
A total of 80 intact jujubes (Zizyphus jujuba Mill. cv. “Lingwu Changzao”) and 160 external insect-infested jujubes were collected from two different commercial orchards in Ningxia, China on October 8, 2012. The morphological properties of each sample were measured and recorded before spectroscopic measurements (). All jujube samples were stored at refrigerated temperature (4°) and used for the experiments within one week. Jujubes were removed from cold storage three hours before the experiments started in order to let them reach room temperature (22°). Representative images for intact jujubes and external insect-infested jujubes were shown in .
TABLE 1 Morphological properties of the jujube samples studied
FIGURE 1 Typical surface conditions of jujube sample: (a) the intact jujubes, (b) the external insect-infested jujubes.
Hyperspectral Imaging System
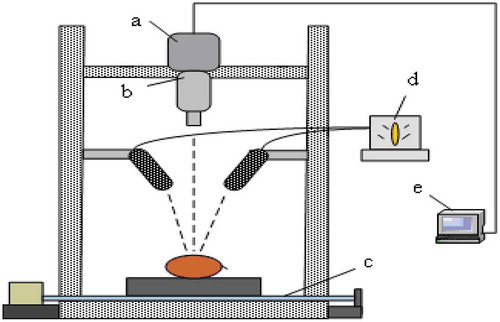
A hyperspectral imaging system with a spatial resolution of approximately 5 nm was developed for acquiring reflectance images from the jujube samples, and its schematic diagram was shown in . The system consists of five major parts: a high-performance back-illuminated CCD camera (Zelos-285GV, Kappa optronics GmbH, Gleichen, Germany) with 1392 effective pixels; an imaging spectrograph (Imspector N17E, Spectral Imaging Ltd., Oulu, Finland) coupled with a standard C-mount zoom lens (V23-f/2.4, Specim Ltd., Finland) in the spectral region of 900–1700 nm; a sample transportation plate (PSA200-11-X, Zolix Instruments Co. Ltd., Beijing, China); four 35 Watt (W) tungsten halogen lamps as light source (HSIA-LS-TDIF, Zolix instruments Co., Ltd, Beijing, China); and a computer (Lenovo Inter (R) Core [email protected] GHz, RAM 4.00G). The spectral range of the hyperspectral camera is from 900 to 1700 nm with 3 nm spectral intervals, which results in 256 spectral bands.
FIGURE 2 Schematic diagram of the hyperspectral imaging system: (a) a CCD camera; (b) an imaging spectrograph with a standard C-mount zoom lens; (c) a sample transportation plate; (d) a tungsten halogen lighting unit; (e) a computer.
Hyperspectral Image Acquisition and Calibration
The hyperspectral imaging system is a push broom and line-scan based imaging system. The laboratory-based system was operated in a dark inspection chamber where the halogen lights were the only light source. The exposure time was adjusted to 10 ms and the speed of fruit movement was adjusted to 1.3 cm/s throughout the test. The object distance was set at 42 cm. The camera and spectrograph were used to scan the jujube fruit line-by-line as the translation plate moved the jujube through the field of view of the optical system. After finishing the scans on one entire jujube fruit, the spatial-by-spectral matrices were combined to construct a three-dimensional (3D, 320 pixels × 300 pixels × 256 bands) spatial and spectral data cube. The hyperspectral images were calibrated with a white and a dark reference images. The corrected image (R) was calculated using Eq. (1).[Citation25−Citation27]
where, Ro is the recorded hyperspectral image, Rd the dark image (with 0% reflectance) recorded by turning off the lighting source with the lens of the camera completely closed, and Rr is the white reference image (Teflon white board with 99% reflectance). The corrected images will be the basis for the subsequent image analysis.
Data Processing and Analyzing
All data processing and analyzing were performed using ENVI 4.6 (Research System Inc., Boulder, CO, USA) and Matlab2008a (The MathWorks Inc., Natick, USA) with the image processing toolbox. Principal component analysis (PCA) on the hyperspectral images of jujubes was performed with ENVI 4.6. The PCA is a technology to reduce spectral dimensionality of the hyperspectral reflectance images, and to aid in visualizing the hyperspectral data. Then several optimal spectral wavelengths were chosen according to corresponding weighing coefficients of the PCA. The first principal components was adopted to eliminate the effects of bright spots and enhance the spectral differences among the bands. Finally, the PC-1 scores images by performing PCA on the selected optimal wavelengths were used for further image processing (masked image, image negation, thresholding, dilation, connectivity analysis) to discriminate external insect damage from jujube fruits.
Band ratio and image subtraction were evaluated to improve the detection rates of insect-infested jujubes by reducing the number of false positives. A band ratio algorithm could effectively enhance the contrast between different regions and produce more uniform responses across the jujube surface.[Citation28] The two-band ratio was calculated using Eq. (2):
where, Qt/k represents a quotient of spectral reflectances, and Rt and Rk are reflectance intensities at t nm and k nm, respectively. Image subtraction was a process whereby the digital numeric value of one pixel or whole image was subtracted from another image. The difference between two images f (x,y) and h (x,y), expressed as:
Equation (3) is obtained by computing the difference between all pairs of corresponding pixels from f and h.[Citation29]
RESULTS AND DISCUSSION
Hyperspectral Reflectance Spectra
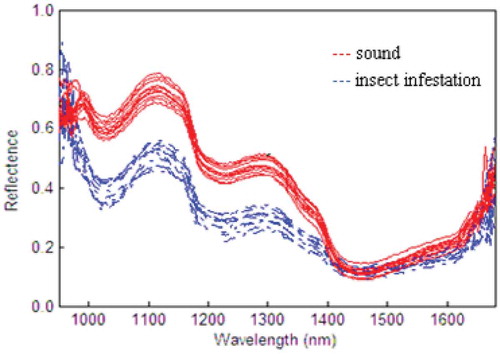
Hyperspectral imaging data contained both spatial and spectral information from jujubes, each pixel on a jujube fruit corresponded to one spectrum. The average spectra of insect-infested jujubes were obtained by choosing 3 × 3 pixels of each jujube around the insect-holes and outside of the insect-holes. The average spectra of intact jujubes were selected 3 × 3 pixels of each jujube, the corresponding area of insect-infested jujubes (). The average spectral curves of the insect-infested jujubes and intact jujubes showed a downward trend and the potential peaks and valleys appeared in the wavelength range between 900 and 1700 nm. The noise spectrum was obvious below 975 nm and above 1650 nm. Therefore, the representative regions of interest (ROIs) in the wavelength range of 975–1650 nm were used to perform PCA for further analysis. Moreover, the reflectance for insect-infested jujubes had a much lower value than that for the intact fruits, especially for the wavelength regions below 1400 nm. The jujube surface was damaged by insects, which provided with more chances for light to interfer with the cellular material. Therefore, lights would be more absorbed and scattered. As expected, the insect-infested jujubes had a higher absorbance than the intact fruits due to the decreased reflectance of the insect-infested jujubes surface.
FIGURE 3 Average spectral curves (900–1700 nm) for intact jujubes and insect-infested jujubes.
PCA in the NIR Region of the Spectrum
The first three PC scores images (denoted by PC-1 to PC-3) of jujube samples obtained from PCA using all 227 wavebands in the region from 975 to 1650 nm were shown in . In the PC-1 images, the differences of gray value were smaller between insect parts and the surrounding area, they could not provide more unique features than the original untransformed hyperspectral images. The PC-2 images indicated that the gray value showed significant differences between the insect part and the surrounding area. The insect-infested regions could be clearly identified. In the PC-3 images, the transformed image no longer possessed meaningful information, and they were not as useful as PC-2 for the detection of external insect damage from jujube fruits. Therefore, PC-2 images were chosen for the selection of optimal spectral wavelengths.
FIGURE 4 First three principal component images obtained using the spectral region from 975 to 1650 nm for insect-infested jujubes. PC-1 to PC-3 are the scores images of first, second, and third principal components, respectively.
Selection of Optimal Spectral Wavelengths
The weighing coefficients plot for the PC-2 images from PCA on the 975–1650 nm spectral region was shown in . In this article, the selection of optimal spectral wavelengths was based primarily on the following two principles: (1) the absolute values of weighing coefficients at wavelengths were in larger ones; (2) The wavelength should appear the potential peaks and valleys in the weighing coefficients curve.[Citation30] Six wavebands from 975 to 1650 nm were chosen, which were centered at around 987, 1028, 1160, 1231, 1285, and 1464 nm, respectively. Example images of jujube at each optimal wavelength were shown in .
FIGURE 5 Weighing coefficients for PC-2 images on a insect-infested jujube using the spectral region of 975–1650 nm.
FIGURE 6 Images of jujube at six optimal wavelengths.
PCA on Selected Optimal Wavelengths
The uneven intensity of light could be formed in different bands because the jujubes are oval fruits. Therefore, it was of great significance to adopt PCA method on selected optimal wavelengths to eliminate the influence of the high brightness area on image processing. PCA was carried out with only six optimal wavelengths. The PCA scores images of jujube were shown in . The contrast between the sound and damaged tissue appeared differently for each PCA scores image.
FIGURE 7 Six principal component images by PCA based on the six optimal wavelengths (987, 1028, 1160, 1231, 1285, and 1464 nm). PC-1 to PC-6 were the first, second, third, fourth, fifth, and sixth principal components, respectively.
As shown in , the insect-infested regions in PC-3 images were not as evident as those in PC-1 and PC-2 images due to the lack of contrast. The PC-4 to PC-6 might be inadequate for reliable detection of insect-infested jujube due to the noisy information. Based on the inspection and the comparisons above, the PC-1 images showed greater potential for indentifying insect-infested jujubes from the intact jujubes, compared to PC-2. Therefore, PC-1 images were chosen for performing the images processing.
The detailed procedures for detecting insect-infested jujubes were illustrated in . First, a single-band image at 1455 nm was used to build a mask template. Images at six selected wavelengths were masked analysis to remove the background that could impact results. Second, the PCA was performed on spectral imaging data at these six wavelengths. Then, the PC-1 scores images were chosen for determining the quality of a jujube.
FIGURE 8 Flow chart of the key steps involved in detection algorithm of insect-infested jujubes.
Two-Band Ratios Algorithm
Based on the spectral curves in , the two-band ratio using 987 and 1464 nm pair, 1160 and 1464 nm pair and 1285 and 1464 nm pair could be potential to detect insect-infested jujubes because the reflectance spectra of insect-infested tissue exhibited local minimum value at 1464 nm, and local maximum values at 987, 1160, and 1285 nm. The ratio images were shown in . By visual observation, the R1160/R1464 ratio images distinguished the insect-infested region clearly from the sound surface (white dot area in ), where two strong absorption peaks at 1160 and 1464 nm may be associated with a combination of second overtone of band C-H and overtones of band O-H in H2O, and first overtone of bond O-H, respectively.[Citation31] The ratio images with R987/R1464 and R1285/R1464 did not work the same effectively as R1160/R1464. A global threshold value of 0.7 was applied to the ratio image of R1160/R1464 to separate insect-infested jujubes from the intact jujubes. The flowchart based on band ratio algorithm was shown in and the detection rate was given in .
TABLE 2 Test results for developed algorithms based on 240 independent samples with intact jujubes and insect-infested jujubes
FIGURE 9 Example two-band ratio images (R987/R1464, R1160/R1464, and R1285/R1464).
FIGURE 10 Flow chart of the key steps involved in two-band ratios algorithm and image subtraction algorithm of insect-infested jujubes.
Image Subtraction Algorithm
Image subtraction algorithm was used to identify small changes between images of insect-infested jujubes and intact jujubes. Like two-band ratios algorithm, the R987–R1464 and R1285 -- R1464 subtraction images were ineffective in producing images for distinguishing insect-infested jujubes. However, the R1160 -- R1464 subtraction images showed a clear insect-infested region (black area in ), but jujube surface exhibiting whiter features. Two wavebands images at 1160 and 1464 nm were effective for detecting insect damage through many experiments. Therefore, the images at 1160 and 1464 nm were first used to produce subtraction image (R1160 -- R1464). The flowchart based on image subtraction algorithm was shown in .
FIGURE 11 Representative two-band ratio images (R987–R1464, R1160–R1464, and R1285 -- R1464).
Identification Results
The algorithms for multispectral image processing and classification described above were evaluated using 240 independent jujube samples. The test results for intact jujubes and insect-infested jujubes were shown in . A total of 240 jujubes were divided into two classes: intact jujubes including 80 samples, and insect-infested jujubes including 160 samples. All samples were evaluated using three detection methods: The first method was PCA method on selected optimal wavebands; the second method was PCA and two-band ratio (R1160/R1464); and the third method was PCA and two-band ratio (R1160/R1464) combined with image subtraction algorithm (R1160 -- R1464). As shown in , the overall detection accuracy for the tested samples of insect-infested jujubes was 79.4, 87.5, and 93.1%, and 97.5, 100, and 100% for the intact jujubes based on three methods, respectively.
CONCLUSIONS
The goal of this research was to investigate the feasibility of using hyperspectral imaging technique for detecting insect-infested jujubes in the wavelength range between 900 and 1700 nm. PCA was used to reduce high spectral dimension to a few optimal wavelengths centered at 987, 1028, 1160, 1231, 1285, and 1464 nm. PCA and two-band ratio (R1160/R1464) coupled with image subtraction algorithm (R1160 -- R1464) achieved the best 93.1% insect-infested jujubes identification accuracy. Although this study demonstrated that hyperspectral imaging technique is promising for detection of intact jujubes and insect-infested jujubes in practical applications, the selected optimal wavelengths at 987, 1028, 1160, 1231, 1285, and 1464 nm may not always the best to develop algorithm for all jujube fruit due to the limited sample size. Therefore, future research will focus on (1) increasing the sample size to make the algorithm more robust, (2) integrating PCA on selected optimal wavelengths and two-band ratio combined with image subtraction algorithm into a new algorithm for simplifying algorithms and increasing detection accuracy, and (3) developing an efficient multispectral imaging system for the on-line detection of insect-infested jujubes from intact jujubes.
ACKNOWLEDGMENT
The authors gratefully acknowledge the guidance from Professor He for this experiment.
FUNDING
The authors are grateful for the financial support from the National Natural Fund Committee (31060233), Key Project in the National Science & Technology Pillar Program during the Twelfth Five-year Plan Period (2012BAF07B06), and Technologies R & D Program of Ningxia Hui Autonomous Region in 2011.
Additional information
Funding
Related Research Data
REFERENCES
- Huang, M.; Wan, X.M.; Zhang, M.; Zhu, Q.B. Detection of insect-damaged vegetable soybeans using hyperspectral transmittance image. Journal of Food Engineering 2013, 116, 45–49.
- Wang, J.; Nakano, K.; Ohashi, S. Nondestructive evaluation of jujube quality by visible and near-infrared spectroscopy. LWT-Food Science and Technology 2011a, 44, 1119–1125.
- Wang, J.; Nakano, K.; Ohashi, S. Nondestructive detection of internal insect infestation in jujubes using visible and near-infrared spectroscopy. Postharvest Biology and Technology 2011b, 59, 272–279.
- Qin, J.W.; Thomas, F.B.; Mark, A.R.; Gordon, B.W. Detection of citrus canker using hyperspectral reflectance imaging with spectral information divergence. Journal of Food Engineering 2009, 93, 183–191.
- Throop, J. A.; Aneshansley, D.J.; Anger, W.C.; Peterson, D.L. Quality evaluation of apples based on surface defects: Development of an automated inspection system. Postharvest Biology and Technology 2005, 36, 281–290.
- Zhu, B.; Jiang, L.; Luo, Y.G.; Tao, Y. Gabor feature-based apple quality inspection using kernel principal component analysis. Journal of Food Engineering 2007, 81, 741–749.
- Zou, X.B.; Zhao, J.W.; Li, Y.X.; Mel, H. In-line detection of apple defects using three color cameras system. Computers and Electronics in Agriculture 2010, 70, 129–134.
- Kim, S.; Schatzki, T.F. Apple watercore sorting system using x-ray imagery: I. Algorithm development. Transactions of the ASAE 2000, 43, 1695–1702.
- Kotwaliwale, N.; Weckler, P.R.; Brusewitz, G.H.; Kranzler, G.A.; Maness, N.O. Non-destructive quality determination of pecans using soft X-rays. Postharvest Biology and Technology 2007, 45, 372–380.
- Lammertyn, J.; Nicolaï, B.; Ooms, K.; Smedt, V.D.; Baerdemaeker, J.D. Non-destructive measurement of acidity, soluble solids, and firmness of Jonagold apples using NIR-spectroscopy. Transactions of the ASAE 1998, 41, 1089–1094.
- Liu, Y.D.; Sun, X.D.; Aiguo, O. Nondestructive measurement of soluble solid content of navel orange fruit by visible-NIR spectrometric technique with PLSR and PCA-BPNN. LWT - Food Science and Technology 2010, 43, 602–607.
- Marc, V.; Riccardo, L.; Guy, S.; Giorgio, L.; Jean, P.P. Multivariate calibration of mango firmness using vis/NIR spectroscopy and acoustic impulse method. Journal of Food Engineering 2009, 94, 7–13.
- Muhammad, M.; Peeyush, S. Development of an automatic grading machine for oil palm fresh fruits bunches (FFBs) based on machine vision. Computers and Electronics in Agriculture 2013, 93, 129–139.
- Wang, J.; Nakano, K.; Ohashi, S. Nondestructive detection of internal insect infestation in jujubes using visible and near-infrared spectroscopy. Postharvest Biology and Technology 2011, 59, 272–279.
- ElMasry, G.; Sun, D.W.; Allen, P. Near-infrared hyperspectral imaging for predicting colour, pH, and tenderness of fresh beef. Journal of Food Engineering 2012, 110, 7–140.
- Lu, R. Detection of bruises on apples using near-infrared hyperspectral imaging. Transactions of the ASAE 2003, 46, 523–530.
- Mehl, P.M.; Chen, Y.R.; Kim, M.S.; Chan, D.E. Development of hyperspectral imaging technique for detection of apple surface defects and contaminations. Journal of Food Engineering 2004, 61, 67–81.
- Nicolaï, B.M.; Lötze, E.; Peirs, A.; Scheerlinck, N.; Theron, K.I. Non-destructive measurement of bitter pit in apple fruit using NIR hyperspectral imaging. Postharvest Biology and Technology 2006, 40, 1–6.
- Xing, J.; Saeys, W.; Baerdemaeker, J.D. Combination of chemometric tools and image processing for bruise detection on apples. Computers and Electronics in Agriculture 2007, 56, 1–13.
- Balasundaram, D.; Burks, T.F.; Bulanon, D.M.; Schubert, T.; Lee, W.S. Spectral reflectance characteristics of citrus canker and other peel conditions of grapefruit. Postharvest Biology and Technology 2009, 51, 220–226.
- Xing, J.; Guyer, D. Comparison of transmittance and reflectance to detect insect infestation in Montmorency tart cherry. Computers and Electronics in Agriculture 2008a, 64, 194–201.
- Xing, J.; Guyer, D. Detecting internal insect infestation in tart cherry using transmittance spectroscopy. Postharvest Biology and Technology 2008b, 49, 411–416.
- Xing, J.; Guyer, D.; Ariana, D.; Lu, R. Determining optimal wavebands using genetic algorithm for detection of internal insect infestation in tart cherry. Sensing and Instrumentation for Food Quality and Safety 2008, 2, 161–167.
- Chandra, B.S.; Digvir, S.J.; Jitendra, P.; Noel, D.G.W. Identification of insect-damaged wheat kernels using short-wave near-infrared hyperspectral and digital colour imaging. Computers and Electronics in Agriculture 2010, 73, 118–125.
- Mehl, P.M.; Chao, K.; Kim, M.; Chen, Y.R. Detection of defects on selected apple cultivars using hyperspectral and multispectral image analysis. Applied Engineering in Agriculture 2002, 18, 219–226.
- Xing, J.; Bravo, C.; Jancsók, P.T.; Ramon, H.; Baerdemaeker, J.D. Detecting bruises on “Golden Delicious” apples using hyperspectral imaging with multiple wavebands. Biosystems Engineering 2005, 90, 27–36.
- ElMasry, G.; Wang, N.; Vigneault, C. Detecting chilling injury in Red Delicious apple using hyperspectral imaging and neural networks. Postharvest Biology and Technology 2009, 52, 1–8.
- Vargas, A.M.; Kim, M.S.; Tao, Y.; Lefcourt, A.M.; Chen, Y.R.; Luo, Y.; Song, Y.S.; Buchanan, R. Defection of fecal contamination on cantaloupes using hyperspectral fluorescence imagery. Journal of Food Science 2005, 70, 471–476.
- Rafael, C.G.; Richard, E.W. Digital Image Processing, 2nd Ed; Pearson: London, 2002.
- Liu, F.; Wang, L.; He, Y. Application of effective wavelengths for variety identification of instant milk teas. Journal of Zhejiang University (Engineering Science) 2010, 44, 619–623.
- Li, J.B.; Huang, W.Q.; Zhao, C.J.; Zhang, B.H. A comparative study for the quantitative determination of soluble solids content, pH, and firmness of pears by is/NIR spectroscopy. Journal of Food Engineering 2013, 116, 324–332.