
Abstract
This study was carried out to determine the phytochemical and antioxidant properties of two pigmented rice cultivars viz., Lingkang taker ame, Umling ame, and a non-pigmented rice Pungpo taker ame. Fourier transform infrared and high-performance liquid chromatography analysis of phenolic compounds were carried out for the rice cultivars. The highest level of total phenolic, anthocyanin, and scavenging activities were observed in Umling ame cultivar. Fourier transform infrared result of rice cultivars showed wide range of frequency (1131.60–3538.75 cm–1) which confirmed the presence of various phenolic compounds. Seven phenolic acids were detected in the rice cultivars. The highest value of salicylic acid (302.06 ± 0.01 mg/L), ferulic acid (17.21 ± 0.02 mg/L), apigenin (7.03 ± 0.01 mg/L), and gallic acid (0.98 ± 0.04 mg/L) were detected in Umling ame; whereas the highest value of quercetin (611.46 ± 0.01 mg/L) and caffeic acid (1.83 ± 0.01 mg/L) were found in Pungpo taker ame and Lingkang taker ame cultivars, respectively. Results revealed that the colored rice Umling ame showed higher phenolic content than other two rice cultivars Lingkang taker ame and Pungpo taker ame.
Introduction
Rice (Oryza sativa L.) is a global staple food and is consumed as a whole grain. Although white rice is commonly consumed, there are several rice cultivars containing color pigments and usually known as black, purple, and red rice. Pigmented rice has been reported to be an excellent source of phenolic compounds. Therefore, pigmented rice has an impact on human consumption due to its substantial antioxidant content. The North Eastern part of India, which has diverse physiographic and agroclimatic landscapes, is considered as the most biodiversified rice-rich region. According to Hore,[Citation1] the state of Arunachal Pradesh itself yielded around 616 germplasm collections of rice from 1987 to 2002. Most of the rice cultivars grown in Arunachal Pradesh are underutilized and commonly have whitish kernels. But there are also some varieties with a colored testa (black, purple, or red) that give slightly colored kernels on milling.[Citation2] The various types of rice are generally categorized on the basis of amylose content. The proportion of amylose (and amylopectin) in the starch is predominantly responsible for the different physicochemical and cooking properties of the rice kernel. The categories of rice on the basis of amylose content are high amylose, intermediate amylose, low amylose, and waxy rice types.[Citation3] Functional properties of rice such as gelatinization, rheology, and gel consistency are vital for effective use of rice in food systems and depend on the amylose content. Moreover, some of the underutilized rice cultivars of Arunachal Pradesh are pigmented rice. Pigmented rice is rich source of bioactive compounds, such as phenolic acid, anthocyanin, flavones, etc. All bioactive compounds are important for human health because of their pharmacological activities as radical scavengers. Recent interest in these substances has been stimulated by the potential health benefits arising from the antioxidant activities of these polyphenolic compounds. Pigmented rice is reported to have a health-promoting potential due to its substantial antioxidant content which inhibits the formation or reduces the concentrations of reactive cell-damaging free radicals.[Citation4,Citation5] The present investigation reports and compared the phytochemical properties and antioxidant activities of different underutilized pigmented and non-pigmented rice cultivars from Arunachal Pradesh viz., Lingkang taker ame (LA; red rice), Umling ame (UA; red rice), and Pungpo taker ame (PA; white rice).
Materials and Methods
Materials
Three rice (Oryza sativa L.) cultivars viz., LA (red rice), UA (red rice), and PA (white rice) were collected from the rice cultivators of Arunachal Pradesh, India. All the rice samples were cleaned and packed in polyethylene bags and stored at ambient temperature.
Proximate Compositions
The moisture, ash, total carbohydrate, starch content, crude protein, crude fat, and amylose contents were analyzed using standard methods.[Citation6]
Phytochemicals and Antioxidant Activities
Sample extraction
Sample preparation was done according to the method describe by Atala.[Citation7] Three rice cultivars (10 g each) were powdered in a grinder. The ground sample was extracted with 100 mL of extraction solvent (75:25 v/v, acetone: water). Extracts were shaken in a water bath at 25°C for 90 min, and centrifuged in refrigerated condition (SIGMA Laborzentrifugen, 3-18 KS, Osterode, Germany) at 950 g for 15 min. Supernatant was stored at −20°C for further analysis.
Total phenolics content
Modified version of the Folin–Ciocalteu assay[Citation8] was used to determine the total phenolic content in the extracts from the three different rice cultivars. Gallic acid was used for preparation of standard curve at various concentrations. Independently extract (20 μL each), gallic acid, and blank were prepared and mixed with 1.58 mL distilled water. Folin–Ciocalteu reagent (100 μL) was added to 300 μL of sodium carbonate within 8 min. The samples were vortexed immediately and incubated for 30 min at 40°C. The absorbance was measured at 765 nm in ultraviolet-visible (UV-VIS) spectrophotometer (Spectrascan UV-2600, Thermo Fisher Scientific, Nasik, India). The phenolic content was expressed in mg GAE/100 g.
Total monomeric anthocyanin
The monomeric anthocyanin content of extracted solutions were determined using the pH differential method.[Citation9] Absorbance was measured at 515 and 700 nm. Anthocyanin was calculated as cyanidin-3-glucoside using a molar extinction coefficient of 26,900 and a molecular weight of 449.2.
where DF was dilution factor, MW cyanidin-3-glucoside molecular weight (449.2), and ε molar absorptivity (26,900). All measurements were done in duplicates.
Determination of 2, 2-diphenyl-1-picrylhydrazyl (DPPH) radical scavenging activity
DPPH radical-scavenging activity of rice extracts were evaluated according to Brand-Williams, Cuvelier, and Berset[Citation10] method. Briefly, extracts (100 µL) were taken and added to 1.4 mL DPPH radical methanolic solution (10–4 M). After a 30 min incubation period, absorbance reading was taken at 517 nm using a spectrophotometer (Chemito, Spectrascan UV 2600, double-beam UV-VIS Spectrophotometer Thermo Scientific). The percentage of radical-scavenging activity was calculated using the formula:
where Ao is absorbance of control blank and As is absorbance of sample extract.
Metal chelating activity
Metal chelating activity was done as per method described by Dinis.[Citation11] Ferric chloride (50 μL of 2 mM) was added to 1 mL of different concentrations of the extract (0.2, 0.4, 0.8, 1.6, and 3.2 mg/mL) and 0.2 mL of 5 mM ferrozine solution was added. The mixture was vigorously shaken and kept at room temperature for 10 min. The absorbance reading was taken at 562 nm. The percentage inhibition of ferrozine–Fe2+ complex formation was calculated as [(Ao – As)/As] ×100, where A0 was the absorbance of the control and As was the absorbance of the extract. Ethylenediaminetetraacetic acid (EDTA) was used as standard.
Reducing power
The method of Oyaizu[Citation12] was followed. Sample (1 mL) was mixed with 2.5 mL of 0.2 M sodium phosphate buffer (pH 6.6) and 2.5 mL of 1% potassium ferricyanide [K2Fe (CN)6]. The mixture was then incubated at 50°C for 20 min. Trichloroacetic acid (TCA) was added (2.5 mL of 10% TCA) to the mixture, and centrifuged at 2200 × g for 5 min. The upper solution (2.5 mL) was mixed with 5.0 mL distilled water and 0.5 mL of 0.1% ferric chloride (FeCl3). Absorbance was measured at 700 nm in spectrophotometer and butylated hydroxytoluene (BHT) was used for comparison.
Hydrogen peroxide scavenging capacity
Hydrogen peroxide scavenging activities of the rice cultivars extract were determined according to the method of Ruch.[Citation13] A solution of hydrogen peroxide (40 mM) was prepared in phosphate buffer (pH 7.4). Extracts (100 μg/mL) in distilled water were added to a hydrogen peroxide solution (0.6 mL, 40 mM) and absorbance of hydrogen peroxide at 230 nm was taken against a blank solution containing the phosphate buffer without hydrogen peroxide. Samples were investigated within the 0–100 μg/mL concentration range, and all samples were run in triplicate.
where Ac was the absorbance of the control and As was the absorbance of the extract.
Fourier Transform Infrared (FT-IR) Spectra of Polyphenols
FT-IR spectra were used for detecting functional groups present in the three different rice cultivars from the state of Arunachal Pradesh. The rice grain was ground into flour and mixed with KBr (spectroscopic grade) powder. The mixer was pressed into pellets for FT-IR measurement in the frequency ranging from 4000 to 400 cm–1 and spectra of the materials were obtained at a resolution of 8 cm–1.[Citation14]
Qualitative and Quantitative Analysis by High-Performance Liquid Chromatography (HPLC)
Sample preparation
The sample (50 g) was mixed with 0.5 g ascorbic acid and added with 100 mL of 80% methanol followed by filtration (Whatman no. 2). The excess amount of the methanol and water was evaporated. The sample was washed in a separating funnel with hexane to remove carotenoid and other nonpolar compounds. The volume was made to equal 50 mL using distilled water and pH was adjusted to 7.0 and 10 mL sample were taken for further analysis.
Detection
A HPLC system (Ultimate 3000 Liquid Chromatography Systems) with an ultimate 3000 variable wavelength UV detector at 215 nm and Ultimate 3000 pump were used for analysis. The column was Acclaim 120 C18 column (5 µm, 120Å) with a size of 4.6 × 250 mm. The HPLC analysis was performed with 20 µL of sample injected into the column. The solvent system was eluent A-acidified water pH adjusted to 2.64 with the dil. hydrochloric acid and eluent B-acidified water: acetonitrile (20:80). A constant flow rate of 1.5 mL/min with a gradient run was maintained. The quantification of polyphenolic compounds was quantified using the calibration curves of their respective standards. The software chameleon ver. 6.80 was used for analyzing data.
Statistical Analysis
Experiments were carried out in triplicates and presented as mean ± standard deviation using SPSS version 16. The data was statistically analyzed by Duncan’s multiple range tests at 5% significance level and the Origin 8.5 (Origin Lab Corporation, Northampton, USA) software was used.
Results
Nutritive Quality
The data presented in shows that the LA cultivar content significantly (p < 0.05) high amount of moisture (11.13%) than UA and PA cultivar. Ash content was found highest in the UA 1.33%, followed by LA 0.97% and lowest in the PA 0.93%. Fat content was significantly (p < 0.05) high in UA 2.60% followed by LA (1.80%) and PA (1.77%). Energy values of three rice cultivars (LA, UA, and PA) were 16.34, 16.29, and 16.23 kJ, respectively. Amylose content of rice cultivars varies from 5.30–11.86%.
TABLE 1 Proximate composition of rice cultivars
Phytochemicals and antioxidant activities
Total phenolic content and the anthocyanin content of three cultivars are shown in The phenolic compound and anthocyanin content of three rice cultivars varied significantly. The phenolic contents in the white rice (PA) and the two red types rice (LA) and (UA) ranged from 142–349.30 mg GAE/100 g and anthocyanin content ranged from 1.34–12.79 mg cyanidin-3-glucoside Eq/100 g, respectively.
TABLE 2 Total phenolic and anthocyanin content of rice cultivars
It was observed from that the DPPH scavenging activity was highest in UA (88.48%) followed by LA (76.97%) and lowest in PA (68.87%). It may be attributed to the presence of higher amount of phenolic compounds. shows that DPPH scavenging activities of all the three samples were strongly dependent (R2 value of LA 0.86, UA 0.71, and PA 0.93) on the concentration of the sample. It could be due to marked effect of phenolic compounds of pigmented rice on DPPH scavenging activity.
TABLE 3 Antioxidant activity of three rice cultivars
FIGURE 1 Scavenging Capacity of three rice cultivars LA, UA and PA, a) Reducing activity, b) Chelating activity, c) DPPH activity and d) Hydrogen Peroxide.
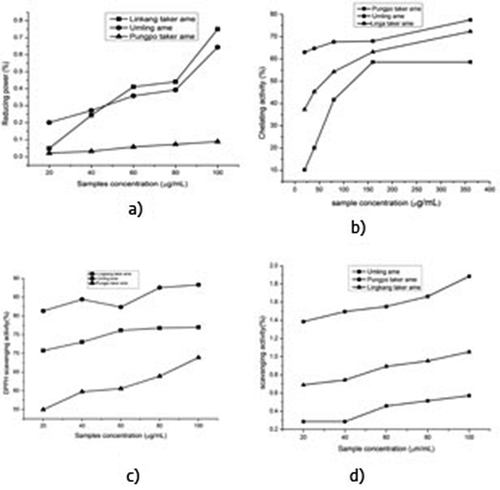
It was observed from the that UA (77.53 µg/mL) has the highest iron chelating activity than LA (72.33 µg/mL) and PA (58.92 µg/mL). It might be due to the presence of higher amount of phenolic compounds which reacted with iron and disrupted the red color complex formation. The correlation coefficients (R2) of three rice cultivars were UA 0.96, LA 0.85, and PA 0.84 and observed that UA (0.75 mM 100−1 g) has the highest reducing power () followed by UA (0.64 mM 100−1 g) and lowest in PA (0.08 mM 100−1 g). The correlation coefficient (R2) between the reducing power and sample concentration of the three rice cultivars were determined (). The reducing power and the sample concentration showed a strong correlation for all the rice viz., LA (R2) = 0.91, UA (R2) = 0.84, and PA (R2) = 0.98.
TABLE 4 Quantification of predominant phenolic acids present in three rice cultivars
Among the cultivars the highest H2O2 scavenging activity () was found in the UA (1.88 µg/mL), followed by LA (1.05 µg/mL) and PA (0.57 µg/mL). This may be attributed to the presence of high amount of phenolic compounds and the correlation coefficient (R2) of three rice cultivars were UA 0.94, LA 0.98, and 0.92.
FT-IR Spectra Analysis of Phenolic Compounds
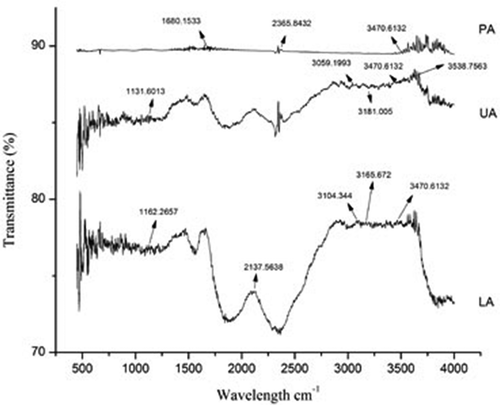
The Fourier transform infra red spectrum of three rice cultivars are shown in , , and . It was observed from the figures that the broad band of LA varied from 1455.51 to 3643.40 cm–1, UA 1650.63 to 3751.16 cm–1, and PA 1655.63 to 3874.61 cm–1.
FIGURE 2 Typical FTIR spectra of (a) LA (b) UA and (c) PA.
HPLC Analysis of Phenolic Compounds
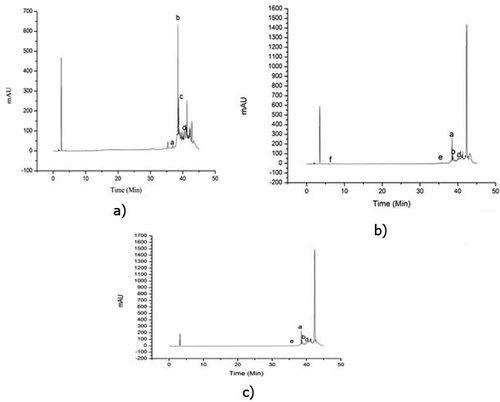
The identification of phenolic compounds by HPLC revealed differences in the, phenolic fraction profile among the rice cultivars (, , and ). The distribution of phenolic acids in all samples is illustrated in . The main phenolic acids identified in all three cultivars were salicylic acid, apigenin, and quinic acid. The salicylic acid was present at 302.06 ± 0.03, 44.50 ± 0.01, and 231.94 ± 0.02 mg/L level in UA, LA, and PA, respectively. The highest amount apigenin was detected in UA (7.03 ± 0.01 mg/L) followed by LA (0.42 ± 0.02 mg/L) and PA (0.49 ± 0.01 mg/L). Quinic acid was detected in all the three rice cultivars in high amounts. It was found that UA, LA, and PA had 255.46 ± 0.01, 611.46 ± 0.01, and 133.92 ± 0.02 mg/L of quinic acid, respectively. Quercetin was only detected in LA (33.27 ± 0.01 mg/L) cultivars and there was no detectable amount of ferulic, gallic, and caffeic acid in LA. UA rice cultivar contained detectable amount of gallic acid (0.98 ± 0.04 mg/L) and ferulic acid (17.21 ± 0.02 mg/L), whereas white rice cultivars contained only ferulic acid (15.18 ± 0.01 mg/L) and a smaller amount of caffeic acid (1.83 ± 0.02 mg/L).
FIGURE 3 HPLC chromatograms of (a) LA (b) UA and (c) PA.
Discussions
Energy in foods can be described by gross energy (GE), i.e., the heat produced by the food and metabolizable energy (ME) as the energy available for body functions or as the adenosine-triphosphate (ATP) available to the human body. Each leads to different energy conversion factors.[Citation15,Citation16] According to IRRI[Citation17] rice varieties were classified into five groups as per their amylose content: waxy (1–2%), very low (2–9%), low (10–20%), intermediate (20–25%), and high (25–33%). The amylose content of these three rice cultivars varied from 5.30–11.86 % ().
The phenolic compounds react with a deep violet color solution of DPPH and convert it to 2, 2-diphenyl-1-picrylhydrazine with decolorization and measurement of color reduction allows to estimate the DPPH scavenging activity of the samples.[Citation10] A similar type of result has been observed by numbers of researchers.[Citation18,Citation19]
Therefore, measurement of color reduction allows the estimation of the chelating activity of the sample.[Citation11] Chelating activity of rice extracts depends upon concentration of extract. From it was also observed that there was strong correlation between iron chelating activity and concentration of UA and LA sample.
In general ferrozine can quantitatively form complexes with Fe2+ but for presence of phenolic compounds which act as chelating agents, the complex formation is disrupted with the result that the red color of the complex is decreased with the sample concentrations.[Citation20] The UA cultivar showed significantly (p < 0.05) the high amount of chelating activity compared to LA and PA rice cultivars.
The reducing power assay of the rice samples were determined based on the reduction of ferricyanide complex to the ferrous form in presence of reductants (antioxidants) in the rice samples.[Citation21] UA cultivars of rice showed significantly higher reducing power with increase of sample concentration than PA and LA cultivars. It may be attributed to the presence of significantly higher amount of phenolic compounds in UA cultivar than PA and LA cultivars.
High phenolic contents in the samples result in the high reduction of Fe3+ to Fe2+ by donating an electron and which can be measured by the formation of pearl’s Prussian blue at 700 nm indicates an increase in reductive ability.[Citation22]
The measurement of H2O2 scavenging activity is one of the useful methods for determining the ability of antioxidants to decrease the level of pro-oxidants.[Citation23] Phenolic compound in extract act as an electron donor for conversion of hydrogen peroxide to water may accelerate[Citation23] that increase the scavenging activity of extract. It was also observed that there was strong correlation between hydrogen peroxide scavenging activities of all three samples and concentration and similar results were also observed by Park.[Citation24]
Intense characteristic peak at approximately in the region of 3600 to 3700 cm–1 and 3200–3500 cm–1 have been seen in all the three rice cultivars. Broad band at 3610–3640 cm–1 and 3200–3500 cm–1 is attributed to –OH stretching vibrations, which represents possibly the presence of phenolic OH.[Citation25] On the other hand, a weak C–H stretching band at around 2891 to 2937 cm–1 was observed in the rice cultivars, which represents the asymmetrical and symmetrical stretching vibration of hydroxyl group, respectively. The weak C–H stretching band in FT-IR spectrum was the plausible reason for the presence of phenolic acid in the rice cultivars.[Citation26,Citation27] The presence of carbonyl (C=O) linkages were confirmed from the peaks at 1076 and 1162 cm–1. The FT-IR band of C=O stretching was mainly due to the presence of carboxyl (–C=O) group of phenolic compounds of the pigmented rice cultivars. The bands approximately in the regions of 3400, 2930, and 1650 cm–1 are characteristic of a carbohydrate ring.[Citation28]
The concentration of total phenolics in the cultivars is associated with the antioxidant activities[Citation29–Citation31] which has potential benefits such as reduction of oxidative stress, cardiovascular problems, blood, and lipid-related diseases.[Citation31] The rice cultivars used in the present study have various types of phenolic acid content. Salicylic acid, caffeic acid, quinic acid, apigenin, ferulic acid, gallic acid, and quercetin were identified in pigmented cultivars, whereas the last two acids were not detected in white rice.
Conclusion
The results of the proximate composition of the pigmented rice cultivars differed significantly over the non-pigmented rice. In addition, pigmented rice cultivars evinced substantial amount of phenolic compounds (UA-349.3 ± 0.02 and LA-262.30 ± 0.01 mg GAE/100 g) compared to white rice (142.90 ± 0.01 mg GAE/100 g) and revealed high antioxidant activity. The pigmented cultivars also showed a higher amount of anthocyanin content in UA (12.79 ± 0.001) and LA (11.47 ± 0.001 mg/100 g) compared to white rice (1.34 ± 0.001) further reinforced its potential for high value addition. FT-IR and HPLC analysis of the rice cultivars deciphered the presence of seven phenolic compounds viz., quinic, salicylic, quercetin, apigenin, ferulic, gallic, and caffic acid which are paramount for functional foods. It is prudent to summarize that these pigmented untapped rice cultivars of Arunachal Pradesh, India have enormous potential in the field of the pharmaceutical industry vis-a-vis its health benefits.
Funding
The authors would like to thank the Ministry of Food Processing Industries, Govt. of India for financial assistance.
Additional information
Funding
References
- Hore, D.K. Rice Diversity Collection, Conservation, and Management in North-Eastern India. Genetic Resources and Crop Evolution 2005, 52, 1129–1140.
- Finocchiaro, F.; Ferrari, B.; Gianinetti, A.; DallAsta, C.; Galaverna, G.; Scazzina, F.; Pellegrini, N. Characterization of Antioxidant Compounds of Red and White Rice and Changes in Total Antioxidant Capacity During Processing. Molecular Nutrition and Food Research 2007, 51, 1006–1019.
- Bhattacharya, K.R.; Sowbhagya, C.M. Size and Shape Classification of Rice. Il Riso 1982, 29, 181–184.
- Adom, K.K.; Liu, R.H. Antioxidant Activity of Grains. Journal of Agricultural Food Chemistry 2002, 50, 6170–6182.
- Oki, T.; Masuda, M.; Kobayashi, M.; Nishiba, Y.; Furuta, S.; Suda, I.; Sato, T. Polymeric Procyanidins As Radical-Scavenging Components in Red-Hulled Rice. Journal of Agricultural Food Chemistry 2002, 50, 7524–7529.
- AOAC. Association of Official Analytical Chemists. Official Methods of Analysis of the AOAC International (16th ed.); Washington, DC, 1995.
- Atala, E.; Vásquez, L.; Speisky, H.; Lissi, E.; Lopez-Alarcon, C. Ascorbic Acid Contribution to ORAC Values in Berry Extracts: An Evaluation by the ORAC-Pyrogallol Red Methodology. Food Chemistry 2009, 113, 331–335.
- Slinkard, S.; Singleton, V.L. Total Phenol Analysis: Automation and Comparison with Manual Methods. American Journal of Enology and Viticulture 1977, 28, 49–55.
- Giusti, M.M.; Wrolstad, R.E. Characterization and Measurement of Anthocyanins by UV–Visible Spectroscopy. In Current Protocols Food Analytical Chemistry; Wrolstad, R.E.; Ed.; John Wiley and Sons: New York, NY, 2001; 1.2.1–13.
- Brand-Williams, W.; Cuvelier, M.E.; Berset, C. Use of a Free Radical Method to Evaluate Antioxidant Activity. LWT–Food Science and Technology 1995, 28, 25–30.
- Amma, K.P.P.; Sasidharan, I.; Sreekumar, M.M.; Sumathykutty, A.M.; Arumughan, C. Total Antioxidant Capacity and Change in Phytochemicals of Four Major Varieties of Cardamom Oils During Decortication. International Journal of Food Properties 2015, 18, 1317–1325.
- Oyaizu, M. Studies on Product of Browning Reaction Prepared from Glucose Amine. Japanese Journal of Nutrition 1986, 44, 307–315.
- Ruch, R.J.; Cheng, S.J.; Klaunig, J.E. Prevention of Cytotoxicity and Inhibition of Intercellular Communication by Antioxidant Catechins Isolated from Chinese Green Tea. Carcinogenesis 1989, 10, 1003–1008.
- Kumar, C.G.; Joo, H.S.; Chio, J.W.; Koo, Y.M.; Chang, C.S. Purification and Characterization of An Extracellular Polysaccharide from Haloalkalophilic Bacillus sp. I-450. Enzyme Microbial Technology 2004, 34, 673–681.
- Miller, D.S.; Payne, P.R. A Ballistic Bomb Calorimeter. British Journal of Nutrition 1959, 13, 501–508.
- FAO. Food Energy: Methods of Analysis and Conversion Factors. Report of a Technical Workshop. Food Nutrition 2003, 77, 1–93.
- FAO. Rice Production. http://faostat.fao.org.S ( accessed 30 Dec 2015).
- IRRI. Rice Quality Characteristics of Milled Rice. http://www.irri.org. ( accessed 25 Nov 2015).
- Hua, D.; Zhang, D.; Huang, B.; Yi, P.; Yan, C. Structural Characterization and DPPH Radical Scavenging Activity of a Polysaccharide from Guara Fruits. Carbohydrate Polymer 2014, 103, 143–147.
- Muller, L.; Frohlich, K.; Bohm, V. Comparative Antioxidant Activities of Carotenoids Measured by Ferric Reducing Antioxidant Power (FRAP), ABTS Bleaching Assay (TEAC), DPPH Assay, and Peroxyl Radical Scavenging Assay. Food Chemistry 2011, 129(1), 139–148.
- Wong, C.C.; Li, H.B.; Cheng, K.Y.; Chen, F. A Systematic Survey of Antioxidant Activity of 30 Chinese Medicinal Plants Using the Ferric Reducing Antioxidant Power Assay. Food Chemistry 2006, 97(4), 705–711.
- Khodja, N.K.; Makhlouf, B.K.; Madani, K. Phytochemical Screening of Antioxidant and Antibacterial Activities of Methanolic Extracts of Some Lamiaceae Nabyla. Industrial Crops and Products 2014, 61, 41–48.
- Malar, J.; Chairman, K.; Singh, A.R.J.; Vanmat, J.S.; Balasubramanian, A.; Vasanthi, K. Antioxidative Activity of Different Parts of the Plant Lepidium Sativum Linn. Biotechnology Reports 2014, 3, 95–98.
- Wettasinghe, M.; Shahidi, F. Antioxidant and Free Radical-Scavenging Properties of Ethanolic Extracts of Defatted Borage (Borago Officinalis L.) Seeds. Food Chemistry 2014, 67(4), 399–414.
- Park, Y.S.; Kim, S.J.; Chang, H.I. Isolation of Anthocyanin from Black Rice (Heugjinjubyeo) and Screening of Its Antioxidant Activities. Korean Journal of Microbiology and Biotechnology 2008, 36, 55–60.
- Ascough, P.L.; Bird, M.I.; Francis, S.M.; Lebl, T. Alkali Extraction of Archaeological and Geological Charcoal: Evidence for Diagenetic Degradation and Formation of Humic Acids. Journal of Archaeological Science 2006, 38(1), 69–78.
- Lee, F.Y.; Htar, T.T.; Akowua, G.A. ATR-FTIR and Spectrometric Methods for the Assay of Crocin in Commercial Saffron Spices (Crocus Savitus L.) International Journal of Food Properties 2015, 18, 1773–1783.
- Santhiya, D.; Subramanian, S.; Natarajan, K.A.J. Surface Chemical Studies on Sphalerite and Galena Using Extracellular Polysaccharides Isolated from Bacillus Polymyxa. Journal of Colloid and Interface Science 2002, 256, 237–248.
- Gi, Y.K.; Hyung, S.P.; Byong, H.N.; Sang, J.L.; Jae, D.L. Purification and Characterization of Acidic Proteo-Heteroglycan from the Fruiting Body of Phellinus Linteus (Berk & M.A. Curtis) Teng. Bioresource Technology 2003, 89, 81–87.
- Itani, T.; Ogawa, M. History and Recent Trends of Red Rice in Japan. Japanese Journal of Crop Science 2004, 73(2), 137–147.
- Katalinic, V.; Mozina, S.S.; Generalic, I.; Skroza, D.; Ljubenkov, I.; Klancnik, A. Phenolic profile, Antioxidant Capacity, and Antimicrobial Activity of Leaf Extracts from Six Vitis Vinifera L. Varieties. International Journal of Food Properties 2013, 16, 45–60.