
Abstract
The textural properties of four commercial processed cheese spreads were analyzed by means of a penetrometric test at 20°C with different penetration rates. The hardness index corresponding to the maximum stress of penetration was determined. A power law regression model was observed between the hardness index and the deformation rate applied. Thereby, giving new rheological parameters, κ, the y-intercept of the curve and, α, its slope. Four descriptors were tested in textural sensory evaluations: firmness, adhesiveness, melting, and spreadability. Significant linear regressions were observed between hardness index (or κ) and the panel assessment for firmness and between κ and the sensory spreadability.
Introduction
Processed cheese spreads are a main type of processed cheese known for their ability to be spread and to be made into slices. To manufacture the spreadable-type processed cheese, natural cheeses are vigorously blended and heated with some other ingredients including essentially emulsifying salts and fat. The physicochemical processes involve the breakdown of the initial paracaseinate network of natural cheese in order to obtain a homogenous molten mass immobilizing water and emulsifying fat. During the cooling phase, a new three-dimensional proteinic network is formed by protein–protein interactions and interactions between the dispersed emulsified fat and casein molecules, whereas fat crystallizes.[Citation1] Both constituents govern the rheological and the textural properties of the obtained processed cheese spreads.[Citation2]
Texture is an important sensory property that determines the consumer acceptance of a foodstuff.[Citation3] Traditionally, textural assessments in the food industry have been carried out by taste panels. These latter may or may not be formally trained in the evaluation of textural characteristics. Otherwise, the use of instrumental data such as rheological properties proved efficient since it provides more reproducible and accurate results. Due to rapidity and cost saving as well, food technologists have always been looking for correlations between sensory evaluations and instrumental measurements.[Citation3,Citation4] Penetrometry, which is the most common textural instrumental test applied to foodstuff, has been used during the last few years to assess the textural properties of the processed cheese spreads, via the texture profile analysis (TPA) due to the difficulties observed during sample manipulation.[Citation5–Citation9]
Using both a texture analyzer and taste panel, several authors have tried to relate instrumental data to sensory evaluations of different cheese-types texture. From cream cheese[Citation10] to hard cheeses,[Citation11] the sensory attributes describing the cheese texture were varied: hardness (or firmness), cohesiveness, adhesiveness, spreadability, and melting. On the other hand, rheological parameters have been chosen with respect to the strain applied in the sensory tests and successful comparisons were made between instrumental and sensory evaluations. For example, Hennequin and Hardy[Citation12] studied the textural properties of various soft cheeses and found a good agreement between the instrument and the panel for hardness once the physical property was assessed by a penetrometric method and a TPA. Drake and others[Citation13] correlated sensory firmness and slipperiness of reduced-fat processed cheeses (block-type and non-spreadable ones) to creep-recovery measurements. The same authors tried to correlate TPA measurements to the corresponding sensory evaluations but a poor discriminating power was observed for this instrumental characterization. However, only few studies have investigated the relationships between instrumental and sensory measurements of the textural properties of the spreadable-type processed cheese.[Citation5,Citation14] Moreover, it is almost certain that there was negligible study undertaken on the commercial processed cheese spreads. The aim of this investigation is to compare the textural data, obtained from an instrumental method applied to commercial processed cheese spreads, to the one obtained from a trained taste panel.
Materials and methods
Processed Cheese Spreads
Four different processed cheese spreads were purchased from the Tunisian market and selected as the most important international and local brands. They are named as follows: Président, Vache Qui Rit, Land’Or, and Riki and will be referred to as A, B, C, and D, respectively. Cheeses were packaged in a paper-made box containing 24 portions of 14.5 0.7 g. Composition of the test products, as per the labeling on each package are given in . During the whole analysis period, the processed cheeses were stored at +5°C. Samples were allowed to equilibrate at +20°C, 24 h prior to evaluations.
TABLE 1 Composition of the test products
Physicochemical Analyses
Processed cheese spreads were characterized with respect to chemical composition: dry matter (DM),[Citation15] fat content,[Citation16] total nitrogen expressed as protein content,[Citation17] and pH. All analyses were achieved in triplicate. Fat content in DM (g fat/100 g DM, Fat/DM) and moisture in non-fat solids (g water/100 g non-fat solids, MNFS) were calculated.
Rheological Texture Analysis
Equilibrated cheese portions were introduced into metallic capsules of 11-mm height and 30-mm diameter to make disk-shaped slices. Attention was given when forming the specimen to avoid deformation. The small amount of cheese that overflows from the above part of the capsule was shaved using a plastic spatula. The capsule gently filled with cheese was introduced in a specific stainless steel cell (8.8 cm 15.0 cm
2.0 cm) containing a hole with the same dimensions than the capsule. It was used to maintain its temperature at the fixed value by circulating water coming from a circulator bath (Julabo F25MD, Labortechnik GmbH, Germany). The temperature of the sample and the cell (+20°C) was verified before measurements using an auto-ranging digital multimeter (M-3890D, Metex Instruments, Korea). Consequently, the central temperature of a control specimen was measured. With regards to the cell, two small holes created in its two opposite faces allowed the introduction of the thermocouple without touching the cheese sample. Then the sample introduced in the cell was allowed to rest 5 min in order to relax stresses induced by the preparation procedure.
Penetration test on maintained and equilibrated samples was performed using a texture analyzer TA-XT2i of 50 N (Stable Micro Systems, Ltd, UK). A stainless steel flat plate probe with 6-mm diameter was attached to the moving crosshead. Five penetration rates were tested: 0.1, 0.4, 1.0, 4.0, and 10.0 mm/s. All measurements were carried out in triplicate. Force versus displacement (or time) plots were recorded from the penetration test. The data collected from these curves were compared to those obtained from a trained taste panel.
Descriptive Sensory Analysis
The texture descriptive analysis was conducted on the four processed cheese spreads in parallel with the rheological texture analysis. The selection of the panelists was based on interest, time available, and a liking for processed cheese spreads. Panelists were university students aging from 21 to 26 years: 10 were female and 10 were male. During training, panelists were asked to identify and define mouth texture terms. They were given an assortment of anonymous commercial processed cheese spreads, to aid in development of terms, including: firmness, adhesiveness, melting, and spreadability (). Panelists marked responses on 10-point numerical intensity scales anchored on the left with “not” and on the right with “very.” They received about 6 h of training over the course of 3 days during which they developed and defined descriptors. Cheese samples subjected to sensory analysis were previously equilibrated at 20°C during 24 h.
TABLE 2 Physicochemical characteristics of processed cheeses
Statistical Analyses of Data
Student test was applied to the physicochemical and rheological data to compare the means of independent samples at a risk of 5%. One and two-way analyses of variance (ANOVA) were performed on the experimental results to determine whether statistically significant differences occurred among means. All differences considered as significant are at least P < 0.05 or experimentally determined Fishers’ F greater than the theoretical one obtained by statistical tables. ANOVA was achieved on the hardness index (Hi) measurements to examine the effect of both factors « cheese » and « penetration rate », in order to determine the discriminating power of the different penetration rates used. The sensory results were also subjected to ANOVA tests. The factors « panelist » and « cheese » were thus separately studied.
The multiple regression analysis was carried out to determine individual relationships between sensory and rheological characteristics. The aim here was to predict sensory evaluations from instrumental rheological measurements. A regression was considered as statistically significant for p < 0.05 with a high coefficient of determination (R2). The prediction models obtained consisted only of those variables which were statistically significant (p < 0.05). The correlation analysis (Pearson correlation) was also used. All the statistical analysis of data was conducted using the statistical software SPSS 17.0 (on PC; SPSS Inc., Chicago, IL). The repeatability of the results was evaluated by calculating the coefficient of variation (CV% = standard deviation/mean value).
Results and Discussion
Physicochemical Characteristics
The physicochemical properties of the four processed cheeses are summarized in . DM and pH values agree closely with those previously obtained from high-fat spreadable processed cheeses (70% Fat/DM).[Citation18] Lee et al.[Citation19] and Dimitreli and Thomareis[Citation2] analyzed processed cheese spreads prepared in lab-scale with large chemical properties (moisture, fat, and protein contents) and pH values including those obtained through this study. The results of a Student test conducted on the physicochemical data showed that the four processed cheeses differed significantly from each other not only in DM and pH, but also to a smaller extent, in protein and fat contents ().
Rheological Behavior
The experimentally determined values of the resistance to penetration are plotted against displacement. Examples of typical curves obtained with the commercial processed cheese spreads are given in . Similar behaviors were observed for the five tested penetration rates. The resistance to probe penetration increased until a certain value, then leveled off. As to the four processed cheese spreads, the force measured at the plateau region () increased with the penetration rate due to viscoelasticity (dissipation of energy at low shear rates). From the force-displacement curves, a Hi corresponding to the maximum stress (maximum force/contact surface) was determined and was observed to display a high degree of repeatability (mean coefficient of variation = 4.58%). The mean Hi was calculated from each triplicate and plotted against the strain rate, (penetration rate/initial height of the sample). The resulting curves were best fit (p < 0.001) by a power law (Eq. [Citation1]), with coefficient of determination (R2) values greater than 0.93 (). These results, which are observed for the first time on such a foodstuff, underline the suitability of the penetration test in assessing the rheological behavior of the processed cheese spreads since it highlights its viscoelastic behavior.
FIGURE 1 Force versus displacement curves obtained during penetration of cheese B (20°C) with five crosshead rates (○:0.1 mm/s, ▲:0.4 mm/s, :1.0 mm/s, ■:4.0 mm/s, and □:10.0 mm/s). For clarity, only 10 points are presented by curve (continuous lines correspond to experimental results).
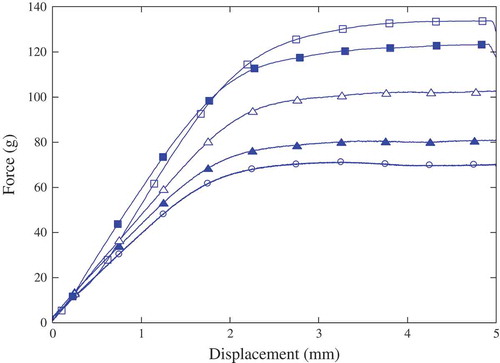
FIGURE 2 Hardness index calculated from the force versus displacement curves plotted against the deformation rate for the four cheeses (▲: A, ♦: B, ●: C, and ■: D). The four lines represent the fit of power laws to the data (Eq. 5). Error bars correspond to standard deviation.
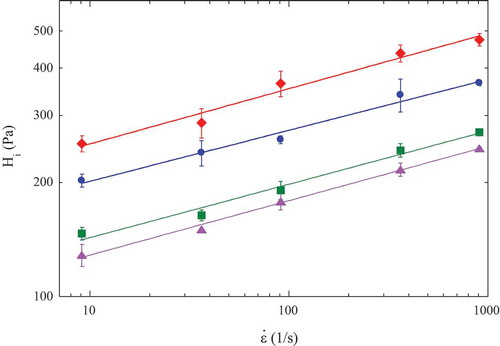
κ: the value of the stress (Pa) at a deformation rate of 1/s; α: the slope of the curve in logarithmic scales, which shows the sensitivity of the cheese sample to the deformation rate. Both coefficients were highly significant (p < 0.001). Results are given in .
TABLE 3 Rheological parameters of the four processed cheeses (Eq. 5)
While cheeses A and D gave similar values of the coefficient κ (p > 0.05), cheeses B and C gave statistically different coefficients κ (p < 0.05; see ). The slope α was the same in the four commercial cheeses, although they were manufactured in different factories with different formulations and raw materials (see ). A two-way ANOVA on the factors « cheese » and « penetration rate » was applied to Hi. The results showed a good discriminating power of both factors: Fisher’s F was higher than the theoretical one (442.54 for the factor « cheese », F0.05 = 2.84 and 227.82 for the factor « penetration rate », F0.05 = 2.61). The interaction between both factors was significant (Fisher’s F = 6.54, F0.05 = 2.00), but with smaller effect than that of the factors themselves.
Few studies have focused on the applicability of the penetrometry test on the spreadable-type processed cheese, as the one of Lee and Klostermeyer.[Citation20] These authors determined a hardness value (g/cm2) after the penetration of a Perspex cylindrical probe into processed cheese spreads prepared in lab-scale. The hardness value was the force required to penetrate the sample to a depth of 10 mm at a speed of 2 mm/s per unit on a cross-sectional area of the probe. However, there is no published work dealing with the applicability of penetrometry on commercial processed cheese spreads.
Descriptive Sensory Analysis
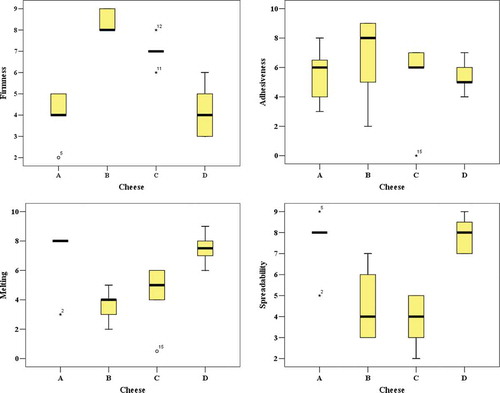
A one-way ANOVA on the factor « panelist » applied to the sensory evaluations showed that the mean values of firmness, adhesiveness, melting, and spreadability were not statistically different among panelists (p ˃ 0.05). One can then assume the absence of a panelist effect on the realized sensory assessments and assume that the training has been well conducted. A second ANOVA on the factor « cheese » which was applied to the panel assessments of the four descriptors proved statistically significant differences of firmness (p < 0.001), melting (p < 0.01), and spreadability (p < 0.001) for the four cheeses. The best discriminating power (higher Fisher’s F) was obtained with firmness (F = 23.27) and spreadability (F = 10.67). Refering to the panel (), the firmer sample was B, followed by C, and the softer ones were D and A. The panel had some difficulties discerning between these two latter. The most spreadable samples were the softer ones which melted more easily (D and A), while the least spreadable samples were the firmer ones and the more difficult to melt (B and C). These observations are obvious since softness enhances the ability of the specimen to spread once shared between a knife and a flat surface or between tongue and palate which allowed melting in the mouth easy. Besides, correlation analysis between the sensory terms showed significant linear correlations between firmness and spreadability (p < 0.001, R2 = 0.60), then between firmness and melting (p < 0.01, R2 = 0.49), and finally between spreadability and melting (p < 0.001, R2 = 0.72). However, according to ANOVA test, panelists did not distinguish between the adhesiveness of the different cheeses (p ˃ 0.05).
FIGURE 3 Box plots of the sensory evaluation for firmness, adhesiveness, melting, and spreadability.
Regression Analysis
Good agreement was found between the firmness panel appraisal and the hardness instrumental measurement (Hi). Linear regressions were established between these two parameters (R2 = 0.80; p < 0.001). Similar behavior was observed between firmness and k. The correlations of both sensory and instrumental data related to the cheese firmness are expected due to the similarities observed between these two techniques. Hi and κ were also significantly correlated to adhesiveness, spreadability, and melting by linear equations. The best coefficient of determination was obtained between k and spreadability (R2 = 0.51; p < 0.01). These equations allow the manufacturer to predict the sensory assessment of some textural properties through faster and more accurate instrumental methods, which can facilitate control of the cheese quality product and as a result reduce cost.
Conclusions
Through this study, it was demonstrated that the penetration test may prove to be a useful method not only to assess the textural properties of the commercial spreadable-type processed cheeses but also to predict their sensory firmness, spreadability, and melting. Textural experiments were performed at +20°C, which is a temperature closer to the consumption one in moderate climate countries. However, temperature was seen to display an important effect on the rheological properties of processed cheese spreads, as described in a previous work.[Citation21] It should be of great interest to examine the influence of temperature on the textural properties of commercial processed cheeses spreads and to elucidate the significance of the power law parameters α and κ.
Acknowledgments
The authors gratefully acknowledge Mr. Taïeb Jerbi and Mr. Mokhtar Kraiem (CNSTN, Tunisia) for precious collaboration and Mrs. Samia Ben Salah for her help.
References
- Chambre, M.; Daurelles, J. Le Fromage Fondu. In Le Fromage, 3rd Ed; Eck, A.; Gillis, J.-C.; Eds.; Technique & Documentation: Paris, 1997, 691–708 pp.
- Dimitreli, G.; Thomareis, A.S. Effect of Chemical Composition on the Linear Viscoelastic Properties of Spreadable-Type Processed Cheese. Journal of Food Engineering 2008, 84, 368–374.
- Foegeding, E.A.; Brown, J.; Drake, M.A.; Daubert, CR. Sensory and Mechanical Aspects of Cheese Texture. International Dairy Journal 2003, 13, 85–591.
- Brown, J.A.; Foegeding, E.A.; Daubert, C.R.; Drake, M.A.; Gumpertz, M. Relationships Among Rheological and Sensorial Properties of Young Cheeses. Journal of Dairy Science 2003, 86, 3054–3067.
- Cunha, C.R.; Dias, A.I.; Viotto, W.H. Microstructure, Texture, Colour, and Sensory Evaluation of a Spreadable Processed Cheese Analogue Made with Vegetable Fat. Food Research International 2010, 43, 723–729.
- Weiserová, E.; Doudová, L.; Galiová, L.; Zák, L.; Michálek, J.; Janis, R.; Bunka, F. The Effect of Combinations of Sodium Phosphates in Binary Mixtures on Selected Texture Parameters of Processed Cheese Spreads. International Dairy Journal 2011, 21, 979–986.
- Zhang, X.; Yang, Y.; Zhao, D. Effect of Blueberry on Spreadable Processed Cheese. Journal of Northeast Agricultural University 2011, 18, 73–78.
- Joshi, N.S.; Jhala, R.P.; Muthukumarappan, K.; Acharya M.R.; Mistry, V.V. Textural and Rheological Properties of Processed Cheese. International Journal of Food Properties 2004, 7, 519–530.
- Dimitreli, G.; Thomareis, A.S. Instrumental Textural and Viscoelastic Properties of Processed Cheese as Affected by Emulsifying Salts and in Relation to its Apparent Viscosity. International Journal of Food Properties 2009, 12, 261–275.
- Kealy, T. Application of Liquid and Solid Rheological Technologies to the Textural Characterisation of Semi-Solid Foods. Food Research International 2006, 39, 265–276.
- Everard, C.D.; O’Callghan, D.J.; Howard, T.V.; O’Donnell, C.P.; Sheehan, E.M.; Delahunty, CM. Relationships Between Sensory and Rheological Measurements of Texture in Maturing Commercial Cheddar Cheese over a Range of Moisture and pH at the Point of Manufacture. Journal of Texture Studies 2006, 37, 361–382.
- Hennequin, D.; Hardy, J. Evaluation Instrumentale et Sensorielle de Certaines Propriétés Texturales des Fromages a Pâte Molle. International Dairy Journal 1993, 3, 635–647.
- Drake, M.A.; Truong, V.D.; Daubert, CR. Rheological and Sensory Properties of Reduced-Fat Processed Cheeses Containing Lecithin. Journal of Food Science 1999, 64, 744–747.
- Strohmaier, W.; Klostermeyer, H.; Deuritz, P.; Windhab, E. Comparison of Different Methods to Determine the Spreadability and Firmness of Processed Cheese. Lebensmittel-Untersuchung und-Forschung 1992, 194, 531–535.
- ISO 5534. Fromages et Fromages Fondus—Détermination de la Teneur Totale en Matière Sèche (Méthode de Référence)[Cheeses and Processed Cheeses - Determination of Dry Matter Content (Reference method)]. International Organization of Standardization. 2004.
- ISO 3433. Fromages—Détermination de la Teneur en Matière Grasse—Méthode Acido-Butyrométrique [Cheeses - Determination of Fat Content - Acido-butyrometric Method]. International Organization of Standardization. 2002.
- IDF-FIL 20-1. Lait. Détermination de la Teneur en Azote. Partie 1: Méthode Kjeldahl [Milk. Determination of Nitrogen Content. Part 1: Kjeldahl Method]. International Dairy Federation, 2001.
- Piska, I.; Stetina, J. Influence of Cheese Ripening and Rate of Cooling of the Processed Cheese Mixture on Rheological Properties of Processed Cheese. Journal of Food Engineering 2004, 61, 551–555.
- Lee, S.K.; Anema, S.; Klostermeyer, H. The Influence of Moisture Content on the Rheological Properties of Processed Cheese Spreads. International Journal of Food Science and Technology 2004, 39, 763–771.
- Lee, S.K.; Klostermeyer, H. The Effect of pH on the Rheological Properties of Reduced-Fat Model Processed Cheese Spreads. LWT–Food Science and Technology 2001, 34, 288–292.
- Gliguem, H.; Ghorbel, D.; Lopez, C.; Michon, C.; Ollivon, M.; Lesieur, P. Crystallisation and Polymorphism of Triacylglycerols Contribute to the Rheological Properties of Processed Cheese. Journal of Agricultural and Food Chemistry 2009, 57, 3195–3203.