
Abstract
In this research the possibility of a non-destructive prediction of two main quality parameters of poultry egg using principle component analysis and radial basis function network by the transmission visible–near infrared spectroscopy method was investigated. The studied parameters include Haugh unit and air cell height as a function of a 5-week storage duration at room (25°C and 40% relative humidity) and refrigerator (5°C and 75% relative humidity) conditions. The spectra were interpreted and a radial basis function network model was developed for both storage conditions at wavelength ranges of 300–1100 nm. The developed models yielded a good prediction accuracy of Haugh unit for intact egg (R2 value 0.745 and 0.76) as well as air cell height (R2 value 0.835 and 0.844) for room and refrigerator conditions, respectively. Results of the experiment showed the developed model can be used in the prediction of egg freshness indices satisfactorily.
INTRODUCTION
For table eggs, quality and freshness are prime importance to consumers and it is a fundamental pillar in the human diet. Immediately after egg laying, the aging processes are slightly initiated and the physio-chemical of the poultry egg is altered. During storage, physico-chemical changes occur in the structure of the thick albumen. The liquifaction of thick white and increasing air cell size are largely influenced by the storage time and relative humidity (RH) conditions. Haugh unit (HU) and air cell height are the main characteristics for the freshness assessment of eggs.[Citation1] Consequently there is a need for non-destructive and a rapid method for freshness assessment of poultry eggs. Near–infrared (NIR) spectroscopy is a widely used technique for measuring the internal quality of agro-food products. It is fast and easy to use in process control, grading systems, and a non-invasive technique for on-line applications. Our previous work has proved the ability of NIR in non-destructive and rapid estimation of egg freshness using maximum likelihood method.[Citation2]
With regard to eggs, Bamelis et al.[Citation3] investigated egg freshness using visible-NIR spectroscopy and found a decrease in transmission at 663 nm in stored eggs, and the size of this drop was quadratically related to the storage time. Berardinelli et al.[Citation4] used Fourier transform (FT)–NIR and predicted the height of thick albumen in 80% of the samples with a maximum error of ±1 mm. Kemps et al.[Citation5] used the visible transmission spectra ranging from 200 to 1100 nm and predicted albumen pH and HU were 0.86 and 0.82, respectively.
The principle component analysis (PCA) method can be used to select main components in multivariate regression. Such that PCA, as a dimension reduction approach, is applied without the consideration of the correlation between dependent variable (outputs) and independent variables (regressors).[Citation6] Radial basis function (RBF) network is a function aproximation methodology that is used as an effective tool for prediction in many applications.[Citation7–Citation9] In this article, a combination of PCA and RBF is introduced, such that first main components are selected using the PCA method and after that, the RBF network is trained for better predictivity. However, if the number of regressors was bigger than experiments, this approach will not work, and for big data it will be time consuming.[Citation10] Different numerical methods can be used to estimate this parameters. The PCA method has been mentioned in numerous articles.[Citation1,Citation11–Citation15]
To the best of our knowledge, no literature about combining the PCA with RBF network for egg freshness determination using visible (Vis)–NIR spectroscopy have been carried out so far. The purpose of the present research intends to further investigate the ability of Vis-NIR spectroscopy in the prediction of HU and air cell height using PCA and RBF network. In this article, first, available data through robust analysis is preprocessed. Then using PCA, main components are selected such that R2 value for evaluate data has been maximized. In the final step, RBF is incorporated to assess the air cell height and HU. For training and evaluation process 10-fold cross-validation as a effective tool is used.
MATERIALS AND METHODS
Sample Selection
For the experiment, a total of 300 medium-sized, freshly laid eggs were purchased from the same flock of hens fed with a standard feed from the Kei farm (Kyoto, Japan). To obtain a considerable variation in freshness, on arrival at the laboratory, 50 eggs were analyzed, and the rest were put under controlled conditions of temperature and humidity (T = 24 ± 1°C, RH = 40% and 4–5°C, RH = 75%) for a five-week storage period. A total of 25 eggs from each group were selected for analysis at days 0, 6, 12, 18, 24, and 30.
Quality Parameters of Egg
The quality parameters considered were: HU, and air cell height (mm). HU is the standard method for determination of interior egg quality. Albumen height measurements were recorded using the standard tripod micrometer. Eggs were weighed to the nearest 10th of a gram prior to testing. After weighing, the eggs were broken out onto a glass break-out table for albumen height measurement. The thick albumen height was measured by averaging three measurements carried out at different points of the thick albumen and approximately 10 mm from the yolk and the edge of the thick albumen with a tripod micrometer (B.C. Ames Co., Waltham, MA). The HU was calculated by using the following formula:[Citation16]
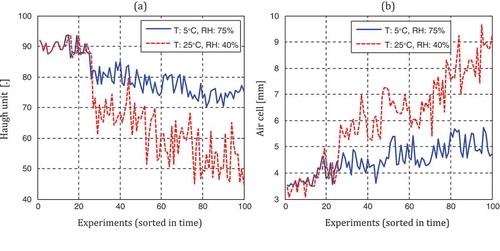
where H is the albumen height in millimeters, G is the gravitational constant of 32.2, and W is the mass of the egg in gram. The air cell height is measured from the base of the shell in three equidistant points on the circumference described by the contact line of the membrane to the shell, and at the middle point of the same membrane. The air cell height was obtained averaging the values of these four points.[Citation2,Citation4] Measured air cell height and HU for 100 experiments are shown in . Comparison of the results showed that storage condition has a great impact on the quality of the eggs. Such that the eggs stored at room temperature showed more quality loss than those stored in refrigerator and degradation in HU and increase in air cell are significant in eggs stored in higher temperature.
FIGURE 1 Haugh unit (a) and Air cell; (b) variations along day ordered experiments for Ref (T: 5°C, RH: 75%) and Room (T: 25°C, RH: 40%) conditions.
Vis–NIR Spectroscopic Data
Vis–NIR transmission data of 300 Borris Brown hen eggs of the same flock fed with a standard ration for each egg were obtained using spectroscope in 832 wavebands. Optical scanning was performed with a fiber optic NIR spectrometer with 10 mm diameter. The set up trasmittance measured at wavelengths from 300–1100 nm with 1 nm increment. For this purpose special sample holder was designed to mount eggs between incident and transmitted light (). The egg is placed on a foam ring with its blunt end pointed upward. This configuration was chosen in order to reproduce the typical egg orientation in a grading machine. An optical fiber is placed on one side of the egg and transports the transmitted light into an Avaspec-2048 spectrophotometer (Avantes, Eerbeek, The Netherlands). Before acquisition of spectra and after every 10 samples, a white reference was used to obtain the relative transmission as a reference standard. Each spectrum was the average of 10 scans and all measurements were performed on two opposite positions on the equator of each egg marked with a circle. In this way, all spectral were performed at exactly the same position on the eggs.
FIGURE 2 Experimental set-up for the measurements of transmission spectroscopy (LAX-Cute, 100W Xenon light source, Asahi Spectra).
A xenon lamp was used as a light source and a teflon block was used for calibration. Because light is not molecularly absorbed and scattered when it passes teflon, the transmission spectrum of teflon is nearly flat in the Vis and NIR range. This makes it suitable as a reference measurement.[Citation2] For each egg, a non-destructive spectral transmission measurement and then determination of destructive freshness parameters (HU and air cell height) were performed. The spectral data of each egg was obtained by averaging the three measurements. The acquisition time for each measurement was 250 ms. The wavelength of each main peak was detected by the computer for each sample. Before developing the calibration models, the spectra of all samples were pre-processed using the first derivative to increase spectral resolution. To correct both multiplicative and additive effects of the spectra due to scattering, the Origin Pro 8 (Origin Lab Corporation, USA) and the Unscrambler v9.7 (CAMO Software AS, Norway) software were used for further analysis. Immediately after spectral acquisitions, each egg was weighed (±0.01 g) and broken. The albumen height was determined (±0.25 mm) by means of a vertically mounted micrometer. Based on these measurements, the HU was determined by formula (1). The HU is of the utmost importance for the organoleptic and structural properties of the egg itself and it can also give an indication of food safety.
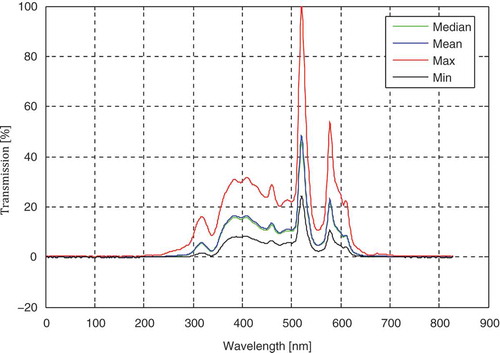
For selected eggs and for transmittance measurements, the spectra of each egg were correlated with the respective observed albumen and air cell height value to create a training set for the statistical algorithm. shows the absorbance units (non-destructive measurements) in median, mean, max, min, and percent transmittance versus the wavelength (nm) for egg samples.
FIGURE 3 Median, average, maximum, and minimum of measured transmission between experiments.
Data Analysis
Contributions of the scheme can be summarized as follows:
Using robust scheme for pre-analysis of data obtained from Vis–NIR spectroscopy.
Using PCA and RBF network for obtaining a predictive model.
Due to the random selection of initial condition in numerical analysis, in most literature the best result of different runs of algorithms are presented that may not reliable or repeatable. For a solution to this issue, different methods are presented in this article as K-fold cross-validation, robust normalization, subset selection, and appropriate choice of RBF parameters that is introduced in later parts. In this article, the dimension reduction feature of PCA is used and then RBF network is used to assess the air cell an HU. Performances of the proposed method is evaluated for Vis-NIR spectroscopic data.
Robust Normalization
To obtain reliable conclusions about the data, it is necessary to consider robust approaches, able to neglect the outliers presence and to represent the data majority. This relies on finding proper estimates of the data location and scale.When data contains outliers, the data mean as well as its standard deviation are no longer reliable estimates. Robust centering and robust autoscaling can be done using their robust variants such as the median absolute deviation (MAD) scale estimators:[Citation6]
where is centered data vector,
is normalized data vector and
is robust standard deviation of the variable
based on the median of absolute deviation scale.
K-Fold Cross-Validation
K-fold cross-validation is a training and simultanously testing method for the learning process. In this algorithm first the data set is partitioned into K-folds which are the same size. In next step, K-iterations of training and testing are applied such that within each iteration, different fold of the data is held-out for validation while the remaining K-1 folds are used for learning.[Citation17] In this method every data has equal chance to engage in the learning and testing processes. The most common validation process used in K-fold algorithm is 10-fold cross-validation, which has been used in this article.
Dimension Reduction
Dimension reduction is one of the main tools for multivariate analysis, it is necessery for multivariate regressions in many applications. In this article, PCA as a dimension reduction approach, is applied without the consideration of the correlation between the dependent variable (outputs) and the independent variables (regressors). Therefore, it is called as an unsupervised dimension reduction approach, and other methodologies such as partial least squares (PLS) that consider output and regressor relation are considered as a supervised dimension reduction approach. A PCA algorithm is used for dimension reduction and regression. The extracted principal components are used as the input variables for the RBF network.
RBFs
The RBF network, is one form of artificial neural networks that can be considered as a three-layer network. Layers are input, hidden, and output as can be seen in . The input layer task is to distribute the input data. In hidden layer each node containing activation function represents the radial function, its dimensionality is the same as the dimensionality of input data. The output from the jth node for the input object has the following functionality:
FIGURE 4 Schematic diagram of an RBF network.
where is the Euclidean norm and
is the center of the jth RBF.[Citation18]
Most often and also in this article, the RBFs are Gaussian functions, characterized by two parameters, center (c) and width (). The output
from the jth node for the object
is calculated as:
The output node is a weighted sum of all the outputs of the hidden nodes. The response of each output node is a linear function of its input and a bias of · The resulted RBF network model can be written as:
or in matrix notation:
where A is the activation matrix and is weight vector:[Citation18]
Training RBF Networks
The following parameters are determined by the training process:
The number of neurons in the hidden layer.
The coordinates of the center of each RBF function (
).
The spread of each RBF function (
The weights applied to the RBF function outputs in output layer.
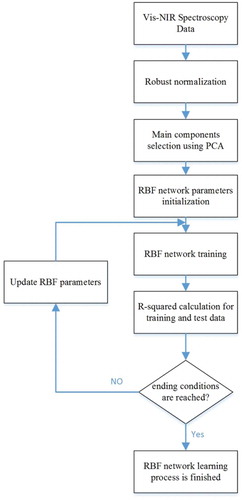
As mentioned previously, the number of neurons in the hidden layer can have a big impact on prediction performance, so for better prediction, unlike many works, in this study we assumed each output has a different network of RBF and different parameters. The whole procedure is depicted in . After robust normalization of Vis-NIR spectroscopy data, main components which have the most effect on outputs, is selected through PCA analysis. In the next step, the RBF network parameters are initialized, and using an exhaustive search, the best parameters are selected such that R2 value for test data is maximized.
FIGURE 5 Data analysis flowchart.
RESULTS AND DISCUSSION
After normalization using robust algorithem presented in the previous section, the dimension of the data set is reduced using the PCA method. For capturing more information within main components, 100 main components are chosen as there will be 100 measurement for training and 100 equations to be solved. In next stage, the RBF network is trained and tested. For this part as mentioned in previous parts, 10-fold cross-validation is incorporated. The main components obtained from PCA analysis are fed to the RBF network as inputs. The supervised back propagation is used to train the RBF network weights. Different spreads () were trained and tested in order to find the best model. For obtaining this goal, a grid between interval of
is defined and best value for each output for different storage condition is obtain. The best number of neurons for different storage conditions were obtained through exhaustive search as well.
For evaluation of performance, R2 values are considered. Measured and estimated values of air cell and HU for training data and different storage condition are shown in and . As it is shown, the predicted and measured values are close together. For the learning step, the values for each case are shown in figures and all of them are above 0.87. The obtained results for testing data for one-fold of test data are shown in and , it shows the correlation between refrigerator data is slightly better than room data. The predictive model produced satisfactory results with a good coefficient of determination (R2 = 0.767) in the entire range of the HU; about 80% of the samples were characterized by a maximum error of ±7 unit (). The lower R2 value obtained for the eggs at room conditions compared with that obtained for the eggs in the refrigerator conditions can be attributed to liquefaction changes of thick white albumen during storage. The albumen change during storage can also contribute to the prediction of the air cell height. The prediction of the HU can be partially attributed to the air cell height.
FIGURE 6 Measured and estimated air cell height and Haugh unit: Ref (T: 5°C, RH: 75%).
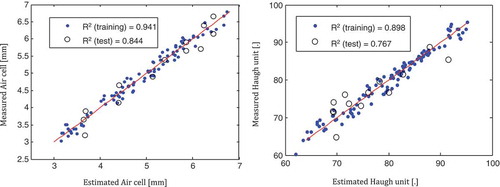
FIGURE 7 Measured and estimated air cell height and Haugh unit: Room (T: 25°C, RH: 40%).
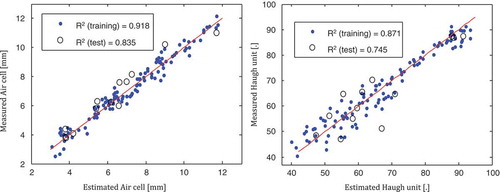
From the figures, one can note that the prediction of the HU is good for the values kept in refrigerator, while the technique seems to be able to discriminate eggs kept in room conditions. Improvements of the Vis-NIR spectroscopy technique can be pursued using a different fiber optic probe, and above all, taking into consideration all the information contained in different wavebands. The light transmitted through the entire egg would be appropriate for practical use in an on-line application. Results demonstrated that the Vis-NIR spectroscopy technique has potential for classification of egg shells, and the performance of the classification model can be improved by the feature extraction using PCA and RBF network.
CONCLUSIONS
In this research, non-destructive Vis-NIR spectroscopy and use of a fiber optic probe in direct contact of the egg shell was used to discriminate egg freshness during different storage conditions. To this end, the transmittance spectra of poultry eggs were analyzed and interpreted in terms of the main absorbance peaks. Then, RBF models using PCA and robust preprocessing methods were developed for prediction of HU and air cell height at spectral range of 300–1100 nm. The relationships between internal quality and different storage time, transmittance ratio versus different wavelengths and storage time were also developed. The transmission spectra measurements confirmed the good correlation between the spectral and observed data for HU and air cell height values. The developed models yielded a good prediction accuracy of HU for intact egg (R2 value 0.745 and 0.76) as well as air cell height (R2 value 0.835 and 0.844) for room and refrigerator conditions respectively. Although the suggested technology is not always able to correctly predict the freshness of single eggs, results indicated that the RBF network is suitable for a rough screening and it can be used to select lots characterized by a number of eggs with high freshness indices.
ACKNOWLEDGMENT
The authors are grateful to the laboratory of Agriculture Process Engineering, Kyoto University, for their technical support.
Related Research Data
REFERENCES
- Giunchi, A.; Berardinelli, A.; Ragni, L.; Fabbri, A.; Silaghi, F.A. Non-Destructive Freshness Assessment of Shell Eggs Using FT-NIR Spectroscopy. Journal of Food Engineering 2008, 89(2), 142–148.
- Aboonajmi, M.; Abbasian Najafabadi, T. Prediction of Poultry Egg Freshness Using Vis-NIR Spectroscopy with Maximum Likelihood Method. International Journal of Food Properties 2014, 17(10), 2166–2176.
- Bamelis, F.R.; Kemps, B.J.; Mertens, K.; Govaerts, T.; De Ketelaere, B.; Kamers, B.; Kokou, T.; Decuypere, E.; De Baerdemaeker, J. Non-Destructive Internal Egg Freshness Assessment Using VIS-NIR Spectroscopy. Xth European Symposium on the Quality of Egg and Eggs Products. Plougfragan, France, September 23–26, 2003.
- Berardinelli, A.; Giunchi, A.; Guarnieri, A.; Pezzi, F.; Ragni, L. Shell Egg Albumen Height Assessment by FT-NIR Spectroscopy. Transactions of the ASABE 2005, 48(4), 1423–1428.
- Kemps, B.J.; Bamelis, F.; De Ketelaere, B.; Mertens, K.M.; Decuypere, E.; De Baerdemaeker, J. Visible Transmission Spectroscopy for the Assessment of Egg Freshness. Journal of Science and Food in Agriculture 2006, 86, 1399–1406.
- Daszykowski, M.; Kaczmarek, K.; Vander Heyden, Y; Walczak, B. Robust Statistics in Data Analysis—A Review: Basic Concepts. Chemometrics and Intelligent Laboratory Systems 2007, 85(2), 203–219.
- Chai, W.; Junfei, Q. Non-Linear System Identification and Fault Detection Method Using RBF Neural Networks with Set Membership Estimation. International Journal of Modelling, Identification, and Control 2013, 20(2), 114–120.
- Song, M.; Dacheng, T.; Xiaoqin, H.; Chun, C.; Jiajun, B. Three-Dimensional Face Reconstruction from a Single Image by a Coupled RBF Network. Image Processing, IEEE Transactions 2012, 21(5), 2887–2897.
- Gan, M.; Han, L.; Hui, P. A Variable Projection Approach for Efficient Estimation of RBF-ARX Model. Cybernetics, IEEE Transactions 2015, 45(3), 476–485.
- Walczak, B.; Massart, D. The Radial Basis Functions—Partial Least Squares Approach As a Flexible Non-Linear Regression Technique. Analytica Chimica Acta 1996, 331(3), 177–185.
- Abdel-Nour, N.; Ngadi, M.; Prasher, S.; Karimi, Y. Prediction of Egg Freshness and Albumen Quality Using Visible/Near Infrared Spectroscopy. Food and Bioprocess Technology 2011, 4(5), 731–736.
- Karoui, R.; Schoonheydt, R.; Decuypere, E.; Nicolaï, B.; De Baerdemaeker, J. Front Face Fluorescence Spectroscopy As a Tool for the Assessment of Egg Freshness During Storage At a Temperature of 12.2°C and 87% Relative Humidity. Analytica Chimica Acta 2007, 582(1), 83–91.
- Lin, H.; Zhao, J.; Sun, L.; Chen, Q.; Zhou, F. Freshness Measurement of Eggs Using Near Infrared (NIR) Spectroscopy and Multivariate Data Analysis. Innovative Food Science & Emerging Technologies 2011, 12(2), 182–186.
- Ragni, L.; Cevoli, C.; Berardinelli, A. A Waveguide Technique for Non-Destructive Determination of Egg Quality Parameters. Journal of Food Engineering 2010, 100(2), 343–348.
- Zhao, J.; Lin, H.; Chen, Q.; Huang, X.; Sun, Z.; Zhou, F. Identification of Egg’s Freshness Using NIR and Support Vector Data Description. Journal of Food Engineering 2010, 98(4), 408–414.
- Haugh, R.R. A new method for determining the quality of an egg. US Egg Poultry 1937, 39, 27–49
- Refaeilzadeh, P.; Tang, L.; Liu, H. Cross-Validation. In Encyclopedia of Database Systems; Liu, L.; Ozsu, T.; Eds.; Springer: New York, 2009; 532–538.
- Nelles, O. Nonlinear System Identification: From Classical Approaches to Neural Networks and Fuzzy Models; Springer: New York, 2001.