
Abstract
Fracture creates complex surfaces. The aim of this work was to characterize the irregular surface generated in the fracture of maltodextrin thick-agglomerates using gray level intensities and texture features extracted by digital image analysis. Results showed that particle size had no significant effect on texture features and had a significant interaction with load. A 50 N load caused rougher surfaces, while a 500 N load produced smooth surfaces. Obtained values of texture fractal dimension were not higher than 2.23 and were related to image entropy.
INTRODUCTION
Maltodextrins are used as ingredients in food-related systems and as agglomerating agents in pharmaceutical applications.[Citation1] Maltodextrin is composed of β-D-glucose units linked by glycosidic bonds (β-1,4). This compound, when subjected to compression, forms brittle and rough agglomerates with cavities and pores[Citation2] which are highly susceptible to breakage.[Citation3] Breakage of food materials is a problem in the industry during storage and transport, and influence sensorial attributes.[Citation4,Citation5] The fracture occurs when bonds between structural elements break, resulting in the modification of the morphology of the product in several scales.[Citation6] The fracture behavior has been considered as an important feature to optimize food processes and the design of new products,[Citation7] so that breakage has been assessed to understand and analyze food texture.[Citation8]
Texture and sensory features, such as crispness and crunchiness, have been related to the force-deformation curve, peak force, and fracture points[Citation9] and is an important quality attribute in food products since they influence smoothness, coarseness, and graininess.[Citation10,Citation11] Texture is a parameter that has been traditionally measured by destructive techniques and rapid and non-destructive methods to measure texture need to be used. Digital image analysis (DIA) provides an adequate option to evaluate food quality texture. Image texture is defined as the distribution of gray level intensities of pixels in an image with relation to the spatial coordinates.[Citation12] Pedreschi et al.[Citation13] classified visual attributes of potato chips using pattern recognition from pixel information. Complexity and non-homogeneity described as texture image of dried apple discs was evaluated with a computer vision method by Fernández et al.[Citation14] The surface morphology of food materials after breakage has an irregular and complex texture which can be quantitatively characterized by a model-based parameter called texture fractal dimension (FDT). A fractal is an irregular object whose structural features appears the same, regardless the scale of observation.[Citation15] Fractal dimension extracted from DIA has been widely applied to analyze the surface of several materials.[Citation16,Citation17] Farrera-Rebollo et al.,[Citation18] found that fractal dimension was a good indicator of the bread crumb structure generated during baking. However, fractal dimension by itself does not describe how the image texture patterns fill the tri-dimensional space[Citation19] and lacunarity has been used as a complementary parameter of the fractal dimension since it measures the spatial distribution of gaps from translational invariance in datasets at a given scale. High-lacunarity sets contain gaps of divergent lengths and can be used to asses heterogeneous textures.[Citation20] Valous et al.[Citation21] evaluated lacunarity through the gliding-box method in ham surfaces, demonstrating that this parameter is useful for characterizing the texture in gray scale images.
Evaluation of image texture by DIA is based on a second order statistical method that measures the probability p(i, j) of two neighboring pixels of having a certain intensity in a specified distance (d) and direction (θ) arranged in a gray level co-ocurrence matrix (GLCM).[Citation22] Image entropy is a texture parameter based on this technique, which represents the disorder or randomness (i.e., recurrence of pixel pairs) of the image texture and is indicative of its complexity and heterogeneity.[Citation23] Several studies have related entropy with food texture.[Citation24–Citation26]
The analysis of the surface morphology of a food model represents an option to improve quality and processing conditions of food products. Recently, the breakage patterns of maltodextrin agglomerates and tortilla chips[Citation27,Citation28] described the morphology of the top view image of the breakage profile; however, information of the morphometry of the transverse surface generated by the fracture is needed for the understanding of the geometry of the structure of the resulting fragments. The aim of this study was to characterizing the surface texture of the transverse section of maltodextrin agglomerate fragments by means of gray level intensity and texture features (fractal dimension, lacunarity, and entropy) extracted from DIA.
MATERIALS AND METHODS
Preparation of Maltodextrin Agglomerates
Thick maltodextrin agglomerates in the form of round tablets (13 mm diameter, 2 mm thickness) were prepared with a hydraulic laboratory press (Carver, USA) and a 13 ton die (PerkinElmer, UK) as reported by Meraz-Torres et al.[Citation29] Two hundred grams of maltodextrin powder (moisture content: 7% w.b. and 20 DE) were sieved (53, 89, and 125 μm U.S. standard sieve series, W.S. Tyler Co., USA) to obtain three batches of defined particle size (PS) to prepare agglomerates in the form of tablets using conditions shown in .
TABLE 1 Factors and levels for the preparation and breakage of maltodextrin agglomerates
Experimental Design and Statistical Analysis
A completely randomized experimental design and a fully nested analysis of variance (ANOVA) were performed to evaluate the significance of the factors () on the following response variables: Young’s modulus and parameters used for the image texture analysis (gray level, fractal dimension, lacunarity, entropy). The effect of the factors on response variables was evaluated using main effects and interaction analyses. Statistical analyses were carried out with Minitab v.16 (Minitab Inc., USA) and SigmaPlot v.12 (Systat Softwares Inc., USA) softwares.
Breakage Tests
Maltodextrin agglomerates were subjected to bending–breakage with a compression and tensile testing machine (Instron, USA) fitted to a load cell and coupled to a probe schematically illustrated in . The breakage tests were performed at 50 mm/min vertical descending speed. Young’s modulus was estimated from the slope of the linear section of the stress–strain curve.[Citation30] Fragments of agglomerates after breakage were collected for analyses.
FIGURE 1 Geometry of the probe used for the breakage experiments (transverse perspective).
Image Acquisition and DIA
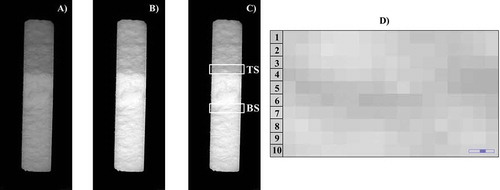
Images of the transverse exposed section of maltodextrin agglomerate fragments were captured with a Stereo Microscope (Nikon, Japan) with 0.03 mm/pixel scale and 640 × 480 pixels resolution. A day-light lamp (Stocker & Yale, USA) was used to provide top illumination of samples. Images of the transverse surface were analyzed with ImageJ v.1.49q (National Institutes of Health, Bethesda, USA) software to evaluate: FDT, lacunarity, and image entropy. FDT and lacunarity were determined with the FracLac 2015Febb5810 plugin of the ImageJ software; whereas image entropy was evaluated with GLCM Texture plugin. Image processing is depicted in and consisted of converting the original image (RGB-color; ) into 8-bit format (gray scale; ) followed by automated adjustment of brightness and contrast (). Then, two sections (0.3 × 2 mmCitation2) which were not part of the probe’s mark were cropped () from the adjusted image. Top and bottom sections (TS and BS, respectively) of probe’s mark were extracted for the analyses. Finally, the gray level intensity was calculated for each pixel location in both cropped sections. The mean of the gray level intensity for each row (; i.e., 10 pixels that conforms the height of the cropped section) was reported.
FIGURE 2 Schematic representation of DIA. Objects were converted into an (A) 8-bit image; followed by (B) automated adjustment of brightness and contrast; (C) crop sections; and (D) gray intensity level analysis. Numbers correspond to pixel row’s.
FDT
FDT was calculated with the box counting method set to the differential option (FracLac 2015Febb5810 plugin), which approximates the slope of the log-log relationship between box sixe (r) and the difference in intensity of gray level (I). I takes into account the maximum and minimum values of the gray level intensity in a given space within a box. FDT was determined from the slope of the regression line as follows:[Citation29]
Lacunarity
The differential lacunarity method was used in this study with FracLac 2015Febb5810 plugin. Dong[Citation32] introduced this method for gray scale images and is based on the gliding-box algorithm and the box counting method for calculating the fractal dimension. This method allows for analyzing the mass distribution in a deterministic or a random set as shown in Eq. (2):
where r is the size of the box (cubic shape), M is the mass distribution and Q(M, r) is the probability function. The mass M can be computed as the gliding-box moves with:
where i and j are image coordinates and the relative height of the image is:
v and u represent the minimum and maximum pixel values in the gliding-box.
Image entropy
The disorder or randomness of the gray scale images (measured as image entropy) was evaluated through a GLCM,[Citation33] using GLCM Texture plugin. Four directions of the texture image were used with: θ = 0, 45, 90, 180° and distance, d = 1.[Citation34] Thus, entropy was calculated as follows:[Citation35]
where p(i, j) is the probability of occurrence of two pixel gray values (i and j).
RESULTS AND DISCUSSION
Young’s Modulus (E)
No significant differences (p > 0.05) were found for E-values of maltodextrin agglomerates with PS and compaction force (CF). However, significant differences (p < 0.05) were observed among groups with different loads. High values of E (0.57 ± 0.29 GPa) were obtained when applying 50 N load, while lower values of E (0.01 ± 0.03 GPa) were observed when using 500 N load on the agglomerates. It has been reported[Citation34,Citation35] that E is a mechanical property of materials that depends on microstructure and composition. Low loads allowed larger deformations, resulting in a longer plastic behavior before the material was broken.
Image Texture Analysis
Gray level texture analysis
The applied load had an influence (p < 0.05) on the texture of the top section (TS) of the transverse zone of agglomerate fragments. When a 50 N load was applied, the gray levels of the pixels were lower than those with a 500 N load (). Materials subjected to a low load had more pixels toward black (darker surface; and ). Gray level intensity of pixels was between 0 and 255; 0 represents black and 255 represents white. The surface of the agglomerate fragments obtained as a consequence of a 50 N load had rougher texture than those obtained with 500 N load as given by the gray intensity values ( and ). Darkness may be attributed to the shadows observed in lower zones of the agglomerate image. Dan et al.[Citation36] found a similar result, in which the load affected the gray intensity of pixel distribution maps of broken crackers. PS of maltodextrin powder had no significant effect (p > 0.05) on the gray level intensity of TS of the transverse zone for greater PSs (89 and 125 µm; ). Gray level intensity values ranged 125–135 and the surface texture was independent of PS of maltodextrin powder.
FIGURE 3 Main effects plot of the analyzed factors for gray level of pixels of (A) top section (TS) and (B) bottom section (BS) of transverse zone of maltodextrin agglomerate fragments.
A significant effect (p < 0.05) of the CF was observed on the gray level intensity for TS of the transverse zone (). High CF caused a smoother surface texture, in which whiter pixels were observed. More compacted powder reduced the space among particles and less debris so forming a smooth surface. The effect of the CF on the porosity and tensile strength has been reported for granular hydroxyapatite powder; as compaction pressure increased, porosity decreased and tensile strength increased.[Citation37]
Pixel location in the cropped section of fragments affected gray level intensity of the image. Pixels closer to the probe mark (locations 6 to 10) were darker (i.e., lower gray level values) than distant pixels in respect to the edge of agglomerate (locations 1 to 5; ). Location of pixels in the image depends on its orientation and the presence of shadows was a consequence of rougher zones resulting after probe impact.
summarizes interactions among the factors for gray intensity level corresponding to TS. Both loads (50 and 500 N) affected gray level intensity value when interacting with PS = 125 µm. However, PS influenced pixel gray level intensity values when interacting with CF = 0.5 ton, whereas CF interacting with PS produced differences in pixel gray level intensity values for TS. Texture of the fragments was affected by load and CF and when PS = 125 μm, texture was modified. Use of interaction plots is not common in food science in spite that such plots aid understanding complex systems for optimization of products and processes.[Citation38]
FIGURE 4 Examples of (A, B) top section (TS) and (C, D) bottom section (BS) of the surface of agglomerate’s fragments without image processing obtained under applied load of (A, C) 50 N and (B, D) 500 N. (1) 8-bit image (gray scale) at 3200% zoom in which pixels are shown in detail. (2) Surface intensity gray plot obtained from (1). (p-value between loads = 0.047.)
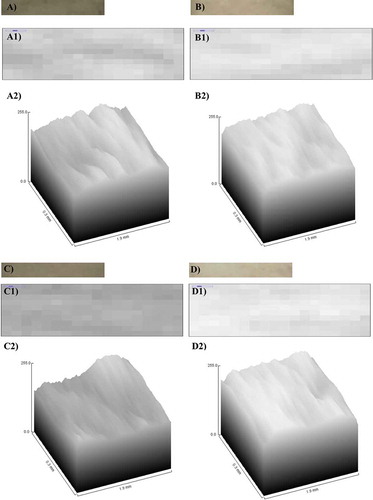
FIGURE 5 Interaction plots of the analyzed factors for gray level of pixels (A) of top section (TS) and (B) bottom section (BS) of transverse zone of maltodextrin agglomerate fragments. Interaction plot located at the intersection of the combination of the two factors selected.
Load had a significant effect (p < 0.05) on pixel gray level intensity of BS of the transverse zone, which was similar to behavior observed for TS (). When low loads were applied, texture of the transverse section became darker and rougher (). Texture of TS and BS was affected by the applied load so that low loads caused rougher surfaces ().
Results for BS of the transverse zone of fragments, showed that PS had no significant (p > 0.05) influence on gray level intensity. However, main differences () in gray level values were given by PS = 125 µm. Transverse section of agglomerates prepared with PS = 125 µm presented a smooth surface (pixels with tendency to white). A similar analysis was carried out for apple tissues in which the porosity determined by DIA was associated to texture firmness.[Citation39]
CF used in the elaboration of the maltodextrin agglomerates caused a significant influence (p < 0.05) in gray level intensity values of BS of the transverse zone (). Pixel location of BS (as in the case of TS) affected their gray level intensity values. Pixels that were close to the probe mark (locations 1 to 5) were blacker than those at other locations, indicating a rougher texture. Tan et al.[Citation40] found that statistical deviation of pixels of the cross section of a corn-extruded food preparation was related to sensorial perception of texture and was associated to changes in extrusion variables.
shows interaction plots among the analyzed factors for BS. Load and pixel location did not affect gray level intensity values when interacting with PS and CF. However, a significant interaction (p < 0.05) was found between PS and CF. PS affected the gray level intensity values of the pixels in BS when interacted to CF = 0.5. CF used on the preparation of agglomerates affected the gray level intensity values when PS = 89 µm.
FDT
shows mean FDT values for the analyzed factors. FDT values were not higher than 2.23 and were an indicator of the roughness and irregularity of the transverse surface of agglomerate fragments. A fractal dimension value in the range of 2–3 represents a surface have a tendency to fill a larger tridimensional space. According to the load used in the breakage test, no significant differences (p > 0.05) were observed for FDT. However, the analyzed cropped section affected significantly (p < 0.05) FDT, which had a higher value for BS which resulted in a more heterogeneous structure than for TS (). High FDT values have been associated to sensorial perception of having a rougher texture.[Citation41] On the other hand, PS did not have significant differences (p > 0.05) on FDT. The morphology of the transverse zone of fragments was independent of PS. A similar result was observed for CF (). The morphology of the transverse surface of agglomerate fragments was not modified by PS or CF.
TABLE 2 Image texture descriptors values as a response of the analyzed factors
Lacunarity
Load and PS had no significant (p > 0.05) effect on lacunarity of the image (). Similar results were obtained by Meraz-Torres et al.,[Citation1] which found that the fracture pattern created by the penetration of water into maltodextrin thick agglomerates had an influence on the homogeneity and symmetry of the surface. BS had lower lacunarity values and a higher symmetry was observed on the surface of the agglomerate fragment as compared to TS. BS was more homogeneous than TS, indicating that the irregularity of the surface was evenly distributed on the entire image.
Image entropy
Irregularity and heterogeneity of the surface of agglomerates was also described by image entropy. Image entropy measures randomness or uniformity of the gray level values through the distribution of pixels. Load had no significant (p > 0.05) effect on image entropy (). However, TS and BS changed the distribution of the spatial location of gray level intensity of the image significantly (p < 0.05). TS presented a higher entropy than BS () and was associated to a large dispersion of different pixel intensity.
A 500 N load and cropped section, significantly (p < 0.05) affected image entropy of the pixels (). This behavior can be related to FDT values, which also presented differences with the cropped section of the agglomerates. BS resulted in a smoother section than TS, thus showing lower image entropy. The complexity of images has been analyzed in fried snacks.[Citation24,Citation25] Authors found that image entropy decreases as image become more homogeneous in color and texture.
PS and CF caused no significant (p > 0.05) effect on image entropy values. It is noteworthy that FDT also supported these findings (see “FDT” section). Colín-Orozco et al.[Citation35] also reported that fractal dimension and image entropy described texture changes in fermented doughs. Texture features described the surface of the transverse section of maltodextrin agglomerates. FDT, lacunarity, and entropy characterized the surface as having a rough texture influenced by the location of the cropped section used for the image analysis.
It has been reported that breaking in surfaces of brittle food materials can be caused by previously existing cracks in the structure.[Citation42] A crack will spontaneously grow if the differential energy released during crack growth is larger than the stored energy.[Citation43] The path that the crack will follow in the material depends on the cavities or pores, small defects, and structural weak points.[Citation44]
CONCLUSIONS
Image texture analysis proved to be a useful tool for characterizing the surface of the structure of broken maltodextrin agglomerates. The morphology of the surface changed with the load applied for the breakage test and the cropped section by digital image techniques. FDT described a rougher texture with darker pixels in the image. The analyzed image texture features described the surface of the transversal section. FDT, lacunarity, and entropy characterized the surface as rough. FDT and image entropy described surface texture by gray level intensities. DIA is a suitable technique to detect differences in surface morphology as a result of a breakage process and can aid the assessment of the quality of brittle food-related products.
FUNDING
This work was supported by CONACyT-Mexico and SIP-IPN (20150613). Evangelina García-Armenta thanks CONACyT and IPN for funding.
Additional information
Funding
Related Research Data
REFERENCES
- Meraz-Torres, L.S.; Quintanilla-Carvajal, M.X.; Téllez-Medina, D.I.; Hernández-Sánchez, H.; Alamilla-Beltrán, L.; Gutiérrez-López, G.F. Water Droplet Spreading and Recoiling upon Contact with Thick-Compact Maltodextrin Agglomerates. Journal of the Science of Food and Agriculture 2011, 91, 2594–2600.
- Gabas, A.L.; Telis, V.R.N.; Sobral, P.J.A.; Telis-Romero, J. Effect of Maltodextrin and Arabic Gum in Water Vapor Sorption Thermodynamic Properties of Vacuum Dried Pineapple Pulp Powder. Journal of Food Engineering 2007, 82, 246–252.
- Fontanet, I.; Davidou, S.; Dacremont, C.; Le Meste, M. Effect of Water on the Mechanical Behaviour of Extruded Flat Bread. Journal of Cereal Science 1997, 25, 303–311.
- Abhyankar, A.R.; Mulvihill, D.M.; Auty, M.A.E. Combined Microscopic and Dynamic Rheological Methods for Studying the Structural Breakdown Properties of Whey Protein Gels and Emulsion Filled Gels. Food Hydrocolloids 2011, 25, 275–282.
- Rojo, F.J.; Vincent, J.F.V. Fracture Properties of Potato Crisps. International Journal of Food Science and Technology 2008, 43, 752–760.
- Zhang, J.; Daubert, C.R.; Foegeding, E.A. Fracture Analysis of Alginate Gels. Journal of Food Science 2006, 70, E425–E431.
- Wu, K.; Gunaratne, A.; Collado, L.S.; Corke, H.; Lucas, P.W. Adhesion, Cohesion, and Friction Estimated from Combining Cutting and Peeling Test Results for Thin Noodle Sheets. Journal of Food Science 2015, 80, E370–E376.
- Domagała, J. Instrumental Texture, Syneresis, and Microstructure of Yoghurts Prepared from Ultrafiltrated Goat Milk: Effect of Degree of Concentration. International Journal of Food Properties 2012, 15, 558–568.
- Saklar, S.; Ungan, S.; Katnas, S. Instrumental Crispness and Crunchiness of Roasted Hazelnuts and Correlations with Sensory Assessment. Journal of Food Science 1999, 64, 1015–1019.
- Tunick, M.H.; Onwulata, C.I.; Thomas, A.E.; Phillips, J.G.; Mukhopadhyay, S.; Sheen, S.; Liu, C.-K.; Latona, N.; Pimentel, M.R.; Cooke, P.H. Critical Evaluation of Crispy and Crunchy Textures: A Review. International Journal of Food Properties 2012, 16(5), 949–963.
- Fagan, C.C.; Du, C.J.; O’Donnell, C.P.; Castillo, M.; Everard, C.D.; O’Callaghan, D.J.; Payne, F.A. Application of Image Texture Analysis for Online Determination of Curd Moisture and Whey Solids in a Laboratory-Scale Stirred Cheese Vat. Journal of Food Science 2008, 73, E250–E258.
- Zheng, C.; Sun, D.-W.; Zheng, L. Recent Applications of Image Texture for Evaluation of Food Qualities—A Review. Trends in Food Science & Technology 2006, 17, 113–128.
- Pedreschi, F.; Mery, D.; Mendoza, F.; Aguilera, J.M. Classification of Potato Chips Using Pattern Recognition. Journal of Food Science 2004, 69, E264–E270.
- Fernández, L.; Castillero, C.; Aguilera, J.M. An Application of Image Analysis to Dehydration of Apple Discs. Journal of Food Engineering 2005, 67, 185–193.
- Mandelbrot, B.B. The Fractal Geometry of Nature; W.H. Freeman and Company: New York, NY, 1977.
- Pedreschi, F.; Aguilera, J.; Brown, C. Characterization of the Surface Properties of Chocolate Using Scale-Sensitive Fractal Analysis. International Journal of Food Properties 2002, 5, 523–535.
- Naji-Tabasi, S.; Mohebbi, M. Evaluation of Cress Seed Gum and Xanthan Gum Effect on Macrostructure Properties of Gluten-free Bread by Image Processing. Journal of Food Measurement and Characterization 2014, 9, 110–119.
- Farrera-Rebollo, R.R.; de la Salgado-Cruz, M.P.; Chanona-Pérez, J.; Gutiérrez-López, G.F.; Alamilla-Beltrán, L.; Calderón-Domínguez, G. Evaluation of Image Analysis Tools for Characterization of Sweet Bread Crumb Structure. Food and Bioprocess Technology 2012, 5, 474–484.
- Li, L.; Chang, L.; Ke, S.; Huang, D. Multifractal Analysis and Lacunarity Analysis: A Promising Method for the Automated Assessment of Muskmelon (Cucumis Melo L.) Epidermis Netting. Computers and Electronics in Agriculture 2012, 88, 72–84.
- Charisis, V.S.; Hadjileontiadis, L.J.; Sergiadis, G.D. Lacunarity-Based Inherent Texture Correlation Approach for Wireless Capsule Endoscopy Image Analysis. IFMBE Proceedings 2014, 41, 297–300.
- Valous, N.A.; Sun, D.-W.; Allen, P.; Mendoza, F. The Use of Lacunarity for Visual Texture Characterization of Pre-Sliced Cooked Pork Ham Surface Intensities. Food Research International 2010, 43, 387–395.
- Park, B.; Chen, Y.R. Co-Occurrence Matrix Texture Features of Multi-Spectral Images on Poultry Carcasses. Journal of Agricultural Engineering Research 2001, 78, 127–139.
- De la Casa Almeida, M.; Serrano, C.S.; Rejano, J.J.J.; Díaz, J.R.; Lugo, M.L.B.; Roldán, J.R.R. Reliability of Texture Analysis Using Co-Occurrence Matrices (GLCM) on Photographic Image in the Assessment of Cellulite in a Spanish Population. Journal of the European Academy of Dermatology and Venereology 2014, 29(2), 315–324.
- Mendoza, F.; Dejmek, P.; Aguilera, J.M. Colour and Image Texture Analysis in Classification of Commercial Potato Chips. Food Research International 2007, 40, 1146–1154.
- Mohammadi Moghaddam, T.; BahramParvar, M.; Razavi, S.M.A. Effect of Frying Temperature and Time on Image Characterizations of Pellet Snacks. Journal of Food Science and Technology 2014, 52, 2958–2965.
- Semary, N.A.; Tharwat, A.; Elhariri, E.; Hassanien, A.E. Fruit-Based Tomato Grading System Using Features Fusion and Support Vector Machine. Advances in Intelligent Systems and Computing 2015, 323, 401–410.
- García-Armenta, E.; Téllez-Medina, D.I.; Sánchez-Segura, L.; Alamilla-Beltrán, L.; Hernández-Sánchez, H.; Gutiérrez-López, G.F. Multifractal Breakage Pattern of Tortilla Chips As Related to Moisture Content. Journal of Food Engineering 2016, 168, 96–104.
- García-Armenta, E.; Téllez-Medina, D.I.; Alamilla-Beltrán, L.; Arana-Errasquín, R.; Hernández-Sánchez, H.; Gutiérrez-López, G.F. Multifractal Breakage Patterns of Thick Maltodextrin Agglomerates. Powder Technology 2014, 266, 440–446.
- Meraz-Torres, L.S.; Quintanilla-Carvajal, M.X.; Hernández-Sánchez, H.; Téllez-Medina, D.I.; Alamilla-Beltrán, L.; Gutiérrez-López, G.F. Assessment of the Kinetics of Contact Angle During the Wetting of Maltodextrin Agglomerates. Revista Mexicana de Ingeniería Química 2011, 10, 273–279.
- Mizuno, N.; Ogawa, T.; Adachi, S. Shrinkage and Tensile Stress of Sheet-Like and Cylindrical Pastas with Various Moisture Contents. Food Bioscience 2013, 2, 10–14.
- Smith, T.G.; Lange, G.D.; Marks, W.B. Fractal Methods and Results in Cellular Morphology—Dimensions, Lacunarity, and Multifractals. Journal of Neuroscience Methods 1996, 69, 123–136.
- Dong, P. Test of a New Lacunarity Estimation Method for Image Texture Analysis. International Journal of Remote Sensing 2000, 21, 3369–3373.
- Haralick, R.M.; Shanmugam, K.; Dinstein, I. Textural Features for Image Classification. IEEE Transactions on Systems, Man, and Cybernetics 1973, 3, 611–621.
- Ramos, E.; Fernández, D.S. Classification of Leaf Epidermis Microphotographs Using Texture Features. Ecological Informatics 2009, 4, 177–181.
- Colín-Orozco, J.; Chanona-Pérez, J.; Perea-Flores, M.J.; Pedroza-Islas, R. Changes in Large-Deformation Properties During Dough Fermentation by Lactobacillus Strains and Their Relationship with Microstructure. Revista Mexicana de Ingeniería Química 2014, 13, 457–471.
- Dan, H.; Azuma, T.; Kohyama, K. Characterization of Spatiotemporal Stress Distribution During Food Fracture by Image Texture Analysis Methods. Journal of Food Engineering 2007, 81, 429–436.
- Wade, J.B.; Martin, G.P.; Long, D.F. A Methodological Approach for Determining the Effect of Moisture Content on the Compaction Properties of Powders: Granular Hydroxyapatite. Powder Technology 2013, 246, 511–519.
- Manikan, V.; Kalil, M.S.; Hafez, M.; Isa, M.; Hamid, A.A. Improved Prediction for Medium Optimization Using Factorial Screening for Docosahexaenoic Acid Production by Schizochytrium sp. SW1, American Journal of Applied Sciences 2014, 11, 462–474.
- Ting, V.J.L.; Silcock, P.; Bremer, P.J.; Biasioli, F. X-Ray Micro-Computer Tomographic Method to Visualize the Microstructure of Different Apple Cultivars. Journal of Food Science 2013, 78, E1735–E1742.
- Tan, J.; Gao, X.; Hsieh, F. Extrudate Characterization By Image-Processing. Journal of Food Science 1994, 59, 1247–1250.
- Quevedo, R.; López-G.C.; Aguilera, J.M.; Cadoche, L. Description of Food Surfaces and Microstructural Changes Using Fractal Image Texture Analysis. Journal of Food Engineering 2002, 53, 361–371.
- Luyten, H.; Plijter, J.; Van Vliet, T. Crispy/Crunchy Crusts of Cellular Solid Foods: A Literature Review with Discussion. Journal of Texture Studies 2004, 35, 445–492.
- Marder, M.; Gross, S. Origin of Crack Tip Instabilities. Journal of Mechanics and Physics of Solids 1995, 43, 1–48.
- Luyten, H.; Van Vliet, T. Acoustic Emission, Fracture Behavior, and Morphology of Dry Crispy Foods: A Discussion Article. Journal of Texture Studies 2006, 37, 221–240.