
Abstract
“Rambak” crackers are one of the traditional foods consumed among Indonesian people made from various kinds of animal skin. The present study highlights the analysis of lard obtained from extraction of “rambak” crackers using Fourier transform infrared (FTIR) spectroscopy in combination with chemometrics of partial least square and principle component analysis. FTIR spectroscopy at wavenumber regions of 1200–1000 cm–1 was successfully used for quantification and classification of lard in “rambak” crackers. The relationship between actual value of lard and Fourier transform infrared predicted value has R2 value of 0.946 with low errors in calibration and validation models. Furthermore, the chemometrics principle component analysis can be successfully used for determination of pig skin through analysis of lard in commercial “rambak” crackers. The developed method (FTIR spectroscopy coupled with chemometrics) is rapid and reliable for quantification and classification of lard in “rambak” crackers.
INTRODUCTION
Krupuk “rambak” or “rambak” cracker, is one of the traditional foods in Indonesia that is made from various kinds of animal skins such as buffalo, cattle, or pig. This food is traditionally hand made with traditional processes. One of the interesting issues in the food industry is the authenticity of food products. The authenticity of food products can involve the alteration of the true labeling of food ingredients, in which the high value of raw materials are substituted by cheaper materials such as substitution of cow skin with pig skin.[Citation1] The verification of labeled components in any food products is necessary in order to prevent the adulteration practice. For this purpose, some countries make regulation for assuring that food products available are safe and authentic,[Citation2] especially if food products contain pig derivatives like pig skin.
The presence of pig derivatives such as pig skin, lard, pork and porcine gelatin in any food products is a serious matter for certain community,[Citation3] because some religions like Islam, Judaism, and Hinduism forbid their followers to consume any food products containing porcine and its derivatives.[Citation4] Therefore, it is necessary to evaluate the presence of these pig derivatives in any products using some instrumental techniques. Such techniques used are differential scanning calorimetry,[Citation5,Citation6] gas chromatography-mass spectrometry,[Citation7] high-performance liquid chromatography,[Citation8,Citation9] electronic nose,[Citation10,Citation11] proton nuclear magnetic resonance[Citation12] and DNA-based methods using polymerase chain reaction.[Citation13,Citation14] Some of these methods are too laborious and time consuming, consequently, an analytical technique offering rapid and reliable must be used. One of the promising methods suitable for routine analysis is Fourier transform infrared (FTIR) spectroscopy, especially in combination with some chemometrics techniques.
The use of FTIR spectroscopy in food analysis increased significantly. This is due to its properties as fingerprint technique, which can be used for qualitative and quantitative analyses.[Citation15] Some researchers have reported the application of FTIR spectroscopy for analysis of pig derivatives. Previous research used FTIR spectroscopy for rapid discrimination of pork in Halal and non-Halal Chinese ham sausages.[Citation16] Previous research has also shown the potential application of FTIR spectroscopy for analysis of lard in cake formulation[Citation17] and chocolate products.[Citation18] Our group also developed FTIR spectroscopy in combination with chemometrics for analysis of pork in beef meatballs,[Citation19] lard in meatball broth,[Citation20] and rat’s meat in beef meatballs.[Citation21] Differentiation of porcine and bovine gelatins was successfully determined using FTIR spectroscopy.[Citation22] Using literature review, there is no publication reporting the employment of FTIR spectroscopy for identification and quantification of crackers made from cow skin adulterated with pig skin. Therefore, in this study, FTIR spectroscopy combined with chemometrics is employed for analysis of lard in “rambak” crackers.
MATERIALS AND METHODS
In order for a wide application of species detection methods of commercial samples, the skins of cow and pig were randomly obtained from some slaughter houses in Jogjakarta, Indonesia by taking into account the different feeding of corresponding animals. The materials used for making crackers formulation were purchased from local markets around Yogyakarta, Indonesia. All solvents used for analysis were of pro analytical grade.
Preparation of “Rambak” Cracker
“Rambak” crackers were prepared by fresh skin from slaughter houses such as cow, buffalo, and pig. The skin used was cleaned before frying. Skin was soaked overnight with a composition of 1 kg skin, 0.4 kg CaCO3, and 5 L water. The function of soaking is to make the hide swell, which, in turn, is easier to remove the hair. After soaking is complete, the skin is washed by running water until it is clean with no flavor. Subsequently, the skin is boiled at 100°C for 2 h. After that, the skin is cut into smaller sizes and steamed with flavor for 1 h. The skin is dried using sunlight for 2–3 days. The final product is ready to begin the frying process.
Extraction of Lipid Fraction
“Rambak” crackers, either prepared from a laboratory or from commercial samples, were further subjected to Soxhlet extraction. The extraction process involved the use of hexane as an extracting solvent as described by Association of Official Analytical Chemists (AOAC).[Citation23] The lipid fraction yielded was further used for FTIR spectral measurement.
Preparation of Calibration and Validation Samples
The calibration sets were made by preparing pig skin and cow skin in “rambak” crackers with different concentration of pig skin, namely 10, 20, 30, 40, 50, 60, 70, 80, and 90%. “Rambak” crackers containing 100% pig skin and 100% cow skin were also prepared in order to observe FTIR spectra differentiation. For validation or prediction models, another series of “rambak” crackers prepared from the blending of pig skin and cow skin were made. The “rambak” crackers were further subjected to Soxhlet extraction. The lipid fraction obtained was scanned using a FTIR spectrophotometer. The spectral regions where the variations were observed were chosen for developing the calibration model.
Analysis Using FTIR Spectroscopy
Measurement of FTIR spectra of lipid fraction extracted from calibration and validation samples as well as commercial “rambak” crackers is performed using an ABB MB3000 FTIR spectrophotometer (Clairet Scientific, Northampton, UK) in the mid-infrared region of 400–4000 cm−1. This instrument is equipped with deuterated triglycine sulphate (DTGS) detector, with a resolution of 8 cm−1 and 32 scanning. Spectra were processed using Horizon MB FTIR software version 3.0.13.1 (ABB, Canada). The samples were placed in good contact with attenuated total reflectance (ATR) accessory using ZnSe crystal at controlled ambient temperature (20°C). All spectra were rationed against a background of air spectrum. After every scan, a new reference air background spectrum was taken. These spectra were recorded as absorbance values at each data point in triplicate.
Statistical Analysis
The quantitative analysis of lard (lipid fraction extracted from pig skin) was performed using partial least square (PLS) calibration with the aid of Horizon MB software (Canada). The validation samples were used to verify the calibration model. The values of root mean standard error of calibration (RMSEC) and coefficient of determination (R2) were used as the validity criteria for the calibration model. While, the root mean square error of prediction (RMSEP) and R2 were used for validity criteria of validation model.[Citation24] The classification of “rambak” crackers made from pig skin and cow skin was carried with chemometrics of principle component analysis (PCA) using Horizon MB software included in FTIR spectrophotometer.[Citation25]
RESULTS AND DISCUSSIONS
FTIR Spectral Analysis
Lipid fraction obtained during Soxhlet extraction was analyzed using FTIR spectrophotometer at mid infrared region (4000–650 cm–1). FTIR spectroscopy can be an ideal technique for analysis of lipids, due to its property as fingerprint technique allowing an analyst to differentiate among samples. IR spectra can be used as means for identification (qualitative analysis) and quantitative analysis based on Beer’s law.[Citation15] The importance of IR spectroscopy for the qualitative analysis comes from the much information contents obtained and the possibility to assign certain absorption bands related to the functional groups. In fats and oils, most of the peaks and shoulders of the spectrum are attributable to specific functional groups present in fats and oils.[Citation26]
revealed FTIR spectra of lipid fraction extracted from “rambak” cracker containing 100% cow skin (beef fat) and 100% pig skin (lard) at mid-infrared region (4000–650 cm–1). Both spectra look very similar and show a typical absorption bands for common edible fats and oils. The assignments of major peaks and shoulders were shown in . The main characteristic of FTIR spectra is its fingerprint technique, as a consequence, FTIR spectra can be used as a means for the differentiation of fats and oils.[Citation27] Upon a closer scrutiny, the peaks at fingerprint regions (1500–6650 cm–1) showed minor differences (peak heights), especially at wavenumbers of 1118 and 1096 cm–1 (assigned with j and k in ) corresponding to the vibrations of C-H bending and C-H deformation of fatty acids, respectively. showed the enlarged FTIR spectra at fingerprint regions. The different peaks in terms of peak intensity was used as a means for selecting the spectral regions for the quantification and classification of lard in “rambak” crackers samples. Similar result also has been shown in our previous research that lard had an approximate equal proportion of saturated acyl groups and oleic acyl group which was reflected in the lard spectra, in which peaks of 1119 and 1100 cm–1 appeared as having the same height.[Citation28]
TABLE 1 The functional groups responsible for infrared absorption of lard (extracted from “rambak” crackers contained 100% pig skin) and beef fat (extracted from “rambak” crackers contained 100% pig skin)
FIGURE 1 FTIR spectra of lipid fraction extracted from “rambak” cracker containing 100% cow skin (beef fat) and 100% pig skin (lard) at mid infrared region (4000–650 cm–1).
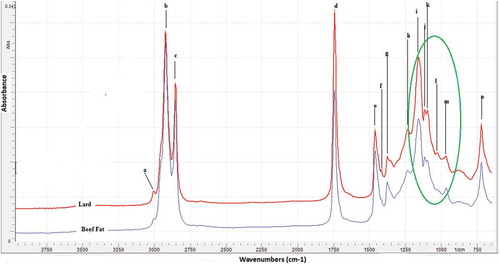
FIGURE 2 The enlarged FTIR spectra at fingerprint regions (1500–650 cm–1) used for selecting wavenumbers for quantitative analysis and classification of lard in “rambak” crackers.
Based on the fingerprint technique, meaning that there is no two compounds or samples having the same spectra in terms of amount and intensity of peaks, FTIR spectroscopy can be used to extract a difference among these fats. Upon a closer scrutiny, the minor differences (peak heights) can be attainable at 1117 and 1097 cm−1 (l and m) corresponding to C–H bending vibration and C–H deformation vibrations of fatty acids, respectively. Hence, these frequencies, which FTIR spectra variations were observed, are used as a basis for choosing the spectral regions in the quantification of pork fat in “rambak” crackers samples.[Citation19]
Quantification of Lard in “Rambak” Crackers
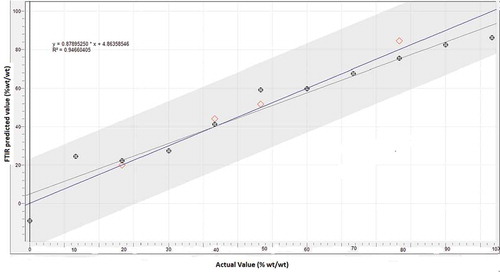
Quantification of lard (lipid obtained from “rambak” crackers containing pig skin) in calibration and validation samples is performed with the aid of multivariate calibration of PLS. Some wavenumbers are optimized in order to find the optimum wavenumbers offering good correlation between actual value of lard and FTIR predicted value. Finally, we used wavenumbers region of 1200–1000 cm–1 for quantification of lard due to its capability to offer the best prediction model for the relationship between actual value of lard and FTIR predicted values. Besides, this wavenumber also offer the highest coefficient of determination (R2) and the lowest values of errors in calibration (RMSEC) and prediction (RMSEP).
exhibited the calibration model for the relationship between actual value of lard (x-axis) and FTIR predicted value (y-axis), as determined using multivariate calibration of PLS using normal spectra at wavenumbers of 1200–1000 cm–1. The coefficient of determination (R2) obtained is high, i.e., 0.946 meaning that the calibration models can describe the accuracy of 94.6%. In addition, the calibration error expressed with RMSEC is low (2.77%). The calibration model was further evaluated using validation or validation samples. The values of R2 (0.997) and RMSEP (2.77%) were obtained. From this result, it is obvious that FTIR spectroscopy combined with multivariate calibration of PLS provide the accurate and precise results with high R2 values and low errors (RMSEC and RMSEP values) for analysis of lard in “rambak” crackers.
FIGURE 3 The relationship between actual value (x-axis) and FTIR predicted value (y-axis) of lard, obtained from “rambak” crackers containg pig skin at wavenumbers 1200–1000 cm–1 with the aid of multivariate calibration of partial least square.
Classification of “Rambak” Crackers with Pig and Cow Skin
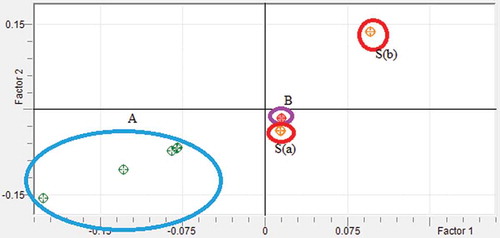
The chemometrics of PCA was used as means for the classification of “rambak” crackers with pig skin and cow skin. The wavenumber regions for PCA were also optimized based on its capability to separate between pig skin and pig cow present in “rambak” crackers. Finally, the wavenumbers used for quantitative analysis (1200–1000 cm–1), was chosen for PCA. revealed the score plot of PCA of pig skin, cow skin contained in “rambak”crackers, as well as commercial “rambak” crackers, describing the projection of samples defined by the first principle component (PC 1) and the second principle component (PC 2). Using this projection, “rambak” crackers containing pig skin, cow skin, and commercial “rambak” crackers are well separated. This means that PCA can accomplish the classification among them. Based on this profile, it can be stated that commercial samples (region B) do not contain pig skin in the products.
FIGURE 4 The Score plot of first principal components (PC1) and second principal components (PC2) of “rambak” crackers made from 100% cow skin (A) 100% pig skin (B), and selected commercial samples (Sa, Sb).
CONCLUSIONS
The non-destructive technique for the detection and quantification of pig skin adulteration in commercial “rambak” crackers based on lard analysis could be developed using FTIR spectroscopy combined with PLS (for quantification) and PCA (for classification). PLS calibration model revealed good calibration and validation models as indicated by high value of R2 and low value of RMSEC and RMSEP. Furthermore, PCA using absorbance at wavenumbers 1200–1000 cm–1 is capable of classification among samples as illustrated by clear separation among the evaluated samples.
FUNDING
This research was supported by project grant from the directorate of higher education, Ministry of Higher Education and Culture, with Contract No. 159/LPPM/2015.
Additional information
Funding
Related Research Data
REFERENCES
- Al-Jowder, O.; Kemsley, E.K.; Wilson, R.H. Mid-Infrared Spectroscopy and Authenticity Problems in Selected Meats: A Feasibility Study. Food Chemistry 1997, 59, 195–201.
- Doosti, A.; Ghasemi, D. P.; Rahimi, E. Molecular Assay to Fraud Identification of Meat Products. Journal of Food Science and Technology 2014, 51, 148–52. DOI:10.1007/s13197-011-0456-3
- Mursyidi, A. The Role of Analytical Chemistry in Halal Certification. Journal of Food and Pharmaceutical Sciences 2013, 1, 1–4.
- Regenstein, J.M.; Chaudry, M.M.; Regenstein, C.E. The Kosher and Halal Food Laws. Comprehensive Reviews in Food Science and Food Safety 2003, 2, 111–127.
- Nurrulhidayah, A.F.; Arieff, S.R.; Rohman, A.; Amin, I.; Shuhaimi, M.; Khatib, A. Detection of Butter Adulteration with Lard Using Differential Scanning Calorimetry. International Food Research Journal 2015, 22, 832–839.
- Marikkar, J.M.N.; Dzulkify, M.H.; Nadiha, M.Z.N.; Man, Y.B.C. Detection of Animal Fat Contaminations in Sunfower Oil by Differential Scanning Calorimetry. International Journal of Food Properties 2012, 15, 683–690.
- Nizar, N.N.A.; Marikkar, J.M.N.; Hashim, D.M. Differentiation of Lard, Chicken Fat, Beef Fat, and Mutton Fat by GCMS and EA-IRMS Techniques. Journal of Oleo Science 2013, 62, 459–464.
- Saeed, T.; Ali, S.G.; Rahman, H.A.; Sawaya, W.N. Detection of Pork and Lard As Adulterants in Processed Meat: Liquid Chromatographic Analysis of Derivatized Triglycerides. Journal of the Association of Official Analytical Chemists 1989, 72, 921–925.
- Marikkar, J.M.N.; Ghazali, H.M.; Che Man, Y.B.; Peiris, T.S.G.; Lai, O.M. Distinguishing Lard From Other Animal Fats in Admixtures of Some Vegetable Oils Using Liquid Chromatographic Data Coupled with Multivariate Data Analysis. Food Chemistry 2005, 91, 5–14.
- Nurjuliana, M.; Che Man, Y.B.; Mat Hashim, D. Analysis of Lard’s Aroma by An Electronic Nose for Rapid Halal Authentication. Journal of the American Oil Chemists’ Society 2011, 88, 75–82.
- Mansor, T.S.T.; Che Man, Y.B.; Rohman, A. Application of Fast Gas Chromatography and Fourier Transform Infrared Spectroscopy for Analysis of Lard Adulteration in Virgin Coconut Oil. Food Analytical Methods 2011, 4, 365–372.
- Fang, G.; Goh, J.Y.; Tay, M.; Lau, H.F.; Li, S.F.Y. Characterization of Oils And Fats By 1H NMR and GC/MS fingerprinting: Classification, Prediction, and Detection of Adulteration. Food Chemistry 2013, 138, 1461–1469.
- Erwanto, Y.; Abidin, M.Z.; Muslim, E.Y.P.; Sugiyono; Rohman, A. Identification of Pork Contamination in Meatballs of Indonesia Local Market Using Polymerase Chain Reaction-Restriction Fragment Length Polymorphism (PCR-RFLP) Analysis. Asian Australasian Journal of Animal Science 2014, 27, 1487–1492.
- Maryam, S.; Sismindari; Raharjo, T.J.; Sudjadi; Rohman, A. Analysis of Porcine Contamination in Dendeng Using Mitochondrial D-Loop 686 and Cyt B Gene Primers by Real Time Polymerase Chain Reaction. International Journal of Food Properties 2015, 19, 2127–2134.
- Guillen, M.D.; Cabo, N. Characterization of Edible Oils and Lard by Fourier Transform Infrared Spectroscopy. Relationships Between Composition and Frequency of Concrete Bands in the Fingerprint Region. Journal of American Oil Chemists’ Society 1997, 74, 1281–1286.
- Xu, L.; Cai, C.B.; Cui, H.F.; Ye, Z.H.; Yu, X.P. Rapid Discrimination of Pork in Halal and Non-Halal Chinese Ham Sausages by Fourier Transform Infrared (FTIR) Spectroscopy and Chemometrics. Meat Science 2012, 92, 506–510. DOI:10.1016/j.meatsci.2012.05.019
- Syahariza, Z.A.; Che Man, Y.B.; Selamat, J.; Bakar, J. Detection of Lard Adulteration in Cake Formulation by Fourier Transform Infrared (FTIR) Spectroscopy. Food Chemistry 2005, 92, 365–371.
- Che Man, Y.B.; Syahariza, Z.A.; Mirghani, M.E.S.; Jinap, S.; Bakar, J. Analysis of Potential Lard Adulteration in Chocolate and Chocolate Products Using Fourier Transform Infrared Spectroscopy. Food Chemistry 2005, 90, 815–819.
- Rohman, A.; Sismindari; Erwanto, Y.; Che Man, Y.B. Analysis of Pork Adulteration in Beef Meatball Using Fourier Transform Infrared (FTIR) Spectroscopy. Meat Science 2011, 88, 91–95.
- Kurniawati, E.; Rohman, A.; Triyana, K. Analysis of Lard in Meatball Broth Using Fourier Transform Infrared Spectroscopy and Chemometrics. Meat Science 2014, 96, 94–98.
- Rahmania, H.; Sudjadi; Rohman, A. The Employment of FTIR Spectroscopy in Combination with Chemometrics for Analysis of Rat’s Meat in Meatball Formulation. Meat Science 2015, 100, 301–305. DOI:10.1016/j.meatsci.2014.10.028
- Hashim, D.M.; Che Man, Y.B.; Norakasha, R.; Shuhaimi, M.; Salmah, Y.; Syaharza, Z.A. Potential Use of Fourier Transform Infrared Spectroscopy for Differentiation of Bovine and Porcine Gelatins. Food Chemistry 2010, 118, 856–860.
- AOAC. (Association of Official Analytical Chemists). Official Methods of Analysis, 16th Ed; Gaithersburg, MD: AOAC International, 1995.
- Paradkar, M.M.; Sivakesava, S.; Irudayaraj, J. Discrimination and Classification of Adulterants in Maple Syrup with the Use of Infrared Spectroscopic Techniques. Journal of the Science of Food and Technology 2002, 82, 497–504.
- Miller, J.N.; Miller, J.C. Statistics and Chemometrics for Analytical Chemistry, 5th Ed; Essex, England: Pearson Education Limited, Edinburgh Gate Harlow, 2005; 213–239.
- Bendini, A.; Cerretani, L.; Di Virgilio, F.; Belloni, P.; Bonoli-Carbognin, M.; Lercker, G. Preliminary Evaluation of the Application of the FTIR Spectroscopy to Control the Geographic Origin and Quality of Virgin Olive Oils. Journal of Food Quality 2007, 30, 424–437.
- Che Man, Y.B.; Rohman, A.; Mansor, T.S.T. Differentiation of Lard from Other Edible Oils by Means of Fourier Transform Infrared Spectroscopy and Chemometrics. Journal of the American Oil Chemists’ Society 2011, 88, 187–192.
- Rohman, A. Differentiation of Lard from Other Edible Oils by Means o Fourier Transform Infrared Spectroscopy and Chemometrics. Journal of the American Oil Chemists’ Society 2011, 88, 187–192.
- Vlachos, N.; Skopelitis, Y.; Psaroudaki, M.; Konstantinidou, V.; Chatzilazarou, A.; Tegou, E. Applications of Fourier Transform–Infrared Spectroscopy to Edible Oils. Analytica Chimica Acta. 2006, 573–574, 456–465.