
ABSTRACT
Milk is a highly nutritional food, and separation of major allergens from milk has become important to people who are allergic. The aim of this study was to establish a simple and repeatable method for the isolation of α-lactalbumin and β-lactoglobulin from cow’s milk while preserving their antigenicity. Fractions of α-lactalbumin and β-lactoglobulin were salted-out using 50% ammonium sulfate from whey that was collected from cow’s milk after pH adjustment and then purified by anion-exchange chromatography with diethylaminoethyl-Sepharose Fast Flow. The antigenicity of the purified proteins was evaluated by indirect competitive enzyme-linked immunosorbent assay. The results showed that the purities of the α-lactalbumin and β-lactoglobulin collected were 84.85 and 94.91% and the cross-reactivities of the purified proteins were 93.2 and 95.4%, respectively. Therefore, this simple and efficient strategy consisting of a one-step process for α-lactalbumin and β-lactoglobulin is suitable for purifying the major allergens in cow’s milk. In addition, a scientific experimental basis for the preparation of non-allergenic milk was also offered in this study.
Introduction
Cow’s milk allergy is a common disease during infancy and early childhood.[Citation1] If a baby is not breast-fed, it is necessary to find other formulas made with cow’s milk that are similar to breast milk.[Citation2] An epidemiological study claimed that the most prevalent allergy, with an incidence of 0.3–7.5%, for infants and early children is cow’s milk protein allergy.[Citation3] More than 32 proteins (allergens) in cow’s milk can cause allergic reactions.[Citation4] Most studies revealed that the major allergens in cow’s milk are α-lactalbumin (α-LA), β-lactoglobulin (β-LG) and caseins.[Citation5,Citation6] Among people who are allergic to milk, 51% are allergic to α-LA and 82% are allergic to β-LG.[Citation7] Studying the molecular and antigenic characteristics of food antigens can provide information on the potential mechanisms of food hypersensitivity reactions. Therefore, it is essential to purify and identify the allergens.[Citation8]
Several methods for the isolation of α-LA and β-LG from whey have been reported, including precipitation at low pH, salting-out,[Citation9] selective precipitation,[Citation10] gel filtration chromatography,[Citation11–Citation13] pepsin hydrolysis followed by ultrafiltration membrane filtration,[Citation14,Citation15] and other chromatographic methods.[Citation16–Citation18] Although these fractionation techniques can provide effective protein purification at the laboratory scale, most have not been widely implemented at the commercial scale because most of these methods are expensive or inconvenient and induce protein denaturation. In addition, the product would be contaminated by the added salts.
In this study, to investigate the production and antigenic properties of α-LA and β-LG and avoid all possible denaturing conditions for the native protein, we present a simple and efficient strategy that consists of a one-step process for α-LA and β-LG isolation. Subsequently, these antigens (α-LA and β-LG) were assessed for purity by high-performance liquid chromatography (HPLC) and analyzed by enzyme-linked immunosorbent assay (ELISA).
Materials and methods
Pretreatment of cow’s milk
Five liters of fresh milk (3.0% protein, 3.0% fat, and 3.8×10⁴ somatic cell count/mL) from Holstein cows was purchased from a mechanized dairy farm (Xiangfang, Harbin, China) and centrifuged at 16,000 × g for 45 min at 4°C in a refrigerated centrifuge (Shanghai Centrifuge Institute Co., Ltd., Shanghai, China) to defat. The pH of 1 L of the skimmed milk was adjusted to 4.5 with 1 mol/L HCl as measured by a Delta 320 pH meter (Mettler-Toledo, Schwerzenbach, Switzerland); subsequently, the sample was water-bath heated to 40°C for 30 min to precipitate casein. The whey supernatant was collected after centrifugation at 16,000 × g for 20 min at 4°C and then precipitated with 50% ammonium sulfate, dialyzed (cut-off 1 kDa) and freeze-dried in a freezer (Alpha 1-2/LD plus, Christ, Germany).
The optimal concentration of ammonium sulfate
Fine ammonium sulfate powder was added in eight whey samples to yield a 10 to 90% final saturation of ammonium sulfate. The samples were kept at 4°C overnight to precipitate protein and then centrifuged at 16,000 × g for 15 min at 4°C. Supernatant and pellets were collected. The samples were dialyzed using dialysis tubing with a 3000 Da molecular weight cut-off (Millipore, Bedford, MA, USA) and freeze-dried, and then control and treatment samples at 1 mg/mL final concentration were analyzed by sodium dodecyl sulfate-polyacrylamide gel electrophoresis (SDS-PAGE) to determine the fractional precipitation of the optimal ammonium sulfate saturation.
SDS-PAGE
The identification of separated α-LA and β-LG fractions was carried out by the modified method of Alomira et al.[Citation9] Electrophoresis was run with a 5% stacking gel and a 12% separating gel. The concentration of the stacking gel, which included 0.5 mL 30% acrylamide (analytical reagent [AR]), 0.38 mL 1.0 mol/L Tris-HCl pH 6.8, 0.03 mL 10 % SDS (AR), 2.1 mL redistilled water, 0.03 mL 10 % ammonium (AR) and 0.003 mL N, N, N’, N’-tetramethylethylenediamine (TEMED, AR) was 5%. The concentration of the separating gel, consisting of 4.0 mL 30% acrylamide (AR), 2.5 mL 1.5 mol/L Tris-HCl pH 8.8, 0.1 mL 10% SDS, 3.3 mL redistilled water, 0.1 mL 10% ammonium peroxydisulfate, and 0.004 mL TEMED, was 12%. The constant voltage was 80 V for the stacking gel and 120 V for the separation gel. Full-molecular weight proteins from 10 to 170 kDa were used as a reference marker.
Anion-exchange chromatography
Anion-exchange chromatography was performed according to the modified method of Hattori et al.[Citation19] and using the ÄKTA protein purifier system (GE Healthcare, Uppsala, Sweden). The isolated protein was redissolved using 0.05 mol/L Tris-HCl at pH 8.5[Citation20] to a final volume of 5 mL with this solution. Then, the protein solution was filtered by a 0.45 μm filter membrane, and an ion-exchange column equipped with diethylaminoethyl (DEAE)-Sepharose Fast Flow (GE Healthcare, Shanghai, China) was equilibrated for 2 h with 0.05 mol/L Tris-HCl at pH 8.5 at 1 mL/min. Five milliliters of each sample was separated by ion-exchange chromatography. The unadsorbed protein was eluted with 0.05 mol/L Tris-HCl at pH 6.5, and the adsorbed protein was subjected to linear elution by elution solution (0.5 mol/L NaCl and 0.05 mol/L Tris-HC at pH 6.5). The rate of elution was 3 mL/min. Then, each elution peak was collected and analyzed by SDS-PAGE (DYY-III, Beijing Liuyi Instrument Factory, China).
Determination of total protein concentration
The total protein concentration was measured according to the bicinchoninic acid (BCA) Protein Assay Kit instructions (Beyotime, Shanghai, China). Briefly, a protein standard with a final concentration of 0.5 mg/mL was prepared and added to 96-well plates at volumes of 0, 1, 2, 4, 8, 12, 16, and 20 μL. The total volume was made up to 20 μL with 0.01 mol/L phosphate buffer solution (PBS, pH 7.4). Samples diluted with PBS (10 µL) were added to 96-well plates and made up to 20 μL with PBS. BCA working liquid (200 µL) was added to all wells, the mixture was incubated at 37°C for 30 min, and the absorbance was measured at 562 nm by a Model 680 microplate reader (BIO-RAD, Tokyo, Japan). According to the standard curve, the protein concentration of the sample was calculated.
Reversed-phase high performance liquid chromatography (RP-HPLC)
The Agilent 1100 RP-HPLC (Agilent, CA, USA) method is described in the modification of Kong et al.[Citation21] A Kromasil C18 column ([4.6 mm × 250 mm, 5 μm], Sigma-Aldrich, Shanghai, China) was used with a flow rate of 1 mL/min. The detection wavelength was 215 nm. The column temperature was 30°C. The injection volume was 10 μL. Chromatographic conditions were as follows: Mobile phase A was made up of 0.1% trifluoroacetic acid-water solution, and mobile phase B was made up of 0.1% trifluoroacetic acid-acetonitrile solution. Mobile phase B was increased from 20 to 50% by gradient in the first 10 min, then was increased from 50 to 80% by gradient in the second 10 min and was decreased from 80 to 20% by gradient in the final 2 min. The standard curve was generated using the external standard method.
The RP-HPLC method was validated for linearity, recovery, precision, limit of detection (LOD) and limit of quantification (LOQ) according to the US FDA Guidance for Industry on Bioanalytical Method Validation.[Citation22] The external standard (α-LA, LOT 1013909; β-LG, LOT MSRT2, Sigma, China) method was used for protein identification. To investigate the linear range, seven different concentrations were used for α-LA (0.01–1.00 mg/mL) and β-LG (0.025–2.00 mg/mL). The peak area of protein was used to establish linear regression. Protein concentrations were calculated according to the linear regression result. LOD and LOQ were defined as the lowest concentrations with signal-to-noise ratios of 1/3 and 1/10, respectively.
For recovery, five concentrations of both proteins were studied. We obtained the method of recovery and calculated its precision according to the results. The relative standard deviation (RDS) was calculated according to the results of three repeated experiments.
ELISA inhibition assay
Preparation of the anti-sera and ELISA inhibition assay are described by Neyestani et al.[Citation23] Young male rabbits (2.5 months) were used in this study and injected intra-muscularly with a standard solution of either α-LA or β-LG. Wells of a microplate were coated with the standard solutions of α-LA and β-LG. Properly diluted anti-sera were then incubated with various concentrations of the purified proteins at a final volume of 200 μL for 1 h at room temperature. The tubes were then centrifuged at 4000 × g at room temperature for 15 min, and 100 μL of the supernatant was then transferred to the appropriate well. The absorbance was plotted against B0/Bx, where B0 was the binding of mouse serum to the antigen coated in the microwell (zero standard) and Bx was the binding of mouse serum pre-incubated with the purified antigen. The absorbance at 490 nm was measured by Bio-Rad iMark ELISA (Bio-Rad, CA, USA). Cross-reactivity was then calculated using the following equation: CSt50/CP50 × 100, where CSt50 and CP50 are the concentrations of the standard and the purified protein, respectively, at which 50% inhibition had occurred.
Results and discussion
Whey protein precipitation using ammonium sulfate
Under normal conditions, the isolation of casein and whey protein in fresh milk is performed by the isoelectric point precipitation method. Casein has the lowest solubility and is precipitated at pH 4.5, and then, whey protein is obtained.[Citation24] The ammonium sulfate precipitation method was used in this study, and when the whey protein was purified, part of the hybrid protein was removed.
shows the results of SDS-PAGE of supernatant solution that was isolated from whey protein using 10–90% ammonium sulfate. The target proteins (β-LG and α-LA) could reach higher concentrations from 10 to 50% ammonium sulfate precipitation, and this is in agreement with a report from Gjesing and Lowenstein.[Citation25] However, the hybrid protein content was higher from 10 to 40% than at 50% ammonium sulfate. The order of proteins from top to bottom in is immunoglobulin heavy chain, BSA, casein, β-LG, and α-LA. There were no bands of casein protein in 50% ammonium sulfate. Although there was only one hybrid BSA protein in 60% ammonium sulfate, the low content of α-LA and β-LG was not suitable for further separation and purification. Protein bands could not be observed from 70 to 90% ammonium sulfate.
Figure 1. SDS-PAGE analysis of whey protein supernatant and whey protein precipitate using 10–90% ammonium sulfate 1: Marker (10–170 kDa); 2–9: Supernatant of whey protein and whey protein precipitate using 10–90% ammonium sulfate. (a) Supernatant of whey protein (b) Precipitated whey protein.
shows the SDS-PAGE results of precipitate that was isolated from whey protein by 10–90% ammonium sulfate. Low protein content was observed with ammonium sulfate precipitation from 10 to 50%. The protein content increased with ammonium sulfate from 60 to 90%, but many hybrid proteins were mixed with the target proteins. The yield was very low from 60 to 90% ammonium sulfate during the precipitation process. On the other hand, ammonium sulfate is a neutral salt. The high salt concentration may result in the degeneration of proteins and increased density that inhibits protein precipitation for collection. Based on the above results, 50% ammonium sulfate was selected and used to precipitate whey protein, and then the supernatant fraction was separated and purified by anion exchange chromatography.
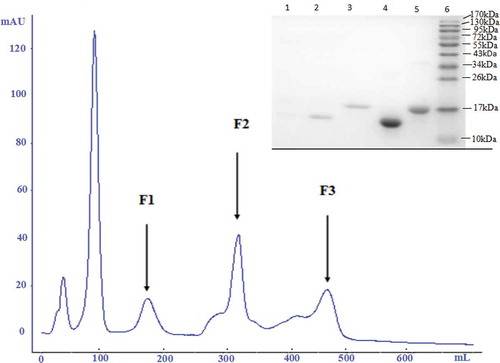
Separation of whey proteins using anion exchange chromatography
In this study, anion exchange chromatography with DEAE-Sepharose Fast Flow was used to separate and purify whey protein, and 0.05 mol/L Tris-HCl buffer at pH 8.5 was used as a buffer system. The pH of the buffer system was higher than the isoelectric point of the target protein (α-LA, PI 4.8; β-LG, PI 5.3). In this system, the proteins carried a negative charge, which is suitable for operation using anion exchange chromatography. According to the results of a previous study (data not shown), 0–0.5 mol/L NaCl was adopted for linear elution. The first peaks were unbound proteins, and F1, F2, and F3 were collected and analysed (). The three absorption peaks were analyzed by SDS-PAGE, and there was a small amount of α-LA and β-LG in F1. It might be possibly to the lower salt concentration that only a small amount of incompletely bound proteins were eluted first. There was only one protein band in F2 and F3. F2 was for α-LA, and F3 was for β-LG. El-Sayed et al.[Citation26] also found a method for the separation and purification of α-LA and β-LG. However, they obtained β-LG purity of 95% by cation exchange chromatography, and the purity of α-LA was very low, about 54 %. These results were inadequate for further analysis of antigenicity. Therefore, the method and parameters were suitable for the separation of α-LA and β-LG from whey protein in this study.
Figure 2. Chromatogram of whey protein separation using anion exchange chromatography and SDS-PAGE analysis of the peaks collected during anion exchange chromatography 1: F1; 2: F2; 3: F3; 4: α-LA standard; 5: β-LG standard; 6: Marker (10–170 kDa).
Total protein concentration
To determine the purity of α-LA and β-LG obtained by anion exchange chromatography, the total protein concentration of the five proteins was measured. The BCA protein assay kit was used in this study. The standard curve showed that its regression equation was y = 1.3273x + 0.1717, R2 = 0.9982. According to the equation, the average total protein concentration of α-LA was 0.033 mg/mL and β-LG was 0.059 mg/mL.
RP-HPLC chromatogram of samples
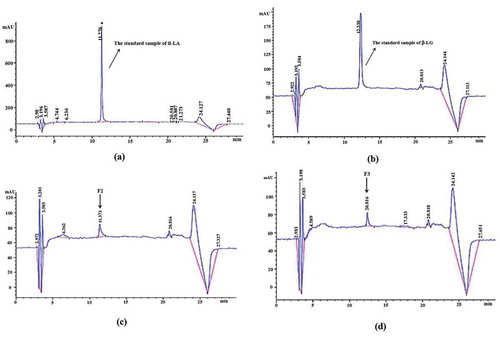
α-LA is a monomer globulin composed of 123 amino acid residues, and its relative molecular mass is approximately 14.2 kDa, the smallest among whey proteins. β-LG is composed of 162 amino acid residues that are tightly folded into a globular structure.[Citation27] Its relative molecular mass is approximately 18.3 kDa. The secondary structure of β-LG includes a hydrophobic center consisting of eight antiparallel beta-folds.[Citation28,Citation29] This study chose a C18 reverse phase column (4.6 mml.D. × 250 mm, 5 μm) to measure the purity of α-LA and β-LG separated by anion-exchange chromatography according to their structures.
The results of protein analysis by RP-HPLC are shown in . shows that the retention times of α-LA and β-LG standards were 11.276 and 12.338 min, respectively. In , the peak time of F2 (α-LA) was 11.373 min, which was consistent with the α-LA standard. The peak time of F3 (β-LG) was 12.434 min, which was consistent with the β-LG standard. Neyestani et al.[Citation23] used HPLC to report three chromatographic peaks (α-LA, β-LG-B, β-LG-A) of whey proteins, but the retention times for the proteins were too long. According to the regression equation curves of the α-LA and β-LG standards in as derived from the peak areas of F2 (α-LA) and F3 (β-LG), the content of α-LA and β-LG was 0.028 and 0.056 mg/mL, respectively, in the samples. In the determination of total protein content, the content of total protein in F2 was 0.033 mg/mL; therefore, the purity of the separated α-LA was 84.85 ± 0.22%. The content of total protein in F2 was 0.059 mg/mL; therefore, the purity of the separated β-LG was 94.91 ± 0.27%. When the anion exchange chromatography was repeated with 250 mL of whey, the protein yield obtained was 330 ± 8 mg for α-LA and 598 ± 11 mg for β-LG. References have reported similar results for the yield of β-LG[Citation17] and for the yield of α-LA.[Citation20]
Table 1. Linear equation and coefficient correlation of two standard samples.
Figure 3. RP-HPLC Chromatogram of α-lactalbumin and β-lactoglobulin (a) Chromatographic pattern for an α-LA standard (b) Chromatographic pattern for a β-LG standard (c) Chromatographic pattern for α-lactalbumin (F2) from isolating the protein is shown in (d) Chromatographic pattern for β-lactoglobulin (F3) from isolating the protein is shown in .
The method was determined to be linear for α-LA between 0.01 and 1.00 mg/mL and for β-LG between 0.025 and 2.00 mg/mL. According to the peak area of protein (Y) and the concentration of protein (X, mg/mL), we found the following linear regression (). According to the US FDA Guidance for Industry on Bioanalytical Method Validation,[Citation22] the LOD and the LOQ of the method were 0.01 and 0.51 mg/mL, respectively. Based on these results, we believe that the established method has higher sensitivity.
To test the accuracy of the RP-HPLC method, α-LA (0.01–1.00 mg/mL) and β-LG (0.025–2.00 mg/mL) were analyzed. The results show that the recovery was significantly different and ranged from 83.1 to 110.2% for α-LA and from 89.5 to 112.9% for β-LG. The RSD of both proteins was lower than 3% in our assay.
Indirect competitive ELISA assays for antigenicity
In this study, the indirect competitive ELISA method was adopted to analyze the antigenicity of the purified samples of α-LA and β-LG. According to the optimal concentration of coating antigen, the standard and the purified samples of α-LA and β-LG were diluted into a series of concentrations (0.1–10,000 and 0.1–5000 ng/mL, respectively) for determination by indirect competitive ELISA. The results in show that the curves were a significant inverse S-type. The antigenicity of the standards and the purified samples of α-LA and β-LG was almost unanimous. The curves of the α-LA and β-LG standards show a significant linear relationship within 0.5–500 and 1–1000 ng/mL, whereas the purified samples are in the linear range of 1–500 ng/mL for α-LA and 5–500 ng/mL for β-LG.
Figure 4. Indirect competitive ELISA assays for the antigenicity of α-lactalbumin and β-lactoglobulin (a) α-LA (b) β-LG.
lists the four standard linear regression equations. IC50 values were calculated for the standards and the purified samples from the regression equation. The cross-reactivity of α-LA and β-LG was 93.2 and 95.4%, respectively. The purified samples and antibodies obtained from standard immunization could be combined well, implying that α-LA and β-LG obtained by this experimental method retained a great degree of antigenicity.
Table 2. Linear equation and coefficient correlation of indirect competitive ELISA.
Conclusions
Milk is a highly nutritional food, and the separation of major allergens from milk has become an important process for people who are allergic. A method combining ammonium sulfate with anion exchange chromatography was established and adopted to separate and purify α-LA and β-LG from fresh milk. The purity of α-LA and β-LG was higher than in other reports. The antigenicity of purified α-LA and β-LG was maintained and was similar to α-LA and β-LG standards. This method has good repeatability, low cost, and simple operation.
Funding
This study was supported by the National Natural Science Foundation of China (Grant No. 31301519) and the Natural Science Foundation of Heilongjiang Province of China (C201134) and Heilongjiang Postdoctoral Grant (LBH-Q13029).
References
- Medeiros, V.; Rainha, N.; Paiva, L.; Lima, E.; Baptista, J. Bovine Milk Formula Based on Partial Hydrolysis of Caseins by Bromelain Enzyme: Better Digestibility and Angiotensin-Converting Enzyme-Inhibitory Properties. International Journal of Food Properties 2014, 17, 806–817.
- Raies ul Haq, M.; Kapila, R.; Shandilya, U.K.; Kapila, S. Impact of Milk Derived β-Casomorphins on Physiological Functions and Trends in Research: A Review. International Journal of Food Properties 2014, 17, 1726–1741.
- Pourpak, Z.; Mostafaie, A.; Hasan, Z.; Kardar, G.A.; Mahmoudi, M. A Laboratory Method for Purification of Major Cow’s Milk Allergens. Journal of Immunoassay and Immunochemistry 2004, 25, 385–397.
- Kaul, S.; Luttkopf, D.; Kastner, B.; Vogel, L.; Holtz, G.; Vieths, S.; Hoffmann, A. Mediator Release Assays Based on Human or Marine Immunoglobulin E in Allergen Standardization. Clinical and Experimental Allergy 2007, 37, 141–150.
- Chen, F.M.; Lee, J.H.; Yang, Y.H.; Lin, Y.T.; Wang, L.C.; Yu, H.H.; Chiang, B.L. Analysis of α-Lactalbumin-, β-Lactoglobulin-, and Casein-Specific IgE Among Children with Atopic Diseases in a Tertiary Medical in Northern Taiwan. Journal of Microbiology, Immunology and Infection 2014, 47, 130–136.
- Pessato, T.B.; de Carvalho, N.C.; Tavano, O.L.; Fernandes, L.G.R.; Zollner, R.de L.; Netto, F.M. Whey Protein Isolate Hydrolysates Obtained with Free and Immobilized Alcalase: Characterization and Detection of Residual Allergens. Food Research International 2016, 83, 112–120.
- Exl, B.M.; Frische, R. Cow’s Milk Protein Allergy and Possible Means for Its Prevention. Nutrition 2001, 17, 642–651.
- Stanley, J.S.; Bannon, G.A. Biochemistry of Food Allergens. Clinical Reviews in Allergy & Immunology 1999, 17, 279–291.
- Alomira, H.F.; Alli, I. Separation and Characterization of β-Lactoglobulin and α-Lactalbumin from Whey and Whey Protein Preparations. International Dairy Journal 2004, 14, 411–419.
- Lozno, J.M.; Giraldo, G.I.; Romero, C.M. An Improved Method for Isolation of β-Lactoglobulin. International Dairy Journal 2008, 18, 55–63.
- Bobe, G.; Beitz, D.C.; Freeman, A.E.; Lindberg, G.L. Separation and Quantification of Bovine Milk Proteins by Reversed-Phase High Performance Liquid Chromatography. Journal of Agricultural and Food Chemistry 1998, 46, 458–463.
- Bordin, G.; Rappsos, F.C.; Calle, B.; Rodriguez, A.R. Identification and Quantification of Major Bovine Milk Proteins by Liquid Chromatography. Journal of Chromatography A 2001, 928, 63–76.
- Johann, P.; Philip, R.A.; Ingolf, K.; Winter, C. Gram Scale Separation of Casein Proteins from Whole Casein on a Source 30Q Anion-Exchange Resin Column Utilizing Fast Protein Liquid Chromatography (FPLC). Protein Expression and Purification 2008, 60, 176–181.
- Sannier, F.; Boraenave, S.; Piot, J.M. Purification of Goat β-Lactalbumin from Whey by an Ultrafiltration Membrane Enzymic Reactor. Journal of Dairy Research 2000, 67, 43–51.
- Arunkumar, A.; Etzel, M.R. Fractionation of α-Lactalbumin and β-Lactoglobulin from Bovine Milk Serum Using Staged, Positively Charged, Tangential Flow Ultrafiltration Membranes. Journal of Membrane Science 2014, 454, 488–495.
- Lozano, J.M.; Giraldo, G.; Romero, C.M. An Improved Method for Isolation of β-Lactoglobulin. International Dairy Journal 2008, 18, 55–63.
- Stojadinovic, M.; Burazer, L.; Ercili-Cura, D.; Sancho, A.; Buchert, J.; Velickovica, T.C.; Stanic-Vucinica, D. One-Step Method for Isolation and Purification of Native β-Lactoglobulin from Bovine Whey. Journal of Science Food Agriculture 2012, 92, 1432–1440.
- Estévez, N.; Fuciños, P.; Bargiela, V.; Pastrana, L.; Tovar, C.A.; Luisa Rúa, M. Structural and Thermo-Rheological Analysis of Solutions and Gels of a β-Lactoglobulin Fraction Isolated from Bovine Whey. Food Chemistry 2016, 198, 45–53.
- Hattori, M.; Miyakawa, S.; Ohama, Y.; Kawamura, H.; Yoshida, T.; To-o, K.; Kuriki, T.; Takahashi, K. Reduced Immunogenicity of β-Lactoglobulin by Conjugation with Acidic Oligosaccharides. Journal of Agricultural and Food Chemistry 2004, 52, 4546–4553.
- Ye, X.Y.; Yoshida, S.; Ng, T.B. Isolation of Lactoperoxidase, Lactoferrin, α-Lactalbumin, β-Lactoglobulin B and β-Lactoglobulin A from Bovine Rennet Whey Using Ion Exchange Chromatography. The International Journal of Biochemistry & Cell Biology 2000, 32, 1143–1150.
- Kong, X.Y.; Wang, J.; Tang, Y.J.; Li, D.D.; Zhang, N.N.; Jiang, J.D.; Liu, N. HPLC Analysis of α-Lactalbumin and β-Lactoglobulin in Bovine Milk with C4 and C18 Column. Journal of Northeast Agricultural University 2012, 19, 76–82.
- U.S. Department of Health and Human Services Food and Drug Administration CfDEaRC, for Veterinary Medicine (CVM) Guidance for Industry Bioanalytical Method Validation. US Food and Drug Administration Center for Drug Evaluation and Research. http://www.fda.gov/downloads/Drugs/GuidanceComplianceRegulatoryInformation/Guidances/ucm070107 (accessed 2015).
- Neyestani, T.R.; Djalali, M.; Pezehski, M. Isolation of α-Lactalbumin, β-Lactoglobulin and Bovine Serum Albumin from Cow’s Milk Using Gel Filtration and Anion-Exchange Chromatography Including Evaluation of Their Antigenicity. Protein Expression and Purification 2003, 29, 202–208.
- Hochwallner, H.; Schulmeister, U.; Swoboda, I.; Spitzauer, S.; Valenta, R. Cow’s Milk Allergy: From Allergens to New Forms of Diagnosis, Therapy and Prevention. Methods 2014, 66, 22–33.
- Gjesing, B.; Lowenstein, H. Immunochemistry of Food Antigens. Annals of Allergy 1984, 53, 602–608.
- El-Sayedmm, H.; Chase, H.A. Purification of the Two Major Proteins from Whey Concentrate Using a Cation-Exchange Selective Adsorption Process. Biotechnology Progress 2010, 26, 192–199.
- Sharma, R.; Zakora, M.; Qvist, K.B. Susceptibility of an Industrial α-Lactalbumin Concentrate to Cross-Linking by Microbial Transglutaminase. International Dairy Journal 2002, 12, 1005–1012.
- Knudsen, J.C.; Otte, J.; Olsen, K.; Skibsted, L.H. Effect of High Hydrostatic Pressure on the Conformation of β-Lactoglobulin A as Assessed by Proteolytic Peptide Profiling. International Dairy Journal 2002, 12, 791–803.
- Cheison, S.C.; Lai, M.Y.; Leeb, E.; Kulozik, U. Hydrolysis of β-Lactoglobulin by Trypsin Under Acidic pH and Analysis of the Hydrolysates with MALDI-TOF-MS/MS. Food Chemistry 2011, 125, 1241–1248.