
ABSTRACT
Nutritional composition, rheological behavior, and structure of a commercial Spanish hummus were analyzed. The hummus is “high in fiber,” and Fe (1.9 ± 0.02 mg/100 g), Ca (65.7 ± 10.9 mg/100 g), Mg (66.8 ± 1.0 mg/100 g), P (164.9 ± 4.6 mg/100 g), and especially, K (250.7 ± 11.6 mg/100 g) are present in it. The hummus, with dispersion index of 4.14, behaved like a weak gel and exhibited hysteresis loops, and the Herschel-Bulkley model described its steady time-independent flow behavior. Complex viscosity and apparent viscosity at similar frequency and shear rate failed to follow the Cox-Merz rule.
Introduction
The word pulse is derived from the Latin word puls, meaning thick slurry.[Citation1] The United Nations declared that 2016 will be the International Year of Pulses (IYP 2016). The hope is that IYP 2016 will position pulses as a primary source of protein and other essential nutrients, leading to dietary uptake. Among pulses, chickpea (Cicer arietinum L.) and lentil (Lens culinaris L.) are the ones most commonly consumed in many countries because of their ideal cell wall polysaccharide composition and starch properties.[Citation2] As a result of its potential nutritional value, chickpea is gaining consumer acceptance as a functional food.[Citation3] Chickpea seeds are a rich source of plant protein,[Citation3–Citation5] dietary fiber,[Citation3,Citation4] resistant starch,[Citation2] polyunsaturated fatty acids (PUFAs),[Citation4] vitamins, and minerals,[Citation3–Citation5] and various bioactive compounds (phytates, phenolic compounds, oligosaccharides, enzyme inhibitors, etc.) that could aid in potentially reducing the risk of chronic diseases.
Increasingly popular in the United States is hummus, a dip/spread that is made with pureed chickpeas and other healthful ingredients, including tahini, olive oil, lemon juice, and garlic.[Citation5] Commercially available hummus also provides dietary fiber, folate, Ca, Mg, P, K, and unsaturated oils.[Citation4] Cabrera et al.[Citation6] evaluated the contribution of pulses to total dietary intake of Cu, Cr, Fe, Zn, Al, Ni, Pb, and Cd. They stated that the growing popularity and consumption of pulses due to their nutritional properties and beneficial effects make it necessary to obtain knowledge and control of their mineral content.
Rheological measurements are important in the food industry as a tool for physical characterization of raw material prior to processing, of intermediate products during manufacturing, and of finished foods.[Citation7] The rheological behavior of a food depends on its chemical components, molecular structures, intra- and intermolecular interaction, and dispersion.[Citation8] The rheology of complex food products plays an important role not only in quality control, in many cases determining consumer acceptance, but also in the design of unit operations such as pumping, mixing, stirring, evaporation, heat exchange, etc.[Citation9] From an engineering standpoint, the steady flow curve is the way most commonly used to characterize the rheological behavior of fluids.[Citation10] Viscoelastic properties are very useful in the design and prediction of product stability,[Citation11] and they are very sensitive to chemical composition and interactions among components. In gels formed from protein–polysaccharide mixtures, rheological properties are dependent on thermodynamic and structural compatibility between the two macromolecules.[Citation7] Consequently, a complete rheological characterization of hummus formulations entails viscoelastic and viscosity measurements.[Citation9,Citation12]
The composition of industrial hummus is continually being modified and adapted with the purpose of producing a healthier and tastier product. However, despite the worldwide popularity of this product, there are no rheological studies of either industrial or artisanal hummus. In contrast, extensive research has been conducted on the rheological properties of sesame tahini,[Citation13–Citation15] which is the major constituent of hummus. Therefore, the main aim of this work was to understand the behavior and structure of a commercially available Spanish hummus by studying its rheological properties (small-amplitude oscillatory shear [SAOS] and steady-state flow measurements). A second objective was to evaluate to what extent the rheological properties of this system are related to microstructural features and particle size. Mineral content, not previously available, was also determined to supplement the nutritional data currently supplied by the manufacturer.
Materials and methods
Commercial Spanish hummus samples
Three batches of plain hummus made in Spain, presented in 150 g retail plastic containers, were purchased from a local market. Each container contained hummus accompanied by toasted bread. Each batch consisted of 20 containers, which were randomly purchased to obtain a more accurate representation of the product. In accordance with the instructions on the label, the containers were stored in a refrigerator at 4°C. Before all measurements, each container was tempered at room temperature for 60 min, and was discarded within 6 h after opening. The hummus ingredients, as specified by the manufacturer (YGriega, Rensika S.L.U., Barcelona, Spain), were as follows: chickpea seeds, 57%, sunflower oil, sesame paste, lemon juice, 2%, olive oil, 2%, minced garlic, salt, citric acid (E-330), lactic acid (E-270, vegetable source), potassium sorbate (E-202), and sodium benzoate (E-211). Mean values for proximate nutritional composition of the hummus (g/100 g) are shown in .
Table 1. Nutritional information of hummus recipe*.
Nutritional composition of hummus
Instrumentation
All the measurements were performed using an Analytikjena ContrAA 700 high-resolution atomic absorption spectrometer (Analytik Jena AG, Jena, Germany) equipped with a Xenon short-arc lamp (GLE, Berlin, Germany) operating in a “hot spot” mode as the radiation source. An air-acetylene flame was used for determination of Mg, Na, K, Zn, Fe, Cu, and Mn, and a fuel-rich nitrous oxide-acetylene flame was used for Ca. Finally, P was determined with the graphite furnace compartment, employing a transversely heated graphite tube with platform. For all elements, calibration was performed using aqueous standards, and measurements were carried out at the main atomic lines for Ca (422.7 nm), Mg (285.2 nm), Na (589.0 nm), K (766.5 nm), Zn (213.9 nm), Cu (324.8 nm), Fe (248.3 nm), and Mn (279.5 nm), and the non-resonance line for P (213.6 nm).
Standards and reagents
Calibrations standards of each element were prepared daily from commercially available 1000 mg L–1 single-element stock solutions (Panreac Química, S.A., Barcelona, Spain). Deionized water was obtained from a Milli-Q Integral 5 system (Millipore, Billerica, USA). Inorganic acid and reagents of analytical grade purity or higher were used (HNO3 65%, H2O2; Panreac Química, S.A., Barcelona, Spain).
Sample digestion
The samples were digested in a Milestone Ethos 1 Microwave Digestion Labstation (Milestone, Shelton, CT, USA) with HNO3 and H2O2 (PA, Panreac Química, S.A., Barcelona, Spain) in closed Teflon (TFM) vessels. Once the samples had been digested they were diluted with ultrapure deionized water (18.2 MW-cm resistivity at 25°C).
Protein and total soluble solids (TSS) contents
The TSS content [g/100 g (w/w)] as measured by refractive index was determined with an Atago (Itabashi, Tokyo, Japan) dbx-30 refractometer. Nitrogen was estimated by the Dumas method,[Citation2] using a Leco TruMac Nitrogen Determinator (Leco Corporation, St Joseph, MI, USA). The results were expressed as g total nitrogen per 100 g of sample (percentage).
Physicochemical properties
The color of the hummus in pots was measured with a Hunter-Lab model D25 (Reston, VA) color difference meter fitted with a 5 cm diameter aperture. Results were expressed in accordance with the CIELAB system with reference to illuminant D65 and a visual angle of 10°. The parameters measured were L* (L* = 0 [black], L* = 100 [white]), a* (+a* = red), and b* (+b* = yellow).
The pH of the hummus was determined with a Schott CG pH meter (Model 149 842; Schott-Geräte GmbH, Mainz, Germany). Water activity was measured with a LabMaster-aw (Novasina AG CH-8853, Lachen, Switzerland). Water holding capacity (WHC; %) was determined by centrifugation at 10,000 rpm for 35 min at 5°C in a Sorvall RC-728311 centrifuge (GMI, Inc., Ramsey, MN, USA). In all cases, results are means of nine replicates from three batches of the hummus ± standard deviation (SD).
Rheological measurements
SAOS and three-step shear rate tests were performed using a Kinexus pro rotational rheometer (Malvern Instruments Ltd, Worcestershire, UK), whereas the rest of steady shear tests (flow curves) were conducted in a Bohlin CVR 50 controlled stress rheometer (Bohlin Instruments Ltd., Cirencester, UK). Measurements were obtained using parallel-plate geometry (40 mm diameter and 1 mm gap) and a thin film of Vaseline oil (PRS-Codex) to avoid evaporation. Samples were allowed to rest for 15 min before analysis to ensure both thermal and mechanical equilibrium at the time of measurement. Temperature was controlled to within 0.1°C by Peltier elements in the lower plates, kept at 25°C except when non-isothermal heating processes were carried out. Four replicates of each test were run with samples purchased on three different days. Results are means of 12 replicates from three independent batches of the hummus ± SD.
SAOS tests
To determine the linear viscoelastic (LVE) region, stress sweep tests were run at 1 Hz with the shear stress (σ) of the input signal varying from 0.01 to 100 Pa. Changes in storage modulus (G’, Pa), loss modulus (G”, Pa), complex modulus (G*, Pa), and loss tangent (tan δ = G”/G’, dimensionless) were recorded. Critical (maximum) values of shear strain (γmax), shear stress (σmax), G*max, and tan δ were used to limit the LVE range according to Campo-Deaño and Tovar.[Citation16] Then frequency sweep tests were run, subjecting the samples to stress that varied harmonically with time at variable frequencies from 0.01 to 10 Hz. Shear strain (γ) was set at 0.01%, corresponding to σ at 0.63 Pa, within the LVE range. Temperature sweep tests were then performed from 25 to 100 °C at a linear heating rate (1.6°C min−1). Frequency, f, at 0.1 Hz and γ at 0.01% were fixed, within the LVE range.
The creep-recovery tests were conducted at different increasing instantaneous stresses (σ0) over the range of 0.63 to 7.95 Pa to validate the range of shear stress providing LVE behavior. Within the LVE range, compliance data at different applied stresses should coincide.[Citation17] The lowest applied σ0 (0.63 Pa) was chosen within the LVE range as determined from stress sweeps (corresponding to 0.01% shear strain). All the σ0 values were applied for 600 s in the creep tests, and the resulting change in strain over time γ(t) was monitored. When the stress was released, recovery was also registered for 600 s. Creep and recovery results were described in terms of the shear compliance function J(t) = γ(t)/σ0.
Steady shear tests
To study flow time dependence, the hysteresis loop was obtained by recording shear stress at shear rates increasing from 0.1 to 100 s–1 in 5 min and decreasing from 0.1 to 100 s–1 in 5 min. The Bohlin CVO 120 software (v. 06.40) was used to obtain the hysteresis area (Aup – Adown) from the areas under the upstream data points (Aup) and under the downstream data points (Adown). Before analyzing flow behavior, the structure responsible for thixotropy should previously be destroyed by shearing.[Citation18] Therefore, after analyzing the existence of hysteresis cycles in the samples, a previous shearing of 5 min at 300 s−1 was applied to obtain a reduced hysteresis area. After pre-shearing and reducing the flow time dependence, sample flow was again measured by controlling the shear rate and recording the shear stress values at shear rates increasing from 0.1 to 100 s−1 in 5 min and decreasing from 0.1 to 100 s−1 in 5 min.
Three-step shear rate tests were carried out for viscometry rebuild analysis. For this purpose, the samples were subjected to a shear rate of 0.1 s−1 for 30 s in the first stage. Then, in the second stage, a shear rate of 100 s−1 was applied for 30 s in order to imitate the structural breakdown of the sample. In the third stage, the shear rate was again dropped to 0.1 s−1 and the viscosity recovery was monitored for 600 s. To compare thixotropic behavior between samples, the time taken in the third stage to achieve rebuild of the viscosity to 90% of the original value and the percentage of viscosity recovery at the end of the test were considered as relative measures of thixotropy.
Scanning electron microscopy (SEM)
The hummus microstructure was examined using a Jeol JSM-6500F (Jeol Ltd, Tokyo, Japan) field emission SEM with a resolution varying from 1.5 nm (15 keV) to 5.0 nm (1 keV). Samples were air-dried, then mounted and sputter-coated with Au (200 Ȧ approx.) in an SPI diode sputtering system metallizer.
Particle size distribution
Particle size and distribution of the hummus was determined immediately, after 10-fold dilution with water, with a Malvern Mastersizer S laser diffraction particle size analyzer (Malvern Instrument Ltd, Worcestershire, UK) equipped with a He-Ne laser (λ = 633 nm). The measurement range was 0.05–900 μm. Obscuration was in the range of 10–14%. Particle size calculations were based on the Mie scattering theory. The statistics of the distribution were calculated from the results using the derived diameters, D [m,n], according to Eq. (1):[Citation19]
According to this formula, D [Citation3,Citation2] represents the surface weighed mean, also known as the surface area moment mean or Sauter mean, while D [Citation4,Citation3] represents the volume weighed mean or mass moment mean diameter. Other parameters [d (0.1), d (0.5), d (0.9)] were also calculated in accordance with Benković et al.[Citation19] Measurements were done in triplicate from three batches of the hummus, and the results are expressed as mean (n = 9) ± SD.
Statistical analysis
A one-way ANOVA was performed to assess the effect of the shear stress applied on the rheological parameters derived from the creep and recovery tests. Fisher’s least significant difference (LSD) procedure was used to assess significant differences (P < 0.05) among samples that might allow discrimination between them. The SPSS® Statistics 19.0 computer program (SPSS Inc., Chicago, IL, USA) was employed for the statistical analysis.
Results and discussion
Nutritional composition
One of the reasons for the success of hummus is its image as a health food.[Citation20] The Spanish hummus analyzed provides high PUFA (12.6 g/100 g), dietary fiber (8.4 g/100 g), and protein (6.8 g/100 g) intakes for consumers (). In contrast, saturated fatty acids (SFAs) are low in this product (4.0 g/100 g). Nutrition claims are only permitted if they are listed in the Annex of Regulation (EC) No 1924/2006,[Citation21] most recently amended by Regulation (EU) No 1047/2012.[Citation22] The label of this product shows a permitted nutrition claim indicating that this commercial product has particular beneficial nutritional properties due to “high fiber.” A claim that a food is “high in fiber,” and any claim likely to have the same meaning for the consumer, may only be made where the product contains at least 6 g of fiber per 100 g or at least 3 g of fiber per 100 kcal.[Citation21]
Nutritional information provided by the manufacturer on the label was in agreement with data available in the literature. Chickpeas have 6.3 g dietary fiber/½ cup serving, and commercially available hummus has 1.7 g of dietary fiber/28 g serving.[Citation4] The association between chickpea/hummus consumption and nutrient intake, dietary quality, and health biomarkers was examined in adults using data from the National Health and Nutrition Examination Survey (NHANES) 2003–2010.[Citation5] Chickpea/hummus consumers had significantly (p < 0.01) higher daily intakes of dietary fiber, PUFAs, vitamins A, C, E, and K, thiamin, folate, Mg, K, Cu, and Fe than non-consumers. In addition, chickpea/hummus consumers had higher Healthy Eating Index-2005 scores. O’Neil et al.[Citation5] concluded that chickpea/hummus consumption should be encouraged, as part of an overall health diet, by health professionals, including registered dietitians. It is well known that in Israel hummus has become a culinary cult.[Citation20] In that country, commercial hummus is considered inferior to hand-made hummus owing to the high level of fat added to the product instead of more tahini.
On the other hand, as mentioned above, chickpea seeds also provide essential vitamins and minerals.[Citation3–Citation5] The determination of minerals and trace elements in foodstuffs is an important part of nutritional and toxicological analyses.[Citation6] According to the authors just cited, copper, iron, and zinc are essential micronutrients for human health. The hummus samples (100 g) provided Cu, Fe, and Zn, as well as various other minerals such as Ca, Mg, Na, K, Mn, and P. The amounts of these minerals found in the product were: Cu, 0.3 ± 0.01 mg/100 g; Fe, 1.9 ± 0.02 mg/100 g; Zn, 1.1 ± 0.04 mg/100 g; Ca, 65.7 ± 10.9 mg/100 g; Mg, 66.8 ± 1.0 mg/100 g; Na, 422.9 ± 34.9 mg/100 g; K, 250.7 ± 11.6 mg/100 g; Mn, 0.7 ± 0.01 mg/100 g; and P, 164.9 ± 4.6 mg/100 g. Therefore, 100 g of this hummus could meet the daily dietary total absolute requirements of Fe (1.05 mg/day in males and 1.46 mg/day in females from the age of 18 years).[Citation3]
In chickpea seeds, Cabrera et al.[Citation6] reported that mean concentrations of Cu, Fe, and Zn were 3.5, 68.8, and 39.2 µg/g of the edible portion, respectively. Thus, the Cu content present in the hummus was quite similar to that reported by those authors in chickpea seeds. Poltronieri et al.[Citation23] reported that concentrations of Fe and Zn in cooked chickpea were 5.1 ± 0.2 and 7.3 ± 0.3 mg/100 g, respectively. Concentrations in raw chickpea seeds reported by Jukanti et al.[Citation3] were: Fe, about 5.0 mg/100 g; Zn, 4.1 mg/100 g; Mg, 138 mg/100 g; and Ca, 160 mg/100 g. The amounts of Fe, Zn, Mg, and Ca present in the hummus were lower than in chickpea seeds. The amount of Na determined in the hummus was fairly similar to that specified by the manufacturer on the label, expressed in g/100 g (). However, this high content is associated with the incorporation of salt in the product. Much lower Na levels (ranging between 21.1 and 24 mg/100 g) have been found in chickpea seeds.[Citation3]
The authors just cited reported that concentrations of Mn, K, and P in chickpea seeds were 2.2, 875, and 366 mg/ 100 g, respectively. As expected, the amounts of these same minerals present in the hummus were lower than in chickpea seeds. However, the amounts of minerals found show that this commercial product is a promising source of many minerals such as Ca, Mg, K, P, Zn, and Fe.
Physicochemical properties
The L*, a*, and b* values of the hummus were 75.3 ± 0.12, 0.29 ± 0.04, and 14.3 ± 0.09, respectively. These values indicate that the hummus studied is a bright product (high L* value) with hue values on the red (+a*) and yellow (+b*) axes, respectively. The TSS content was 27.4 ± 2.5 [g/100 g (w/w)]. The hummus samples had a high water content (51 ± 0.2%), and showed an acidic character. Their pH value was 4.8, which could be explained by the presence of lemon juice in the recipe. The pH is a useful indicator for possible microbial contamination.[Citation24] The water activity was very high (0.989 ± 0.002), which could be ascribed to the high oil content of the samples. This parameter is also an important criterion for determining the stability of certain processed foods through the prevention or limitation of microbial growth. However, the hummus samples had a high ability to immobilize water, with a WHC of 95%, reflecting strong starch–water–protein interactions.
In this study, the total nitrogen content determined in the hummus was 1.04 ± 0.01 g/100 g, which could be mainly ascribed to the presence of both chickpea seeds and sesame paste in the product. Consequently, the hummus contained a mixture of different proteins. By using a nitrogen conversion factor of 6.25, the crude protein content determined was 6.5 ± 0.05 g/100 g, which is fairly similar to the protein content specified by the manufacture on the label (). A much higher protein content has been reported for sunflower and sesame tahini, ranging between 20 and 27%.[Citation13] On the other hand, diets with a rich Zn–protein ratio include great quantities of legumes, whole grains, and nuts.[Citation6]
Soaking, cooking, and autoclaving of legumes reduce the levels of starch, but to a lesser extent than levels of antinutrients (phenolic compounds, phytate, amylase inhibitor, etc.) and other soluble components.[Citation2] Thus, the improvement in starch digestibility after soaking and thermal treatments is due to gelatinization of starch granules and, probably, to the decreasing levels of antinutritional factors in the seeds. The authors just cited stated that partial removal of tannins and phytic acid probably created a large space within the matrix, which increased the susceptibility to enzymatic attack and consequently improved the digestibility of the protein and starch after thermal processing. Obviously, the chemical composition of the cooked legumes, as ingested, is far more important. In commercial hummus, microstructural modifications in the main components of the chickpea seeds after thermal processing (soaking and cooking) would determine the rheological behavior of the product.
SAOS tests
Stress sweeps
Within the LVE range, the viscoelastic moduli are independent of the applied stress as the stresses and strains are in proportion.[Citation13] This test is known to provide an excellent basis for comparing the viscoelastic nature of food products.[Citation16] In addition to establishing the LVE range, stress sweeps have been used to differentiate weak and strong gels.[Citation10] Critical σmax and γmax values, which can be taken as measurements of rheological stability,[Citation25,Citation26] were obtained by defining the range of tolerable deviation as 10%.[Citation16] The hummus showed σmax and γmax values of 12.6 ± 0.14 Pa and 0.249 ± 0.017%, respectively. Within the limits of the LVE range, the G*max and tan δ values were 5,083 ± 338 Pa and 0.224 ± 0.002, respectively. For industrial sunflower tahini, the LVE domain extended to around 0.16 Pa, corresponding to the measured strain amplitude of 0.37%.[Citation13] However, the authors just cited did not estimate the critical the G*max and tan δ values to limit the LVE range. By comparing the critical σmax and γmax values in both commercial hummus and tahini products, it is possible to appreciate that the hummus had higher resistance to applied stress and a greater degree of elasticity than commercial tahini (higher σmax value). In contrast, tahini was more flexible than the hummus (higher γmax value). This result could be ascribed to the fact that sunflower tahini has a much higher fat content than hummus (60.52% fat on a dry matter basis).[Citation13]
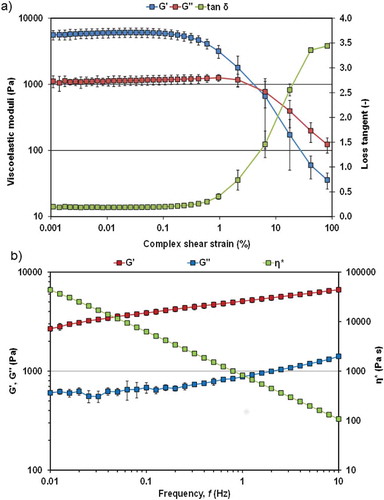
G’ and G” were also recorded during the stress sweeps, showing gel behavior with G’ > G” throughout the complete LVE range for the hummus (), indicative of the low contribution of the viscous component G” to the viscoelastic properties of the system.[Citation26] At σmax and γmax values the network structure breaks down, leading to a sharp decrease in the moduli. The effect of the flour-to-water ratio on the variation of shear stress (σ) with strain (γ), within the LVE range, of chickpea flour (CF) paste heat-induced at 75°C for 30 min was also studied by Alvarez et al.[Citation27] Samples containing a flour-to-water ratio of 1:2 had a significantly higher σmax value (373.8 ± 40.1 Pa) than the other CF pastes. At the lowest concentration (1:5), CF paste heat-induced at 75 °C behaved as LVE material when stresses were below σmax = 29.1 ± 3.1 Pa. In contrast, in surimi gels, the γmax values decreased at the higher starch concentrations, corroborating previous findings.[Citation28]
Figure 1. A: Amplitude sweep data at 1 Hz for commercially available Spanish hummus, showing the changes in elastic modulus (G′), viscous modulus (G″), and loss tangent (tan δ); B: Mechanical spectrum data from 0.01 to 10 Hz (strain amplitude at 0.01%). Mean values of 12 measurements ± standard deviation.
Frequency sweeps
Mechanical spectra provide essential information about gel structure and can be used, for example, to determine the behavior of cross-linked proteins which are fixed by chemical bonds, forming a three-dimensional network.[Citation10] The mechanical spectrum of the hummus at 25°C is illustrated in . G’ values were higher than G” in the entire frequency range studied, which might be explained by the existence of a weak network formed by particle aggregates.[Citation13] G’ is directly related to the cross-link density of the network in a gel.[Citation8] The same behavior was reported for borojó jam formulations,[Citation9] industrial sunflower tahini,[Citation13] mung bean starch treated by high hydrostatic pressure,[Citation8] and a chickpea gel developed with different formulations.[Citation29] Similarly, in the complete temperature range studied (5–80 °C), for commercial purees of selected vegetables with bass, vegetables and beef, and vegetables and chicken the values of G’ were higher than those of G” at all the frequency values tested.[Citation30]
For the hummus samples, the average value of the G’/G” ratio calculated for the complete f range was 5.6, but at the highest and lowest frequencies applied the G” contribution to the viscoelastic properties of the hummus increased (). Under small deformation, weak gels resemble strong gels in their mechanical behavior; however, as deformation increases, the three-dimensional networks undergo a progressive breakdown into smaller clusters.[Citation31] In this study, a power-law evolution (with an approximately constant slope in log-log plots) with frequency was found for G’, whereas a tendency to reach constant values at low frequencies, i.e., a plateau region, was detected for G”. According to Díaz-Ocampo et al.,[Citation9] neither these viscoelastic functions nor G* can be described in terms of power-law models. Despite this, in order to compare results, a power-law model (Eqs. [Citation2] and [Citation3]) was used to characterize the frequency dependence of both moduli, as previously proposed,[Citation12,Citation13,Citation30–Citation32] from the following equations:
where G’0 and G”0 are storage and loss moduli at 1 Hz, respectively, and n’ and n” (both dimensionless) denote the f dependence of the two moduli. According to Campo-Deaño and Tovar,[Citation28] the difference (G’0–G”0) can be used as a measure of gel strength. shows the values of the rheological properties at 1 Hz derived from the mechanical spectra together with the power-law fits of G’ and G” values corresponding to the hummus. As expected, a better fit (R2 = 0.994) was observed for the power-law function describing the relationship between elastic modulus and frequency, indicating that the behavior of G” (R2 = 0.895) was less linear than that of G’ (). The hummus samples showed more aggregate structures and stronger links than sunflower tahini.[Citation13] Slightly lower G’ and G” values were obtained in a chickpea gel developed with the same ingredients as the hummus but with a different appearance and texture.[Citation29] The δ value (10 ± 0.2°) at 1 Hz also indicates greater elasticity than viscosity in the hummus. For example, at 0.16 Hz and 35 °C, a δ of 30–54.2° and of 15.3 to 24° was observed for rice and chicken puree, and vegetable and chicken puree, respectively, supporting a more viscous nature.[Citation30] Therefore, the hummus was a stronger gel in its mechanical behavior than the baby foods just mentioned. As a consequence, tan δ was less than 1 (0.17 ± 0.003). The ratio of G” to G’ represented by the resulting loss tangent gives a relative measure of the energy lost versus energy stored in the cyclic deformation.[Citation30] In each food, the rheological behavior is directly related to its formulation; the conformational changes experienced during cooking by chickpea starch (gelatinization) and protein (coagulation and aggregation) were probably largely responsible for the predominantly elastic behavior of the hummus, although the influence of compounds such as fiber and related substances should also be taken into account.
Table 2. Oscillatory rheological properties and power law parameters derived from frequency sweep tests carried out at 1 Hz and strain amplitude of 0.01% in the LVE range.
The corresponding n’ and n” values were very similar (0.124 and 0.126, respectively), showing that the hummus exhibited the same proportional change in G’ and G” with f over the range studied (). The result of this is a typical weak gel-like behavior, as evidenced by the fact that the influence of frequency on both G’ and G” was rather low, whereas the difference between them was high. A good gel is known to exhibit the same proportional change in G’ and G” with frequency over a wide range; in other words, n’ and n” must be identical.[Citation28] From a structural standpoint, it is known that, for true gels, ln(f) versus ln(G’0) or ln(G”0) plots have zero slopes, while for weak gels and highly concentrated solutions the plots have positive slopes. The G’0 and G”0 values are related to the strength of the intermolecular interactions, and n’ and n” to the extent and stability of the gel.[Citation26] Herranz et al.[Citation32] observed a negative correlation of n’ with water-binding capacity, confirming that, when a network gel approximates to a true gel (low n’), the gel functionality is better and, therefore, water-binding capacity noticeably increases. Analogously, in this study, low both n’ and n” values are correlated with a high WHC in hummus, related to a good quality of the hummus gel. According to Chen et al.,[Citation33] a well-structured protein matrix with a large number of rheological units cross-linked by small filamentous threads produces a fine, uniform structure with numerous small pores, which would probably result in more absorptive capacity and better water retention. The gel strength (G’0–G”0) for the hummus was similar to that observed for gels of isolated hake myofibrils at the same temperature.[Citation34] Therefore, the hummus sample had a significant structural stability in its network on short time scales.[Citation32]
Temperature sweeps
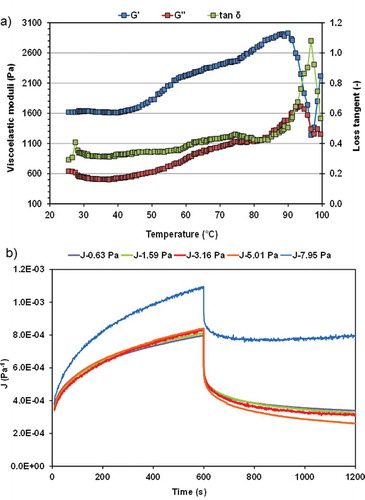
To ascertain the changes occurring in dynamic properties of the hummus samples during heating, the evolution of the viscoelastic properties was analyzed using temperature sweep tests from 25 to 100°C (). In this case, for the sake of clarity, only one replicate (n = 1) from a single batch is shown. For this hummus sample, G’ exhibited a plateau zone between nearly 25 and 40 °C, whereas the initial G″ values decreased slightly until 40 °C was reached. At 25 °C, the mean G’ and G″ values were 1429 ± 196 and 521 ± 118 Pa, respectively. A further increase in temperature resulted in a considerable increase in both moduli, with G’ and G″ peaks at about 90 °C, followed by decreases at the final heating temperature. At 90 °C, the mean G’ and G″ values were 2927 ± 200 and 1481 ± 130 Pa, respectively.
Figure 2. a) Typical temperature sweep test at 1 Hz showing the changes in elastic modulus (G′), viscous modulus (G″), and loss tangent (tan δ) for a single sample of commercially available Spanish hummus (strain amplitude at 0.01%) b) Creep and recovery compliance J(t) data with increasing applied shear stress. Mean values of 12 measurements.
According to the manufacturer, the hummus contained 57% of chickpea seeds. Starch is the most abundant carbohydrate (22–45%) in legume seeds,[Citation2] and also represents the major source of available carbohydrate in the human diet. Moreover, legumes are also a source of high-quality protein,[Citation1,Citation3–Citation5] containing approximately three times more protein (~18–25%) than cereals.[Citation2] The industrial manufacturing process used to make the hummus analyzed is unknown to us. However, raw chickpea seeds are intended to be cooked before production and consumption of hummus. Probably both chickpea starch gelatinization and protein denaturation phenomena occurred as a result of this treatment, and, as they are irreversible processes,[Citation30] these significant structural changes would not be expected to occur again during this additional heating. However, the degree of starch gelatinization and protein denaturation induced by the cooking of chickpea seeds would depend on both the temperature reached and the duration of the treatment. Using differential scanning calorimetry (DSC) analysis, both starch and protein peaks were distinguished clearly when a sample size of 4.5 mg of raw chickpea flour (~10% moisture) in 23 mg of water was used.[Citation35] Temperatures of starch peak gelatinization and protein denaturation were found to be in the ranges 75–90 and 100–120°C, respectively. Consequently, the G’ and G″ changes observed during subsequent heating of the hummus samples () would seem to indicate that the chickpea starch and protein had not been completely gelatinized or denatured, respectively, by the cooking prior to manufacture of the hummus. However, DSC analysis showed no peak (for starch gelatinization or protein denaturation) during thermal scanning of hummus samples. Meares et al.[Citation35] stated that, in chickpea flour, there is also a small amount of lipid in the flour, which can also interact with amylose in starch to give a reversible endothermic peak on heating.
Nevertheless, the changes observed in the rheological measurements of the hummus samples at and above 50 °C might also be associated with increased intermolecular interaction because of loss of solvent taking place in the tested samples at the higher temperatures under the test conditions used, with a consequent increase in the solid volume fraction of the gel.[Citation30] In addition, the structural changes during heating of other components present in the final hummus product, such as sunflower and olive oil, sesame paste, lemon juice, etc., would also influence its rheological behavior.
Creep and recovery tests
This transient test produces creep and recovery compliance data, J(t), over longer time scales than SAOS measurements.[Citation25] Therefore, these experiments can cause irreversible breakdown of short-range interactions, thus providing information about the relative long-range properties of physical systems.[Citation10] In the non-linear viscoelastic range the compliance curve differs significantly from the LVE range. shows the mean creep–recovery curves of the hummus samples (n = 12) with increasing applied shear stress over the range of 0.63 to 7.95 Pa; error bars are not shown in for the sake of clarity. There seem to be two clear trends, depending on the value of applied shear stress during creep behavior. Under applied shear stress of up to 5.01 Pa more rigid networks were observed, as shown by the fact that all these samples presented lower values of J(t) during both creep and recovery, and, therefore, with higher creep-recovery ability. In contrast, the samples with the highest applied shear stress (7.95 Pa) were softer and produced the highest J(t) values during both creep and recovery stages, reflecting lower creep-recovery ability. This indicates that during loading there may have been more sequential rupturing of crosslinks than in the other hummus samples, so initially short molecular fragments with weaker crosslinks may have ruptured. The creep–recovery tests show that applied shear stress of up to 5 Pa will provide a LVE response. This result is in agreement with the critical stress value (σmax = 12.6 Pa) obtained from stress sweep tests, discussed earlier. However, the results derived from the creep and recovery tests allow narrowing the LVE range showing that a stress of 7.95 Pa will cause the non-linear viscoelastic response of the hummus. From the Jmax and Jmin values at the end of the creep and recovery curves, respectively, the percentage of elasticity (Eq. [Citation4]) can be calculated for the different structures:[Citation32]
Moreover, the J(t) values from the creep curves can be used to calculate the relaxation modulus G(t),[Citation36] which can be fitted to the power law with time using Eq. (5).
where S (kPa·sn) is the gel strength, and n is the relaxation exponent related to the degree of connectivity in the gel.[Citation32] The experimental data fitted well to the power-law model, with R2 values ranging between 0.991 and 0.998 (). There was also a significant decrease in the percentage of elasticity with the increase in the applied shear stress. Therefore, the system was deformed from a lesser up to a greater extent by increasing the applied stress, and the degree of recovery was inversely proportional to the initial deformation. In addition, the progressive decrease in elasticity with increasing applied shear stress indicates that the hummus structure had been damaged more. When subjected to 7.95 Pa, many hydrogen bonds were broken during creep time, which produced a certain degree of irreversible structural damage; then, when the load was removed, the higher proportion of damaged structure produced an increase in J(t) during the recovery (), and elasticity diminished (). also shows that the sample subjected to the highest shear stress presented the lowest S and n parameters, although differences between n values of the samples subjected to 0.63–7.95 Pa were non-significant. Hummus samples subjected to 0.63 and 1.59 Pa had significantly higher S values than those subjected to 7.95 Pa. These data indicate that during creep time in the LVE range the samples preserved the initial level of chemical connectivity in the network better than those subjected to 7.95 Pa.
Steady-state shear measurements
Hysteresis loop area
Structural networks break down in the accelerating shear rate portion of a rheogram and restructure in the decelerating portion. When a sample is sheared at increasing and then at decreasing shear rates, the observation of a hysteresis area between the curves representing shear stress values indicates that the sample’s flow is time-dependent.[Citation7,Citation18,Citation37] According to the authors just cited, the area encircled between the ascending and the descending curves is an index of the energy per unit time and unit volume needed to eliminate the influence of time on the flow behavior. The hummus samples showed observable hysteresis at 25°C. (), indicating thixotropic breakdown and behavior of the product studied. The magnitude of the hysteresis loop was 3,493 ± 187 Pa·s–1. According to Muresan et al.,[Citation13] the existence of aggregate structures is strengthened by time-dependent rheological measurements performed, with hummus samples showing thixotropic behavior. Similar results have been reported for various commercial vanilla dairy dessert samples at 25°C by Tárrega et al.,[Citation18] vegetable and chicken infant purees at 5°C by Alvarez and Canet,[Citation37] and sunflower tahini at 40°C by Muresan et al.[Citation13] Assuming that a hysteresis loop area is an index of the energy needed to destroy the structure responsible for flow time dependence, the experimental data showed that the hummus samples needed high energy to break down the structure. Generally, a larger hysteresis loop area suggests a greater extent of destruction in gel structure.[Citation8]
Figure 3. a) Flow curves for commercially available Spanish hummus measured by increasing (forward measurements) and decreasing shear rate (backward measurements) without shearing. Mean values of 12 measurements ± standard deviation b) Flow curve fitted to the Herschel-Bulkley model for a single sample of commercially available Spanish hummus after shearing at 300 s−1 for 5 min.
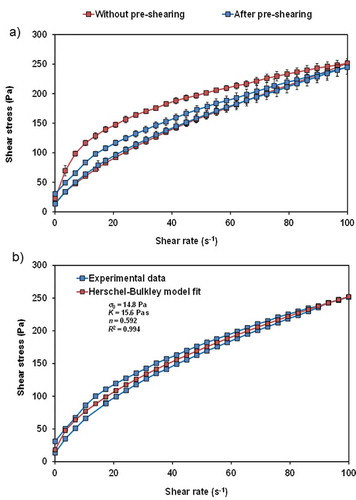
On the basis of the above results, before analyzing flow behavior a previous shearing of 5 min at 300 s–1 was applied to all the samples in order to eliminate or reduce the flow time dependence of the hummus.[Citation18] However, on recording shear stress variation with shear rate (forward and backward measurements) in order to guarantee the steady-state shear condition (~10 min), yet again all the samples showed observable hysteresis (). Indeed, the areas obtained after pre-shearing the samples (1272 ± 187 Pa s–1) were always less than half the values without previous shearing. The percentage of eliminated hysteresis loop was very nearly 65% in the hummus samples. It is known that in all agglomerated food systems some of the continuous phase is enclosed within the flocs and thus immobilized, determining a less freely available liquid phase. This might be also the case with the hummus, together with a reduced freely available oil phase due to its coarse particles. This result shows that more severe shearing conditions (i.e., longer times or higher shear rates) would have to be applied to obtain hummus samples in which no hysteresis area is detected.
Flow behavior
After reducing the flow time dependence by shearing, the hummus flow was measured, and all the samples showed non-Newtonian shear-thinning behavior with an apparent initial resistance to flow. Shear-thinning behavior is classically encountered in heterogeneous systems containing a dispersed phase.[Citation37] Assuming a non-linear relationship between shear stress and shear rate, the data obtained were fitted to the Casson (Eq. [Citation6]) and Herschel–Bulkley models (Eq. [Citation7]):[Citation38]
In Eq. (6), the Casson yield stress (Pa) is calculated as the square of the intercept, σ0 = K02, and the Casson viscosity (Pa s) is ηC = K2. In Eq. (7), K is the consistency index (Pa·sn), n is the flow behavior index (dimensionless), and σ0 is the yield stress (Pa). For both models, σ is the shear stress (Pa) and is the shear rate (s–1).
The experimental data fitted well to the Casson model, with R2 values ranging between 0.986 and 0.991. The yield stress value (σ0) from this model was 24.7 ± 0.87 Pa, indicating plastic behavior. The Casson plastic viscosity value of the hummus samples was 1.22 ± 0.06 Pa·s. However, the experimental data fitted better to the Herschel–Bulkley model, with R2 values ranging between 0.989 and 0.994. The Herschel–Bulkley yield stress (σ0) for the hummus samples was 14.2 ± 0.96 Pa, whereas the flow behavior index (n) was 0.588 ± 0.006, and the consistency index (K) was 15.4 ± 0.33 Pa·s. As an example, shows the experimental flow data of a sample of hummus after shearing of 5 min at 300 s–1, together with the corresponding fit to the Herschel–Bulkley model. Both power-law and Herschel–Bulkley models were used to describe the flow curves of vegetable-based infant purees.[Citation37] Based on the R2 correlation coefficient values, the Herschel–Bulkley model exhibited a better fit than the power-law model. This model was also found to be suitable for describing the flow of a semi-solid dairy dessert.[Citation18]
Many commercially valuable foods, such as apple sauce, tomato paste, and baby foods, are concentrated dispersions of insoluble matter in aqueous media with yield stress. Note that for the hummus, which was structured, the magnitudes of the Casson yield stress were higher than the Herschel-Bulkley yield stresses, corroborating previous findings.[Citation39]
Three-step shear rate test
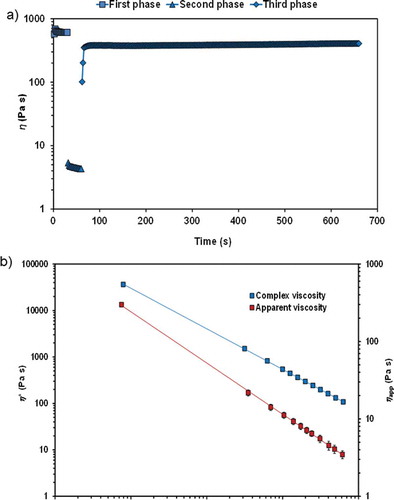
shows the experimental viscosity data vs. sequence time for a sample of hummus subjected to a viscometry rebuild analysis from three-step shear rate tests at 25 °C. For the hummus samples, the original and final apparent viscosities, the time taken from the onset of the third stage (after structural breakdown) to achieve rebuild of the viscosity to 90% of the original value, and the recovery percentage of the original viscosity at the end of the test, i.e., after a rebuild time of 600 s, were obtained. The original apparent viscosity value for the hummus samples at low shear rate (0.1 s–1) was 695.3 ± 73.1 Pa·s. When the shear ceases, the internal structure is recovered when the sample is left to rest for a more or less prolonged (recovery) time. The apparent viscosity value after restructuring for 600 s after cessation of flow (ηf) was 411.0 ± 46.6 Pa·s. As a result, the percentage of viscosity recovery calculated with respect to the ηf value was 59.1 ± 3.3. It was not possible to obtain the time required to recover 90% of the original apparent viscosity after structure breakdown of the hummus samples because it was higher than the rebuild time considered in this study (>600 s). A low viscosity recovery percentage and a long rebuild time indicate that the sample is thixotropic. Therefore, this test shows and confirms that the hummus had thixotropic behavior. Similarly, according to the SAOS measurements the hummus had high viscoelasticity and also long-lasting memory, exhibiting high elasticity.
Figure 4. a) Typical three-step shear rate test for a single sample of commercially available Spanish hummus, showing the changes in viscosity versus time b) Applicability of Cox-Merz rule for the commercially available Spanish hummus. Mean values of 12 measurements ± standard deviation.
Applicability of the Cox–Merz rule
Another of the goals of this study was to search for relationships between the oscillatory viscoelastic properties and steady-state rheological properties of the hummus. The Cox–Merz rule states that the complex viscosity (η*) at a specific oscillatory frequency (ω) is equal to the apparent viscosity (ηapp = σ/) at a specific shear rate (
), when ω =
.[Citation38]
As shows, the Cox–Merz rule could not be used directly. The η* magnitudes of the hummus samples were always higher than the ηapp magnitudes, as is commonly observed in food products. That is why oscillatory shear produces a small deformation which does not completely disturb the microstructure of the sample, whereas steady shear produces a large deformation which induces structural changes.[Citation8,Citation11,Citation12] On the other hand, it is possible to see that for the hummus the two lines are not parallel to each other, suggesting that a linear relationship between viscosities cannot be applied. Therefore, a modification of the Cox–Merz rule based on the power law (Eq. [Citation8]) was used for comparison of the two viscosities.
The values of parameters α and β (Eq. [Citation8]), estimated from mean viscosity curves, were 22.4 and 1.316, respectively, with R2 higher than 0.997. The power indices indicated that the relationship between the viscosities was clearly non-linear (the β value was not close to 1). A power-law modification of the Cox–Merz rule has recently been used successfully for highly pressurized tomato juice.[Citation11]
Microstructure examination
To achieve a better understanding of the rheological results, the microstructure of the system was also studied by SEM. The microstructure of this hummus consisted of a solid matrix of coarse aggregates which was dispersed in an oily liquid phase (). The oil phase enveloped the particle aggregates in a semi-solid gel network that prevented or delayed separation phenomena (). This structured solid matrix was mainly made up of amylose and amylopectin released from gelatinized chickpea and sesame starch granules with considerable coagulated and/or denatured protein structures. Other components in the hummus, such as insoluble fiber from both chickpea and sesame seeds, were superimposed on the solid network (). The solid phase was coarse and dense, explaining why the G*, G’, and η* values found in its mechanical spectra were high (), and it was not completely dispersed in the oily liquid phase, showing that it had not been finely ground. On the other hand, the oil phase was not enclosed in the solid component matrix (), which could justify the low G″ value and the high system viscoelasticity. A schematic structure for sunflower tahini was proposed by Muresan et al.[Citation13] from volume fraction estimations. Prototypes for high viscous and high thixotropic behavior with high volume fraction, and for light viscous and slightly thixotropic behavior with low volume fraction, with the commercial tahini reference being intermediate, were proposed and related to very different rheological properties.
Figure 5. Micrographs of commercial hummus at different magnifications. a) ×50 b) ×300 c) ×500 d) ×2000.
Particle size analysis
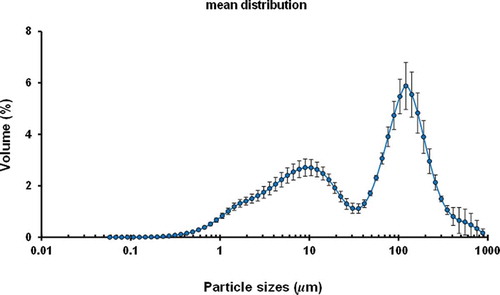
The hummus displayed a well-defined bimodal distribution (), with first and second populations of particles ranging from 0.05 to 12 μm and from 12 to 900 μm, respectively. The statistics of the particles were D [Citation3,Citation2] = 6.4 ± 0.5 μm, D [Citation4,Citation3] = 82.6 ± 10.6 μm, d (0.1) = 2.4 ± 0.2 μm, d (0.5) = 47.7 ± 16.9 μm, and d (0.9) = 200.1 ± 19.1 μm. Therefore, most of the particles had a diameter between 2.4 and 200.1 μm, with a dispersion index (S) of 4.14. This result indicates that the product suffered a high degree of destructurization during grinding. According to Servais et al.,[Citation40] a reduction in viscosity and better mixing can be obtained by using bimodal particle size distribution, thereby improving shear, time, and temperature stability of the final product. Bimodal distribution has also been reported in rice and chicken infant puree.[Citation30] The authors just cited found that the first population observed in rice and chicken puree could be explained by small oil droplet aggregates separated from a starch and protein matrix. The bimodal distribution obtained for the hummus might be explained in the same manner as that of the infant purees described by Alvarez and Canet,[Citation30] as also evidenced by the microstructure of the system explained above. As shown previously in the SEM images (), the large particles corresponded to an aggregate solid matrix formed mainly by swollen starch granules, protein, and fiber, which appeared as a population of particles with diameters predominantly ranging from 50 to 250 μm (), while a liquid phase of oil droplets with a smaller size range (<12 μm) was observed, derived mainly from the olive and sunflower oils included in the product. Muresan et al.[Citation13] obtained a multimodal distribution for sunflower tahini, which they explained by the presence of various resolvable (soluble) species in the sample.
Figure 6. Particle size distribution of commercially available Spanish hummus. Mean values of nine measurements ± standard deviation.
Conclusions
This study provided additional data on the mineral content in a commercial Spanish hummus, which are potentially useful to supplement the information about the nutritional values of the product. Results showed that oscillatory tests should be carried out under shear stress below 5 Pa to make sure that the behavior lies within the LVE range. Dynamic shear data revealed solid-like behavior, with G’ dominating over G″ and both viscoelastic properties showing a slight dependence on the imposed frequency. Tests done over longer time scales, such as creep–recovery experiments, showed low residual strain values and high elasticity, ranging between 60 and 70% in the LVE domain, indicating that the hummus structure was also a time-stable network with a high degree of connectivity. Hummus exhibited thixotropic behavior, and after reducing flow time dependence the samples showed pseudoplastic, non-Newtonian shear-thinning behavior that was consistent with the Herschel–Bulkley model. SEM and particle size analysis revealed that the different components in the hummus determining its rheological behavior were superimposed on a well-structured solid matrix predominantly made up of swollen starch granules, protein, and insoluble fiber separated from a liquid phase formed by smaller oil droplets. Results can be extrapolated and compared with other chickpea/hummus systems for the development by manufacturers of new convenience products for consumers.
Funding
The authors acknowledge the financial support of the Spanish Ministry of Economy and Competitiveness (AGL2011-28569).
Additional information
Funding
References
- Asif, M.; Rooney, L.W.; Ali, R. Application and Opportunities of Pulses in Food System: A Review. Critical Reviews in Food Science and Nutrition 2013, 53, 1168–1179.
- Aguilera, Y.; Esteban, R.M.; Benítez, V.; Molla, E.; Martín-Cabrejas, M.A. Starch, Functional Properties, and Microstructural Characteristics in Chickpea and Lentil as Affected by Thermal Processing. Journal of Agricultural and Food Chemistry 2009, 57, 10682–10688.
- Jukanti, A.K.; Gaur, P.M.; Gowda, C.L.L.; Chibbar, R.N. Nutritional Quality and Health Benefits of Chickpea (Cicer Arietinum L.): A Review. British Journal of Nutrition 2012, 108, S11–S26.
- United States Department of Agriculture. Agricultural Research Service. Food and Nutrient Database for Dietary Studies, 2013.
- O’Neil, C.E.; Nicklas, T.A.; Fulgoni III, V.L. Chickpeas and Hummus Are Associated with Better Nutrient Intake, Diet Quality, and Levels of Some Cardiovascular Risk Factors: National Health And Nutrition Examination Survey 2003–2010. Journal of Nutrition and Food Science 2014, 4, 254.
- Cabrera, C.; Lloris, F.; Giménez, R.; Olalla, M.; López, M.C. Mineral Content In Legumes And Nuts: Contribution To The Spanish Dietary Intake. The Science of the Total Environment 2003, 308, 1–14.
- Tabilo-Munizaga, G.; Barbosa-Cánovas G.V. Rheology for the Food Industry. Journal of Food Engineering 2005, 67, 147–156.
- Jiang, B.; Li, W.; Hu, X.; Wu, J.; Shen, Q. Rheology of Mung Bean Starch Treated by High Hydrostatic Pressure. International Journal of Food Properties 2015, 18, 81–92.
- Díaz-Ocampo, R.; Sánchez, R.; Franco, J.M. Rheology of Commercial and Model Borojó Jam Formulations. International Journal of Food Properties 2014, 17, 791–805.
- Steffe, J.F. Rheological Methods in Food Process Engineering, 2nd Ed; Freeman Press: East Lansing, MI, 1996.
- Augusto, P.E.D.; Ibarz, A.; Cristianini, M. Effect of High Pressure Homogenization (HPH) on the Rheological Properties of Tomato Juice: Viscoelastic Properties and the Cox–Merz Rule. Journal of Food Engineering 2013, 114, 57–63.
- Alvarez, M.D.; Fernández, C.; Canet, W. Rheological Behaviour of Fresh and Frozen Potato Puree in Steady and Dynamic Shear at Different Temperatures. European Food Research and Technology 2004, 218, 544–553.
- Muresan, V.; Danthine, S.; Racolta, E.; Muste, R.; Blecker, C. The Influence of Particle Size Distribution on Sunflower Tahini Rheology and Structure. Journal of Food Process Engineering 2014, 37, 411–426.
- Abu-Jdayil, B. Flow Properties of Sweetened Sesame Paste (Halawa Tehineh). European Food Research and Technology 2004, 219, 265–272.
- Abu-Jdayil, B.; Al-Malah, K.; Asoud, H. Rheological Characterization of Milled Sesame (Tehineh). Food Hydrocolloids 2002, 16, 55–61.
- Campo-Deaño, L.; Tovar, C.A. The Effect of Egg Albumen on the Viscoelasticity of Crab Sticks Made from Alaska Pollock and Pacific Whiting Surimi. Food Hydrocolloids 2009, 23, 1641–1646.
- Ghannam, M.T. Creep–Recovery Experimental Investigation of Crude Oil–Polymer Emulsions. Journal of Applied Polymer Science 2004, 92, 226–237.
- Tárrega, A.; Durán, L.; Costell, E. Flow behaviour of Semi-Solid Dairy Desserts. Effect of Temperature. International Dairy Journal 2004, 14, 345–353.
- Benković, M.; Srečec, S.; Špoljarić, I.; Mršić, G.; Bauman, I. Flow Properties of Commonly Used Food Powders and Their Mixtures. Food and Bioprocess Technology 2013, 6, 2525–2537.
- Hirsch, D.; Tene, O. Hummus: The Making of an Israeli Culinary Cult. Journal of Consumer Culture 2013, 13, 25–45.
- Regulation (EC) No 1924/2006 of the European Parliament and of the Council of 20 December 2006 on nutrition and health claims made on foods. Official Journal of the European Union L 404/9–25.
- Regulation (EU) No 1047/2012 of 8 November 2012 Amending Regulation (EC) No 1924/2006 with Regard to the List of Nutrition Claims. Official Journal of the European Union L 310/36–7.
- Poltronieri, F.; Arêas, J.A.; Colli, C. Extrusion and Iron Bioavailability in Chickpea (Cicer arietinum L.). Food Chemistry 2000, 70, 175–180.
- Boussaid, A.; Chouaibi, M.; Rezig, L.; Missaoui, R.; Donsí, F.; Ferrari, G.; Hamdi, S. Physicochemical, Rheological, and Thermal Properties of Six Types of Honey from Various Floral Origins in Tunisia. International Journal of Food Properties 2015, 18, 2624–2637.
- Mezger, T. The Rheology Handbook; Vincentz Network GmbH & Co. KG: Hannover, Germany, 2006.
- Campo-Deaño, L.; Tovar, C.A.; Borderías, J. Effect of Several Cryoprotectants on the Physicochemical and Rheological Properties of Suwari Gels from Frozen Squid Surimi Made by Two Methods. Journal of Food Engineering 2010, 97, 457–464.
- Alvarez, M.D.; Fuentes, R.; Olivares, M.D.; Cuesta, F.J.; Canet, W. Thermorheological Characteristics of Chickpea Flour Slurry as Affected by Moisture Content. Journal of Food Engineering 2014, 136, 9–18.
- Campo-Deaño, L.; Tovar, C.A. Influence of the Starch Content in the Viscoelastic Properties of Surimi Gels. Journal of Food Engineering 2008, 84, 140–147.
- Canet, W.; Jiménez, M.J.; Fuentes, R.; Alvarez, M.D. Formulation Development of a New Chickpea Gel Using Response Surface Methodology and Instrumental and Sensory Data. Journal of Food Process Engineering 2015, 38, 271–289.
- Alvarez, M.D.; Canet, W. Dynamic Viscoelastic Behavior of Vegetable-Based Infant Purees. Journal of Texture Studies 2013a, 44, 205–224.
- Rosalina, I.; Bhattacharya, M. Dynamic Rheological Measurements and Analysis of Starch Gels. Carbohydrate Polymers 2002, 48, 191–202.
- Herranz, B.; Tovar, C.A.; Solo-de-Zaldívar, B.; Borderías, A.J. Effect of Alkalis on Konjac Glucomannan Gels for Use as Potential Gelling Agents in Restructured Seafood Products. Food Hydrocolloids 2012, 27, 145–53.
- Chen, H.H.; Xu, S.Y.; Wang, Z. Interaction Between Flaxseed Gum and Meat Protein. Journal of Food Engineering 2007, 80, 1051–1059.
- Cando, D.; Moreno, H.M.; Tovar, C.A.; Herranz, B.; Borderías, J. Effect of High Pressure and/or Temperature over Gelation of Isolated Hake Myofibrils. Food and Bioprocess Technology 2014, 7, 3197–3207.
- Meares, C.A.; Bogracheva, T.Y.; Hill, S.E.; Hedley, C.L. Development and Testing of Methods to Screen Chickpea Flour for Starch Characteristics. Starch/Stärke 2004, 56, 215–224.
- Ferry, J.D. Viscoelastic Properties of Polymers, 3rd Ed; John Wiley & Sons: New York, NY, 1980.
- Alvarez, M.D.; Canet W. Time-Independent and Time-Dependent Rheological Characterization of Vegetable-Based Infant Purees. Journal of Food Engineering 2013, 114, 449–464.
- Rao, M.A. Rheology of Fluid and Semisolid Foods: Principles and Application; Aspen Publishers: Gaithersburg, 1999.
- Canet, W.; Alvarez, M.D.; Fernández, C.; Luna, P. Comparisons of Methods for Measuring Yield Stresses in Potato Puree: Effect of Temperature and Freezing. Journal of Food Engineering 2005, 68, 144–153.
- Servais, C.; Jones, R.; Roberts, L. The Influence of Particle Size Distribution on the Processing of Food. Journal of Food Engineering 2002, 51, 201–208.