
ABSTRACT
The degree of hydrolysis is one of the most important indexes for process control and quality assessment in proteins enzymatic hydrolysis. This article proposed a simple and rapid near infrared spectroscopy method for real-time quantifying the degree of hydrolysis in alcalase hydrolysis process. Efficient variables selection algorithms were systemically studied in multivariate calibrations; the partial least squares coupled with uninformative variables elimination and ant colony optimization were proposed for modeling with results yielding Rp = 0.9525. Additionally, 10 independent samples with the relative error less than 10% further confirmed the stability and reliability of this method. This work demonstrated that the near infrared spectroscopy technique with a selected multivariate calibration has a high potential for in situ monitoring of alcalase hydrolysis process in protein industry.
Introduction
Dietary proteins that arrange as strands of amino acids with carbon, hydrogen, oxygen, and nitrogen, are important nutrients for humans.[Citation1] They play a vital role in tissue maintenance and body functions, as well as being essential components in the cells of the muscles, bones, organs, tendons, and ligaments.[Citation2] In particular, peptides, which are protein hydrolysates obtained mainly by enzymatic proteolysis of proteins from various food sources, have aroused considerable attentions due to their unique bioactive natures. Increasing researches demonstrate that these peptides possess multi-biological functions including antioxidant, antimicrobial, hypotensive, anticoagulant, and cholesterol-lowering ability,[Citation3] and have potentials in cancer targeting labelling and identification diagnosis.[Citation4,Citation5] Thus, as a kind of important industry material, they are widely applied in the fields of drugs,[Citation6] nutraceuticals,[Citation7] and food additives,[Citation8] and processed into varying commodities that are extensively consumed throughout the world. However, such peptides are inactive within the sequence of the parent protein and make the efficiency of their digestion or absorption affected under an in sufficient proteolysis. Therefore, the identification and quantitation of these peptides in the modern industry are of great significant for their biological value and interests to both producers and consumers.
Degree of hydrolysis (DH), as a widely used index, indicates the extent of protein hydrolysates. It is defined as the percent ratio of the number of peptide bonds cleaved (h) to the total number of bonds available for proteolytic hydrolysis.[Citation9,Citation10] Although accurate measurements can be achieved by the use of destructive chemical detections, it has the demerits of such as lacking the capability for to on- or at-line testing, time-consuming, and labor-intensive. Albeit there are emerged and improved methods for determining the DH of food protein with simpler operations and broader applications,[Citation11,Citation12] most of them are still laborious and chemicals analytical demanding, and thus cannot be employed for real time monitoring of a hydrolysis reaction. Hence, the demand for rapid and nondestructive estimation of DH for protein is urgent.
Recently, near infrared (NIR), as an advanced and excellent analytical technique, raises considerable interests for its various applications in the food field.[Citation13–Citation16] Compared to the stated methods, the technique reveals several advantages such as rapidity as well as being environmentally friendly;[Citation17] and are capable of providing reproducible results with minimal sample preparation. Besides, infrared spectroscopy are mainly the absorption of the overtones and the combination of some functional groups in samples,[Citation18] which records multi-information that can widely be used in molecular structures identification. On the basis of these characterizations, it is possible to real-time monitor the variation of DH with the proposed NIR technique.
Notably, there are few reports available to relate the feasibility of estimating DH using NIR instrument. Egg white proteins (EWPs) were chosen here as the substrate of hydrolysis with the following reasons: on one hand, the EWPs are mainly consisted of ovoalbumin, ovotransferrin, and lysozyme. These proteins are globular in nature with a number of intramolecular disulfide bonds as well as hydrophobic interactions between nonpolar amino acid groups buried inside.[Citation19,Citation20] Considering the detailed constructs of EWP have been studied, it is helpful for further verifying to ascertain the spectrum absorption peaks for functional groups. On the other hand, the EWP possesses excellent functional capabilities, such as foaming, gelation, and emulsification,[Citation21] which enables EWP to be processed into additives that are widely used in bakery products, meringues, meat products, and cookies.[Citation19]
Moreover, developing a simple and robust calibration model is essential for the monitoring of DH by the NIR-based method. Partial least squares (PLS) is one of the most used multivariate regression tool that operates on a full spectrum.[Citation22] Though it preserves all the information from samples, there are still some irrelevant and collinear spectral variables that affect the stability and prediction ability of this model.[Citation18] Therefore, variables selection is always the priority issue that needs consideration, and crucial in improving the performance of model and simplifying the structure of model. Herein, uninformative variables elimination (UVE), competitive adaptive reweighted sampling (CARS), and a novel algorithm of UVE combined with ant colony optimization (ACO), namely UVE-ACO, were used comparatively in characteristic variables selection.
This article addresses the feasibility of real-time monitoring of the DH during the alcalase hydrolysis process of EWP by NIR spectrum with a powerful characteristic variables selection algorithm. The specific work is outlined as follows: (1) Chemical measurement of DH values during protein hydrolysis and NIR spectra data acquisition; (2) use of three variables selection algorithms such UVE, CARS, and UVE-ACO independently for modeling; (3) testing of model for independent samples.
Materials and methods
Sample preparation
In this work, chicken eggs were purchased from the local Auchan supermarket and selected from the same batch and brand for consistency of experimental sample conditions. Initially, egg white was separated from washed eggs and freeze-dried under –80°C for 4 h. Subsequently, they were ground into power as natural EWP samples for future use.
Reference measurement
Reference analysis for the monitoring of DH was operated by the pH-stat method. For controlling the series of protein hydrolysis, samples were managed as follows: one liter of aqueous solution containing 30 g EWP power was water bath-boiled under 95°C for 15 min. After cooling to room temperature and regulating pH to 9.0, alkaline protease, weighted 6% (wt) of the solvent was added to the suspension. Finally, the system was heated to 55°C for sustained enzymatic hydrolysis with general stirring and measured at 15 mL intervals as samples for further analysis. The DH value with pH-stat method was evaluated by mixing alkali titrants with samples so as to balance the pH value; and calculated as follows:
where B is the volume of alkali consumed (mL); Np is the normality of the alkali; Mp is the mass of substrate protein (g); htot is the total number of peptide bonds in the protein, and valued as 7.67 meq g−1 protein here; is defined as the average degree of dissociation of the
-NH groups and calculated as:
Specifically, before spectra collection, the measured 15 mL of sample solution was successively boiled in 10 min, regulated pH to 7.0, and centrifuged at 5000 r/min for 10 min in order to obtain the immediate measured supernatants which are capable of avoiding the influence of suspension and strong basicity.
Spectra collection
The NIR spectra of varying DH samples were recorded using an AntarisTM II NIR spectrometer (Thermo Scientific Co., USA) coupled with a transmittance module. A 1 mm optical path length quartz cuvette was employed as sample holder, and was washed with distilled water three times for each sample before spectra collection. Each NIR spectrum was the average of 64 scans and collected range from 4000 to 10,000 cm−1 at a resolution of every 8 cm−1. Multi-transmission spectra of the samples were presented in absorbance units (log [1/T], where T = transmittance) after taking into account the background spectrum of distilled water. Meanwhile, parallel tests were carried out three times for each sample and the triplicate measurements were averaged to form a unique spectrum for each sample used for the subsequent analysis.
Multivariate analysis
NIR spectroscopy combined with wavenumber variables selection approaches were attempted to develop PLS models for predicting DH of samples. Initially, a full spectrum-based PLS model was calibrated; then, three commonly used wavenumber selection methods, including UVE-PLS, CARS-PLS, and UVE-ACO-PLS were studied systematically and comparatively for eliminating irrelevant variables toward achieving a good model.
The UVE algorithm proposed by Centner et al. was an artificial standard based variable selection method.[Citation23] The value of each variable is assessed by comparing its reliability index (RI), which is a function of the regression coefficients of artificial random variables; and the wavenumber variables will be eliminated if there are no more significance to the artificial variables.[Citation24]
The CARS algorithm developed by Hongdong Li et al employs a simple but effective principle named “survival of the fittest,” which is based on the Darwin’s evolution theory.[Citation25] The significance of each variable was evaluated according to the absolute value of the regression coefficients. CARS selects K subsets of variables by K Monte Carlo (MC) sampling runs in an iterative manner and chooses the one with the lowest root mean square error of cross-validation (RMSECV) value as the best variable subset.[Citation22]
A novel variables selection algorithm that combines UVE with ACO, namely UVE-ACO was attempted in this work. Considering the variables obtained from UVE are often times still more, further selection of valid variable from UVE is quite necessary. As a result, further optimized variables were achieved via ACO algorithm.[Citation26] The ACO algorithm was first described by Dorigoet al. in the early 1990s, and widely introduced for spectral variables selection in PLS regression problems.[Citation27,Citation28] Variables with related properties of samples are identified when spectroscopic analysis is combined with chemometrics. The resembled behavior of ant colonies in the search of the best path to food sources enabled ACO to use the concept of cooperative pheromone accumulation to optimize models via a given-defined number of variables selected by the MC approach.[Citation22]
The optimal models were selected according to the lowest RMSECV, and the performance of the final model was evaluated according to the correlation coefficient of calibration set (Rc) and prediction set (Rp), the root mean square error in the calibration (RMSEC) set and prediction set (RMSEP). Details about the RMSECV, Rc, RMSEC, Rp, and RMSEP can be referred to Chen et al. and Pan et al.[Citation29,Citation30] Besides, in order to efficiently monitor the DH of EWP, a simple model should be developed with variables as less as possible. All data processing and analysis were carried out in Matlab Version 7.11.0 (Mathworks, Natick, USA) in Windows 7.
Results and discussion
Reference measurements
Alkaline proteases are a kind of efficient alternatives to chemicals that particularly are suitable for applications in the food industries.[Citation31] They have raised considerable attentions due to their superior characteristics, such as high stability and activity under harsh reactions, significant abilities of varying proteinacious substrates hydrolysis, and wide range of operational conditions.[Citation31,Citation32] Additionally, in the pH-stat theory, it is believed that during the enzymatic hydrolysis of peptide bonds, are always accompanied by the releasing or absorption of protons. In other words, the pH shift of the solution directly reflects the DH; and the changes of pH can be automatically stabilized by the addition of a titrant, i.e., HCl or NaOH. Accordingly, at a certain pH level, the volume of consumed titrant is proportionally to equivalent cleaved peptide bonds.[Citation33] Therefore, alkaline proteases were used to efficiently hydrolyze the EWP and the pH shift of the solution was stabilized by NaOH titrant. revealed the variation trend of DH during EWP hydrolysis; and the values first increased rapidly, then increased gently.
Figure 1. A: The raw NIR spectra; and B: the SNV preprocessed spectra of EWP enzymolysis samples.
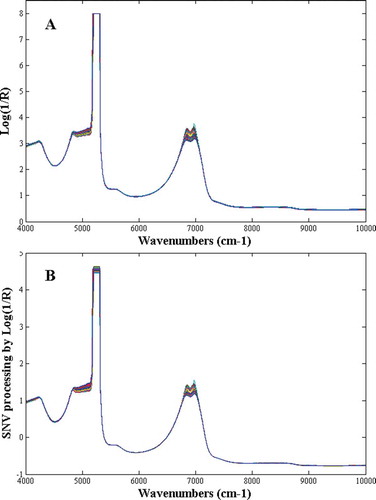
Figure 2. Variation trend of DH values during the enzymatic hydrolysis of egg white protein.
Before modeling, all 85 samples were divided into two subsets, namely the calibration set and the prediction set. Samples in the calibration set were utilized to build the model and those in the prediction set were used to evaluate the performance of the final model. Specifically, for enhancing the high robustness and generalization of developed models, samples were selected as follows: first, all samples were arranged into an ascending order and put into groups of five each. Within each group, odd numbered samples were selected to constitute the calibration and the even ones for the prediction set. Detailed information about samples is shown in .
Table 1. Reference measured values of DH of samples in the calibration and prediction sets.
Spectral data preprocessing and investigation
Eighty-five spectra corresponding to 85 collected EWP hydrolysis samples were recorded by NIR. showed the raw spectra of all the samples. As seen in , the peaks near 5200 cm−1 were saturated with high noise signals. Accordingly, between 5025 and 5280 cm−1, which related to -OH from water were considerate to be removed.[Citation18] To remove slope variation and correct the scatter effects which were induced by tiny particles or bubbles in samples, standard normal variate (SNV) transformation spectral preprocessing method was used in this work. The SNV transformation approach was executed by subtracting the mean of the spectrum and scaling it with the standard deviation of each spectrum, and expressed in Eq. (3):
where xi,SNV is the SNV transformed spectral value for the ith variable, xi is the ith variable in the raw spectrum, and is the mean of the raw spectrum. showed the SNV preprocessed spectra of all the samples. It is well known that the hydrolysis of protein is a rather complex process, which contains changing of protein structures and numerous related chemical bonds. Generally, the amide II band (N-H deformation coupled with C-N stretching) and the amide III band (N-H deformation coupled with CH2 deformation) are sensitive to the protein structures;[Citation34] and are absorbs in shown in around 4268–4863 and 5063–6211 cm−1 attributed to the existence of the stated chemical structures, which further confirmed the relationship between the DH values and its characteristic NIR spectroscopy.
Selection of effective wavenumber
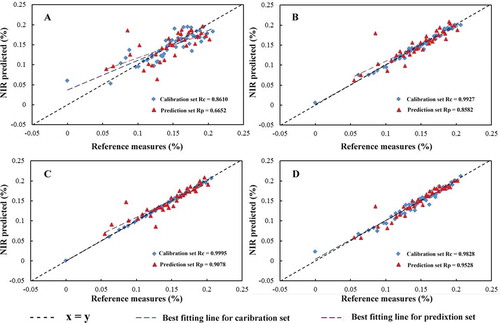
In order to achieve the best model for real-time monitoring of DH during the hydrolysis of EWP, multivariate calibrations were studied systematically and comparatively. First, for highlighting the significance of spectral variables selection, three different methods including UVE-PLS, CARS-PLS, and UVE-ACO-PLS were attempted in contrast to a classical PLS model; and then comparisons were also made between the stated variables selection methods to obtain the most efficient variables. The relationship between the reference measured and NIR predicted values in both calibration and prediction sets can be seen in the scatter plots in , wherein (A) is for PLS, (B) is for UVE-PLS, (C) is for CARS-PLS, and (D) is for UVE-ACO-PLS.
Figure 3. Spectral variables selected by A: UVE, B: CARS, and C: UVE-ACO.
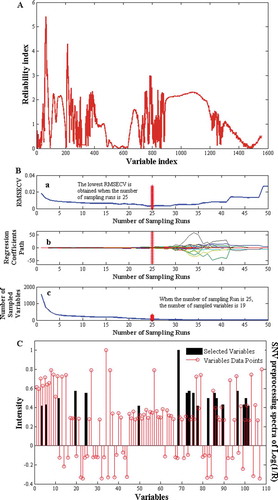
Figure 4. Scatter plots between reference measurements and NIR predicted results in calibration and prediction sets for A: PLS, B: UVE-PLS, C: CARS-PLS, and D: UVE-ACO-PLS.
UVE-PLS model
With regards to UVE-PLS model MC strategy was employed for sampling in the variable space. It helps to eliminate the uninformative variables and simultaneously estimate its predictive performance. The RI value was used to assess the importance of variable, in order to eliminate variables of low RI. As seen in , the folded diagram of RI was selected for variables in the final model and a red dashed-dotted line indicated that the RI of variables that were higher than 1.9 could be chosen for calibrations. Accordingly, the optimized UVE-PLS were developed with 108 variables. is the scatter plot revealing the relationship between reference measured values and NIR predicted ones in both calibration and prediction sets; yielding 0.9927 for Rc and 0.8582 for Rp, respectively.
CARS-PLS model
In the calculation of CARS, three parameters including the maximal principle to extract A, the group number for cross validation K and the number of sampling N were optimized first, and defined as A = 18, K = 5, N = 50. Results were concluded in . Specifically, plot (a) revealed 5-fold RMSECV values with the increased sampling runs from the CARS running. As seen from plot (a), the RMSECV decline was steep at the former 10 sampling runs which could be attributed to the elimination of redundant variables, then decreased gently at the middle section; and finally the values increased rapidly corresponding to the loss of crucial wavenumber from the optimal subset (denoted by red asterisks). Plot (b) showed the regression coefficient path of each variable with the increased sampling runs from the CARS running. The variables would be more probably kept with larger coefficient absolute values. Plot (c) showed the variation trend of the number of sampled variables with the increased sampling runs from the CARS running. The number of sampled variables decreased urgently at first, and then gently, which indicates the fast selection and refined section, respectively. Finally, 60 variables were selected when the number of sampling runs was 25 (marked by the asterisks). The optimized CARS-PLS model achieved as shown in , the red triangles indicated the samples in the calibration set with Rc = 0.9995; and the blue ones indicated the samples in the prediction set with Rp = 0.9078.
UVE-ACO-PLS model
To obtain an efficient model, the ACO method was conducted on each UVE reduced variables. In the calculation of ACO, several required parameters were set according to substantial trials-based experience:[Citation22] the initial population was set to 80; the maximum number of iterations was set to 50; the maximum number of cycles was set to 20; the probability threshold of variable selection was set to 0.3; and the pheromone attenuation coefficient was set to 0.65. demonstrated the characteristic wavenumber selected by ACO method after UVE-based variables selection. As seen in , there were 19 variables contained with larger frequency; and these selected variables resembled those selected by CARS but not all the same. shows the scatter plot revealing high correlation between references measured and NIR predicted values both in calibration and prediction sets; and the correlation coefficient of Rc and Rp were 0.9828 and 0.9528, respectively, in the optimized UVE-ACO-PLS model.
Discussion
outlined the overall results. The results in and confirmed the feasibility of real-time estimating of the DH using the proposed NIR technique in this work. Additionally, the three variables selection-based regression tools were substantially superior to the classical PLS model, exhibiting improved performance and fewer variables; and through further comparison, the UVE-ACO-PLS model made great progress in measurement with the least variables but the best result. The main reasons are summarized as follows.
Table 2. Results of different regression models for predicting the DH values in EWP enzymolysis.
PLS as a commonly used multivariate regression tool, was implemented to build a model with the full spectrum including 1557 variables here. Such enormous data contained informative variables as well as the collinear or irrelevant ones that were unrelated to protein hydrolysis. Accordingly, as seen in , the performance of PLS model will inevitably weaken due to the redundant related variables with results of Rc = 0.8610 and Rp = 0.6652 in the calibration set and prediction set, respectively. UVE method initially develops large numbers of models with randomly selected calibration samples, and then each variable is evaluated with a stability of the corresponding coefficients in these models.[Citation35,Citation36] Hence, variables that demonstrated poor stability are deemed as uninformative and can be eliminated eventually before modeling. In this work, the optimal intervals of UVE model were labeled as 4400–4690, 4900–5164, 5400–5534, 6800–7069, and 7231–7385 cm−1, with a total number of 108 variables. Compared to the 1557 original variables, the number of variables has been greatly reduced, which explained the better performance of the UVE-PLS model. Nevertheless, the hydrolysis of proteins is a rather complex processing that are accompanied with sophisticated chemical reactions, such as the producing of glutamine, the qualitative changes of EWPs, and the stretching vibrations of CHx from amino acid side chains, etc. These chemical groups are mainly assigned to the interval of 4262–6211 cm−1 in the NIR spectrum.[Citation34] Thus, there are tendencies of some irrelevant or collinear wavenumber variables influencing the stability and precision of this model. The CARS algorithm, as an alternative and efficient approach for uninformative variable elimination, is also based on the large absolute regression coefficient values to evaluate the importance of each variable. Uniquely, it reveals better solutions in discrete wavenumber selection, in other word, the CARS approach performs better if the meaningful wavenumber bands are far away from each other.[Citation36,Citation37] As the characteristic chemical functions stated above, the corresponding wavenumber for these bonds are not adjacent to each other, which will be more suitable for CARS-PLS algorithm in this work. Accordingly, a better performance of CARS-PLS model with results of Rc = 0.9995 and Rp = 0.9078 in the calibration set and prediction set, respectively, obtained with 60 variables, which were 4215–4350, 4678–5122, 5330–5507, 6614–7378, and 9873–9912 cm−1. Considering the larger number of original variables (i.e., 1557 variables) in this work, it will be more difficult for variables selection methods to choose characteristic wavenumbers with random selection behaviors. Thus the hybrid algorithm may present a better choice for compatible real-time monitoring model calibrations.[Citation38] A hybrid method, ACO followed by UVE, denoted as UVE-ACO-PLS was employed here: in the UVE step, unrelated variables are eliminated in order to reduce computing time in the following ACO step, and to improve the performance of the ACO-step. Finally, 19 variables, including 4439, 4474, 4481, 4558, 4566, 4574, 4605, 4624, 4670, 4674, 4686, 5415, 5426, 5438, 5442, 5445, 5492, 7038 and 7042 cm−1 were selected from 108 variables. Critical examination of these wavenumbers reveals that they are mainly assigned to structure transformation from -helix (4268–4863 cm−1) to β-sheet (4323–4535 cm−1) and reflecting NH stretching and NH deformation of amides A and B in the peptide groups.[Citation39] On the basis of these characterizations, the UVE-ACO-PLS algorithm achieved the optimal model with the simplest operation but the best quantifying results of Rc = 0.9828 and Rp = 0.9528 in the calibration set and prediction set, respectively, when compared to the other three models. Moreover, based on the overview of other related works, there is a an indication that the proposed method does not only simplify the multi-steps pretreatment of samples as well as relieved off the labor intensive procedures, but also achieve reliable results which are suitable for high-throughput and real-time quantifying.[Citation11,Citation40] Thus, the proposed NIR method with the efficient UVE-ACO-PLS algorithm could meet the demand for in situ monitoring of DH in industry protein hydrolysis under alkaline proteases conditions to obtain reliable results.
In addition, for verifying the stability and reliability of this NIR-based spectroscopy method, 10 independent samples with three times spectra were taken into the optimal model, respectively. Herein, relative error (RE), which describes the comparison results of NIR predicted values and chemical measured ones, were employed to evaluate the performance of this method. showed RE for the three times predictive values of DH. As seen in this figure, all of the obtained RE results were less than 10%, and the standard deviation could be kept under 3% according to the value of DH, which further confirmed the stability and reliability of measurement by the proposed NIR spectroscopy method in this work.
Figure 5. RE (%) values of three times NIR predicted values for DH.
Conclusion
This work demonstrated that NIR spectroscopy combined with an efficient modeling algorithm has a high potential in the rapid measurement of the DH of EWPs under alkaline proteases enzymolysis; besides, an optimum PLS regression algorithm coupled with UVE and ACO, namely UVE-ACO-PLS revealed remarkable results that are extremely suitable for monitoring the DH value. With improved model calibrations, NIR spectroscopy technique can be a promising tool for in situ monitoring varying hydrolysis process in the food industry.
Funding
This work has been financially supported by the National Natural Science Foundation of China (31471646), and the Natural Science Foundation of Jiangsu Province (BK20150502).
Additional information
Funding
References
- de Moraes, A.C.; Bel-Serrat, S.; Manios, Y.; Molnar, D.; Kafatos, A.; Cuenca-García, M.; Huybrechts, I.; Sette, S.; Widhalm, K.; Stehle, P. Dietary Protein and Amino Acids Intake and Its Relationship with Blood Pressure in Adolescents: The Helena study. European Journal of Public Health 2015, 25, 450–456.
- Drotningsvik, A.; Mjøs, S.A.; Høgøy, I.; Remman, T.; Gudbrandsen, O.A. A Low Dietary Intake of Cod Protein Is Sufficient to Increase Growth, Improve Serum and Tissue Fatty Acid Compositions, and Lower Serum Postprandial Glucose and Fasting Non-Esterified Fatty Acid Concentrations in Obese Zucker Fa/Fa Rats. European Journal of Nutrition 2014, 54, 1151–1160.
- Sila, A.; Bougatef, A. Antioxidant Peptides from Marine by-Products: Isolation, Identification and Application in Food Systems. A Review. Journal of Functional Foods 2016, 21, 10–26.
- Rania, S.; Avneet, G.; Tara, S.; Afsaneh, L.; Kamaljit, K. Proteolytically Stable Cancer Targeting Peptides with High Affinity for Breast Cancer Cells. Journal of Medicinal Chemistry 2011, 54, 7523–7534.
- Mathews, A.S.; Ahmed, S.; Shahin, M.; Lavasanifar, A.; Kaur, K. Peptide Modified Polymeric Micelles Specific for Breast Cancer Cells. Bioconjugate Chemistry 2013, 24, 560–570.
- Kelly, P.; Anand, P.; Uvaydov, A.; Chakravartula, S.; Sherpa, C.; Pires, E.; O’Neil, A.; Douglas, T.; Holford, M. Developing a Dissociative Nanocontainer for Peptide Drug Delivery. International Journal of Environmental Research & Public Health 2015, 12, 12543–12555.
- Xiang, D.; Fengfeng, W.; Mei, L.; Na, Y.; Chunsen, W.; Yamei, J.; Jingjing, Y.; Zhengyu, J.; Xueming, X. Naturally Occurring Angiotensin I-Converting Enzyme Inhibitory Peptide from a Fertilized Egg and Its Inhibitory Mechanism. Journal of Agricultural & Food Chemisty 2014, 62, 5500–5506.
- Orduna, A.R.; Husby, E.; Yang, C.T.; Beaudry; Ghosh, D.; Francis, B. Assessment of Meat Authenticity Using Bioinformatics, Targeted Peptide Biomarkers and High-Resolution Mass Spectrometry. Food Additives and Contaminants—Part A. Chemistry Analysis Control Exposure and Risk Assessment 2015, 32, 1–9.
- Tonon, R.V.; Santos, B.A.D.; Couto, C.C.; Mellinger-Silva, C.; Brígida, A.I.S.; Cabral, L.M.C. Coupling of Ultrafiltration and Enzymatic Hydrolysis Aiming at Valorizing Shrimp Wastewater. Food Chemistry 2015, 198, 20–27.
- Adler-Nissen, J. Determination of the Degree of Hydrolysis of Food Protein Hydrolysates by Trinitrobenzenesulfonic Acid. Journal of Agricultural & Food Chemisty 1979, 27, 1256–1262.
- Cheison, S.C.; Zhang, S.B.; Wang, Z.; Xu, S.Y. Comparison of a Modified Spectrophotometric and the pH-Stat Methods for Determination of the Degree of Hydrolysis of Whey Proteins Hydrolysed in a Tangential-Flow Filter Membrane Reactor. Food Research International 2009, 42, 91–97.
- Nielsen, P.M.; Petersen, D.; Dambmann, C. Improved Method for Determining Food Protein Degree of Hydrolysis. Journal of Food Science 2001, 66, 642–646.
- Wu, Z.; Long, J.; Xu, E.; Wu, C.; Wang, F.; Xu, X.; Jin, Z.; Jiao, A. Application of FT-NIR Spectroscopy and FT-IR Spectroscopy to Chinese Rice Wine for Rapid Determination of Fermentation Process Parameters. Analysis Methods 2015, 7, 2726–2737.
- Kumaravelu, C.; Gopal, A. Detection and Quantification of Adulteration in Honey Through Near Infrared Spectroscopy. International Journal of Food Properties 2015, 18, 1930–1935.
- Sun, L.; Hui, G.; Gao, S.; Liu, J.; Wang, L.; Dai, C. Prediction of Benzoyl Peroxide in Flour using Near Infrared Spectroscopy Technique. International Journal of Food Properties 2016, 19, 1115–1126.
- Noypitak, S.; Terdwongworakul, A.; Krisanapook, K.; Kasemsumran, S. Evaluation of Astringency and Tannin Content in “Xichu” Persimmons Using Near Infrared Spectroscopy. International Journal of Food Properties 2014, 18, 131–139.
- Gredilla, A.; Vallejuelo, F.O.D.; Elejoste, N.; Diego, A.D.; Madariaga, J.M. Non-Destructive Spectroscopy Combined with Chemometrics as a Tool for Green Chemical Analysis of Environmental Samples: A Review. Trac Trends in Analytical Chemistry 2016, 76, 30–39.
- Ouyang, Q.; Zhao, J.; Chen, Q. Measurement of Non-Sugar Solids Content in Chinese Rice Wine Using Near Infrared Spectroscopy Combined with an Efficient Characteristic Variables Selection Algorithm. Spectrochimica Acta Part A Molecular & Biomolecular Spectroscopy 2015, 151, 280–285.
- Chang, C.; Niu, F.; Su, Y.; Qiu, Y.; Gu, L.; Yang, Y. Characteristics and Emulsifying Properties of Acid and Acid-Heat Induced Egg White Protein. Food Hydrocolloids 2016, 54, 342–350.
- Antonios, D.; Vassilis, K. Stability of Acidic Egg White Protein Emulsions Containing Xanthan Gum. Journal of Agricultural & Food Chemistry 2006, 54, 10164–10169.
- Foegeding, E.A.; Davis, J.P. Food Protein Functionality: A Comprehensive Approach. Food Hydrocolloids 2011, 25, 1853–1864.
- Pan, W.; Zhao, J.; Chen, Q.; Yuan, L. In Situ Monitoring Total Polyphenols Content During Tea Extract Oxidation Using a Portable Spectroscopy System with Variables Selection Algorithms. Royal Society of Chemistry Advances 2015, 5, 60876–60883.
- Centner, V.; Massart, D.L.; Noord, O.E., De; Jong, S., De Vandeginste, B.M.; Sterna, C. Elimination of Uniformative Variables for Multivariate Calibration. Analytical Chemistry 1996, 68, 3851–3158.
- Zi, X.W.; He, Q.P.; Jin, W. Comparison of Variable Selection Methods for PLS-Based Soft Sensor Modeling. Journal of Process Control 2015, 26, 56–72.
- Li, H.; Liang, Y.; Xu, Q.; Cao, D. Key Wavelengths Screening Using Competitive Adaptive Reweighted Sampling Method for Multivariate Calibration. Analytica Chimica Acta 2009, 648, 77–84.
- Hui, Y.; Bang-Xing, H.; Qiong-Ying, W.; Ming-Zhu, J.; Zhong-Zheng, G. Rapid Detection of Rosa Laevigata Polysaccharide Content by Near-Infrared Spectroscopy. Spectrochimica Acta Part A: Molecular & Biomolecular Spectroscopy 2011, 79, 179–184.
- Rao, K.R.; Srinivasan, T.; Venkateswarlu, C. Mathematical and Kinetic Modeling of Biofilm Reactor Based on Ant Colony Optimization. Process Biochemistry 2010, 45, 961–972.
- Dorigo, M.; Maniezzo, V.; Colorni, A. The Ant System: Optimization by a Colony of Cooperative Agents. Physical Review Letters 1995, 75, 2686–2689.
- Chen, Q.; Hu, W.; Su, J.; Li, H.; Ouyang, Q.; Zhao, J. Nondestructively Sensing of Total Viable Count (TVC) in Chicken Using an Artificial Olfaction System Based Colorimetric Sensor Array. Journal of Food Engineering 2016, 168, 259–266.
- Pan, W.; Zhao, J.; Chen, Q.; Zhang, D. Simultaneous and Rapid Measurement of Main Compositions in Black Tea Infusion Using a Developed Spectroscopy System Combined with Multivariate Calibration. Food Analytical Methods 2015, 8, 749–757.
- Belhoul, M.; Jaouadi, N.Z.; Rekik, H.; Bejar, W.; Touioui, S.B.; Hmidi, M.; Badis, A.; Bejar, S.; Jaouadi, B. A Novel Detergent-Stable Solvent-Tolerant Serine Thiol Alkaline Protease from Streptomyces Koyangensis TN650. International Journal of Biological Macromolecules 2015, 79, 871–882.
- Chang, C.; Niu, F.; Su, Y.; Qiu, Y.; Gu, L.; Yang, Y. Characteristics and Emulsifying Properties of Acid and Acid-Heat Induced Egg White Protein. Food Hydrocolloids 2016, 54, 342–350.
- Yasumaru, F.; Lemos, D. Species Specific in Vitro Protein Digestion (pH-Stat) for Fish: Method Development and Application for Juvenile Rainbow Trout (Oncorhynchus Mykiss), Cobia (Rachycentron Canadum), and Nile Tilapia (Oreochromis Niloticus). Aquaculture 2014, 426–427, 74–84.
- Susanne Wrang, B.; Ib, S.; Susanne, J. Analysis of Protein Structures and Interactions in Complex Food by Near-Infrared Spectroscopy. 1. Gluten Powder. Journal of Agricultural & Food Chemistry 2007, 55, 7234–7243.
- Cai, W.; Li, Y.; Shao, X. A Variable Selection Method Based on Uninformative Variable Elimination for Multivariate Calibration of Near-Infrared Spectra. Chemometrics & Intelligent Laboratory Systems 2008, 90, 188–194.
- Han, Y.; Chen, J.; Pan, T.; Liu, G. Determination of Glycated Hemoglobin Using Near-Infrared Spectroscopy Combined with Equidistant Combination Partial Least Squares. Chemometrics & Intelligent Laboratory Systems 2015, 145, 84–92.
- Zheng, K.; Li, Q.; Wang, J.; Geng, J.; Cao, P.; Sui, T.; Wang, X.; Du, Y. Stability Competitive Adaptive Reweighted Sampling (SCARS) and Its Applications to Multivariate Calibration of NIR Spectra. Chemometrics & Intelligent Laboratory Systems 2012, 112, 48–54.
- Yang, G.; Wu, S.; Jin, Q.; Xu, J. A Hybrid Approach Based on Stochastic Competitive Hopfield Neural Network and Efficient Genetic Algorithm for Frequency Assignment Problem. Applied Soft Computing 2016, 39, 104–116.
- Bruun, S.W.; Søndergaard, I.; Jacobsen, S. Analysis of Protein Structures and Interactions in Complex Food by Near-Infrared Spectroscopy. 2. Hydrated Gluten. Journal of Agricultural and Food Chemistry 2007, 55, 7244–7251.
- Bo, Y.U.; Zhao-Xin, L.U. Determination of Degree of Hydrolysis of Soybean Peptides Produced by Microorganism Fermentation. Food Science 2005, 26, 104–107.