
ABSTRACT
Thirteen edible oils: sunflower, avocado, hemp, high-linolenic flax, low-linolenic flax, safflower, walnut, roasted sesame, rice, corn, rapeseed, pumpkin seed, and hazel were studied in this work. Their fatty acid composition, iodine, acidic, peroxide, and saponification values were determined. Infrared and Raman spectra of the oils were recorded in the range 400–3200 cm−1. The integral intensities of the bands at about 1655 and 2852 cm−1 corresponding to ν(C=C) and ν(CH2) vibrations were evaluated and used to construct a relationship between the spectroscopic data and the iodine value. The following linear dependencies were obtained: Iν(C=C)/Iν(CH2) = 7.449 × 10⁻⁴ × iodine value – 0.0339 and Iν(C=C)/Iν(CH2) = 9.299 × 10⁻⁴ × iodine value – 0.023 for the infrared and Raman spectra with a correlation coefficient 0.988 and 0.976, respectively. These calibration lines can be used to determine the iodine value for oils with unknown unsaturation level, and may be applied for margarines and other fatty materials.
Introduction
Infrared (IR) and Raman (RS) studies have been widely used to characterize oils and fats for years. The first articles on this topic were published in the early 1950s.[Citation1,Citation2] Several problems were solved using these spectroscopic methods. Oil authentication and genuineness was the first aim of these studies.[Citation3–Citation30] Detection of adulteration of authentic oils with cheaper oils was another important problem that was solved with the use of IR and RS spectroscopy.[Citation31–Citation60] These methods were also widely applied as an analytical tool in the fat industry for the determination of the unsaturation level of fats and oils.[Citation2,Citation61–Citation72] The total degree of unsaturation was evaluated from the quantitative measurement of the ν(C=C) band intensity and its relation to the intensity of the band related to the δ(CH2) scissoring. This was achieved by controlling the ratio of the height of the bands at about 1660 and 1445 cm−1 corresponding to the above vibrations. In another approach oxidation of unsaturated fatty acids was monitored using the change of the observed at about 3010 cm−1 ν(C=C-H) band intensity as an indicator. In such isomers the ratio of this band intensity to the intensity of the band at about 1265 cm−1 (corresponding to =C-H deformation of the unconjugated cis double bond) is correlated with the degree of unsaturation.[Citation64]
The IV is a parameter that characterizes the unsaturation level of an oil. The Fourier Transform Mid Infrared Attenuated Total Reflectance (FT-MIR/ATR) instrumentation was used by van de Voort et al.[Citation73] to determine this parameter in triglycerides. A comparison of the intensities of the bands from the ranges 2600–3200 and 1000–1600 cm−1 was proposed. A strong correlation between the iodine value (IV) and the ratio of the RS band intensities from the ranges 1620–1690 cm−1 [ν(C=C) mode] and 1420–1480 cm−1 [δ(CH2) mode] was found.[Citation62] The FT-RS technique was used by Sadeghi-Jarabchi et al.[Citation63] to determine the IV of oils and margarines on the basis of the intensities of the observed bands at about 1650 cm−1 [ν(C=C)] and 1440 cm−1 [δ(CH2)] as well as 3010 cm−1 [ν(=C-H)] and 1270 cm−1 [γ(=C-H) or ν(C-C)]. Similar methods were employed by other authors in determination of the IV on the basis of the spectroscopic data.[Citation67,Citation74] The review of these results, obtained by several spectroscopic methods, was presented by Lee et al.[Citation75]
Linear discriminant analysis (LDA) was applied a number of times to discriminate and classify various edible oils on the basis of spectral data. Yang et al.[Citation19] showed that, generally, Fourier transform infrared spectroscopy (FT-IR), Fourier transform near-infrared spectroscopy (FT-NIR), and Fourier Transform - Raman Spectroscopy (FT-RS) studies can be used to rapidly classify an oil, but the FT-IR method is the most effective for these purposes and it is followed by FT-RS method. FT-NIR spectroscopy was recognized as a less useful method than the former ones.[Citation76,Citation77] In these studies the IV was used as one of the factors analyzed in the LDA procedure. In the present work, we propose new methods of discrimination analysis based on FT-IR and FT-RS spectra measurements. The results of chemometric studies of thirteen different oils were compared and these data were related to integral intensities of selected IR and RS bands.
Materials and methods
All the studied oils were produced by Polish Oleofarm factory located in Wrocław (Poland). The IV was determined taking 0.13 g of an oil, dissolving it in 20 mL of a cyclohexane and acetic acid mixture (mixing ratio 1:1 v/v). Next, 25 mL of Wijs solution was added and the mixture was kept in dark for 1 h. Twenty milliliters of saturated solution of KI and 150 mL distilled water was added to this solution and the whole mixture was titrated with 0.1 N sodium thiosulphate in the presence of starch until the color changed from crimson-violet to bright yellow.
Determination of the acidic value (AV) was performed using the following procedure: 10 g of an oil were dissolved in 100 mL of ethanol and ethyl ether mixture (mixing ratio 1:1 v/v). This solution was titrated with KOH ethanolic solution until reaching pink-violet color. Phenolphthalein was used as an indicator.
The peroxide value (PV) was determined according to the method proposed in the PN-ISO 3960. Two grams of an oil were placed in an iodine flask and dissolved in a blended solution of 50 mL chloroform and acetic acid (mixing ratio 2:3 v/v). A saturated solution of KI (0.5 mL) was added. The mixture was intensively shaken and kept in the dark for 5 min. After the addition of 30 mL distilled water, the mixture was titrated with sodium thiosulphate (0.01 M) until the yellow color disappeared. Then, roughly 0.5 mL of starch indicator (0.05%) solution was added. The titration was carried out until the violet color changed to yellow.
The saponification value (SV) was determined by the method in which 2 g of an oil were added to 25 mL of NaOH dissolved in ethanol and heated in a water bath for 20 min. The obtained mixture was titrated with 0.5 N HCl solution in the presence of phenolphthalein up to decolorization of the mixture. The oils composition and their acid profiles were measured using the gas chromatographic gas chromatography-mass spectrometry (GC-MS) method.
FT-IR/ATR spectra were recorded in the range 300–4000 cm−1 using a Nicolet 6700 spectrometer equipped with a portable ATR set. The resolution of these measurements was 2 cm−1. FT-RS spectra were recorded in the range 80–4000 cm−1 using a Bruker RFS 110 spectrometer with a diode-pumped Nd:YAG laser emitting at 1064 nm. The spectra were accumulated from 150 scans measured with the resolution of 2 cm−1. The background correction of the spectra was performed with the use of operating OMNIC software Suite 9 v.9.5 of the spectrometer. The spectral contours were analyzed by the commercial computer program Origin 7.5. This analysis included a background subtraction and deconvolution of the experimental bands into Lorentz components. To eliminate an accidental intensity variation in the general intensity level all the integral intensities of the observed bands were standardized using the statistical R2 coefficient. For this aim, several simulations of the Lorentz deconvolution were performed using wide and variable number of components. The best fitting between the experimental and theoretical spectral course was reached when their statistical R2 values were the closest to 1.0. The PCA analysis was performed using The Unscrambler program equipped with non-linear iterative partial squares (NIPALS) algorithm and cross-validation.
Results and discussion
Chemical characterization of the studied oils
presents the chemical composition of the studied: sunflower, avocado, hemp, high-linolenic flax, low-linolenic flax, safflower, walnut, roasted sesame, rice, corn, rapeseed, pumpkin seed, hazel oils. Their fatty values are presented in .
Table 1. Chemical characterization of the studied oils.
Table 2. The fatty values determined in the present work.
IR and RS studies
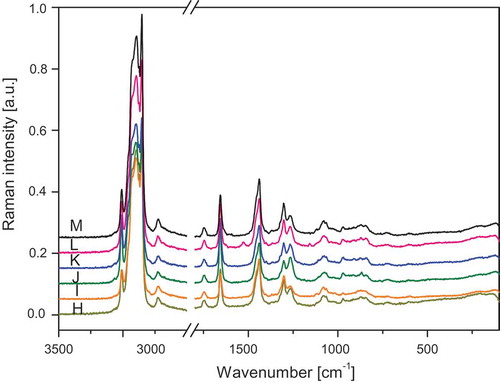
The FT-IR and FT-RS spectra of the studied oils are presented in –. lists the wavenumbers of the measured spectra of walnut oil, the spectra are representative for all the studied samples. The assignment of the bands to the respective normal modes was made using commonly accepted nomenclature.[Citation8,Citation27]
Table 3. Wavenumbers observed in the IR and Raman spectra of the walnut oil.
Table 4. The wavenumbers (ν) and integral intensity (A) of some selected bands from the IR and Raman spectra of the studied oils.
Figure 1. ATR/FT-IR spectra of oils A: Sunflower; B: Corn; C: Low-linolenic flax; D: High-linolenic flax; E: Walnut; F: Hazel; and G: Rapeseed.
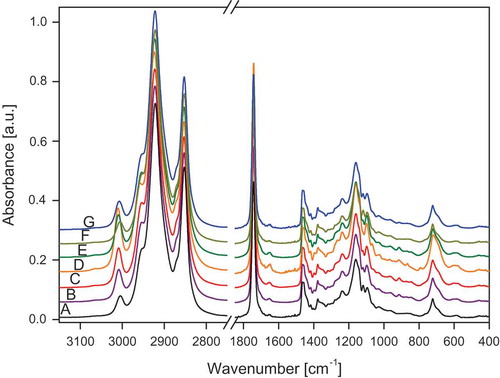
Figure 2. ATR/FT-IR spectra of oils H: Roasted sesame; I: Avocado; J: Hemp; K: Safflower; L: Pumpkin seed; M: Rice.
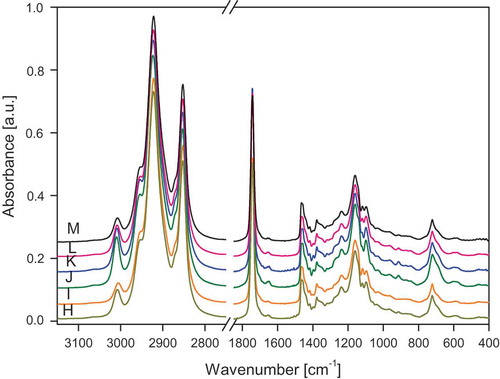
Figure 3. Raman spectra of oils A: Sunflower; B: Corn; C: Low-linolenic flax; D: High-linolenic flax; E: Walnut; F: Hazel; G: Rapeseed.
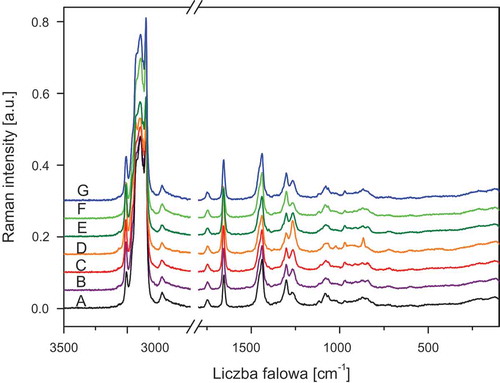
Figure 4. Raman spectra of oils H: roasted sesame; I: avocado; J: hemp; K: safflower; L: pumpkin seed; and M: rice.
Quantification of chemical and spectroscopic data
The fatty values presented in may be used to construct a relationship between the spectroscopic data and the IV. Similar correlations were proposed in earlier works but their authors used other procedures. Sinclair et al.[Citation2] discovered the existence of a linear relationship between the number of cis C=C bonds of unsaturated fatty acid methyl esters and the ratio of the 2920 cm−1 band absorbance and the difference between the absorbances of the bands at 2920 and 3020 cm−1. This result was confirmed by Chapman[Citation78] as the method allowed to determine the unsaturation degree. In a similar procedure Arnold and Hartung[Citation61] used the ratio of absorbances at 3030 and 2857 cm−1. Afran and Newbery[Citation65] in such considerations used the absorbance of the bands at 3010 and 2854 cm−1, but Muniategui et al.[Citation67] and Bernard and Sims[Citation63] evaluated the total degree of unsaturation from the absorption intensities of the bands at 3007 and 1658 cm−1.
The correlation between the IV and some IR and RS bands intensities were described by van de Voort et al.,[Citation73] Bailey and Horvat,[Citation62] as well as by Sadeghi-Jorabchi et al.[Citation3] In these considerations, the bands from the ranges 2600–3200 and 1000–1600 cm−1,[Citation73] or 1626–1691 and 1420–1478 cm−1,[Citation62] as well as 1656 and 1444 cm−1[Citation3] were taken into account. Another pair of the bands observed at 3010 and 1270 cm−1 was applied by Sadeghi-Jorabchi et al.[Citation64] and Baeten et al.[Citation74] for determination of the IV. All these were complicated, time consuming, and giving great dispersion of the results. In our work, we propose a faster and simpler procedure in which commonly used and easily accessible computer programs are employed.
The comparison of the obtained in the present work FT-IR/ATR and FT-RS spectra of 13 edible oils shows that the most characteristic bands for these samples are those at about 1650 and 2850 cm−1 corresponding for ν(C=C) and ν(CH2) vibrations, respectively. Choosing these vibrations allowed to construct a plot of integral intensities of ν(C=C) / ν(CH2) bands versus the IV. Instead of the earlier proposed methods we developed a three step procedure. In the first step, the IR and RS spectral contours observed in the ranges 1500–1750 and 2800–3010 cm−1 were deconvoluted into Lorentz components using the Origin 7.5. In the second step, the integral intensities of the Lorentz contours at about 1650 and 2850 cm−1 were used to calculate the ratio Iν(C=C)/Iν(CH2). Finally, the relationship between this ratio and the IV was drawn. The plots obtained for 13 oils studied in the present work are shown in and .
Figure 5. The relationship between the iodine value and integral intensity ratio of IR bands at about 1655/2852 cm−1 of oils: A: hazel; B: sunflower; C: avocado; D: rice; E: rapeseed; F: roasted sesame; G: pumpkin seed; H: corn; I: walnut; J: safflower; K: hemp; L: low-linolenic flax; and M: high-linolenic flax.
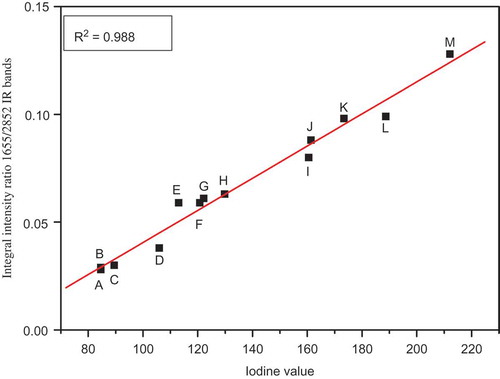
Figure 6. The relationship between the iodine value and integral intensity ratio of Raman bands at about 1655/2850 cm−1 of oils: A: hazel; B: sunflower; C: avocado; D: rice; E: rapeseed; F: roasted sesame; G: pumpkin seed; H: corn; I: walnut; J: safflower; K: hemp; L: low-linolenic flax; and M: high-linolenic flax.
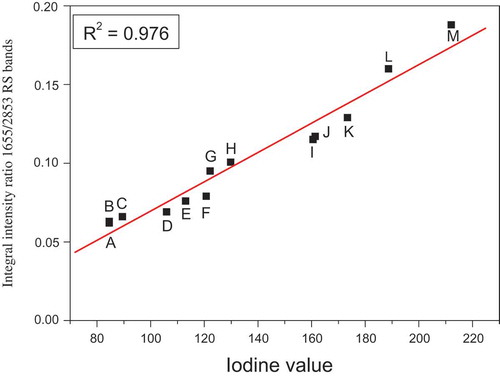
For the relationships derived from the IR and RS studies the straight lines with the equations Iν(C=C)/Iν(CH2) = 7.449 × 10⁻⁴ × IV – 0.0339 and Iν(C=C)/Iν(CH2) = 9.299 × 10⁻⁴ × IV – 0.023 were obtained, respectively. The correlation coefficients for these relations were 0.988 and 0.976, respectively, showing a very good accordance. These calibration lines could be used to determine the IV for oils with unknown unsaturation level, and may be applied for margarines and other fatty materials. The dependences between the IV values and the IR and RS bands integral intensity ratios were approximated by straight lines drawn using Origin 7.5.
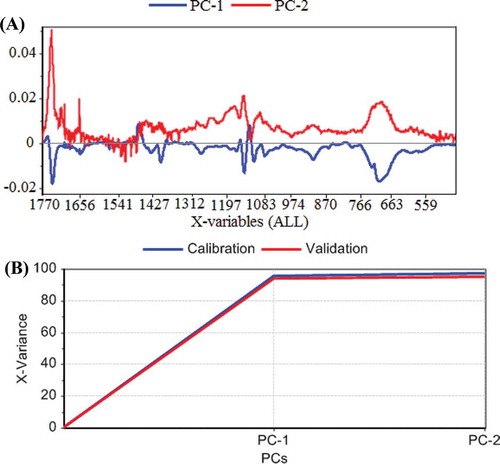
Both IR and RS spectra were analyzed using PCA in order to visualize the main trends in the data. The spectra were first- and second-order differentiated before the principal components (PCs) analysis. The first and second derivatives of the IR spectra are shown in . The PLS regression was calibrated with the calibration sample set and the validation was obtained by full cross-validation. The optimum number of PCs used in the calibration model was checked by residual variance plot against the PCs, which proves how the variation in the spectra is described by different components. The explained variance PC 1 is c.a. 94% and PC 2 is 3% (). It means that the pair of the bands observed at 1650 and 2950 cm−1, chosen among other considered pairs of bands, gives the best fitting to the IV values of the studied oils. They were properly chosen and they differentiate the oils in regard to the IV determination.
Figure 7. The results of the PCA analysis. A: Loading from the first (PC-1) and second (PC-2) principal components of ATR-FTIR obtained for the studied oils; B: Explained variance from the PCs model.
Conclusion
A new method of the IVs determination for edible oils has been proposed in the present work. Unlike other procedures shown in earlier articles it applies the intensity ratios of IR and RS bands observed at about 1650 and 2850 cm−1 corresponding to the ν(C=C) and ν(CH2) vibrations, respectively. The good correlation between this spectral parameter and the IV allowed to construct a relationship between the spectroscopic and chemometric data of the oils. The use of this characteristic pair of bands for this purposes was not proposed earlier. Moreover, a new theoretical approach to analysis of the results has been proposed. It uses the procedure of the computer deconvolution of spectral contours into Lorentz components, evaluation of the integral intensities of the bands, and finding the correlation between the IV and the ratio of respective band intensities.
Funding
The present work was supported partly by Embassy of Libya under the doctor stipend for Abduladhim Moamer M. Albegar and by Polish Ministry of Science and Education under the statutory investigations in the Department of Bioorganic Chemistry, Institute of Chemistry and Food Technology, Wrocław University of Economics.
Additional information
Funding
Related Research Data
References
- Bartlet, J.G.; Mahon, J.H. Identification of Oils and the Detection of Oil Adulteration by Differential Infrared Spectroscopy. Journal of the American Chemical Society 1958, 41(2), 450–459.
- Sinclair, R.G.; Mackay, A.F.; Myers, G.S.; Jones, R.N. The Infrared Absorption Spectra of Unsaturated Fatty Acids and Esters. Journal of the American Chemical Society 1952, 74, 2578–2585.
- Sadeghi-Jorabchi, H.; Hendra, P.J.; Wilson, R.H.; Belton, P. Determination of the Total Unsatufration in Oilos and Margarines by Fourier Transform Raman Spectroscopy. Journal of the American Oil Chemists’ Society 1990, 67, 483–486.
- Safar, M.; Bertrand, D.; Robert, P.; Devaux, M.F.; Genot, C. Characterization of Edible Oils, Butters and Margarines by Fourier Transform Infrared Spectroscopy with Attenuated Total Reflectance. Journal of the American Oil Chemists’ Society 1994, 71, 371–377.
- Lai, Y.W.; Kemsley, E.K.; Wilson, R.H. Potential of Fourier Transform Infrared Spectroscopy for the Authentication of Vegetable Oils. Journal of Agricultural and Food Chemistry 1994, 42, 1154–1159.
- Baeten, V.; Meurens, M.; Morales, M.T.; Aparicio, R. Detection of Virgin Olive Oil Adulteration by Fourier Transform Raman Spectroscopy. Journal of Agricultural and Food Chemistry 1996, 44, 2225–2230.
- Dupuy, N.; Duponchel, L.; Huvenne, J.P.; Sombret, B.; Legrand, P. Quantitative Determination of Polymer and Mineral Content in Paper Coatings by Infrared Spectroscopy. Improvements by Non-Linear Treatments. Food Chemistry 1996, 57, 245–251.
- Guillen, M.D.; Cabo, N. Characterization of Edible Oils and Lard by Fourier Transform Infrared Spectroscopy. Relationships Between Composition and Frequency of Concrete Bands in the Fingerprint Region. Journal of the American Oil Chemists’ Society 1997, 74, 1281–1286.
- Guillén, M.D.; Cabo, N. Relationships Between the Composition of Edible Oils and Lard and the Ratio of the Absorbance of Specific Bands of Their Fourier Transform Infrared Spectra. Role of Some Bands of the Fingerprint Region. Journal of Agricultural and Food Chemistry 1998, 46, 1788–1793.
- Marigheto, N.A.; Kemsley, E.K.; Defernez, M.; Wilson, R.H. A Comparison of Mid-Infrared and Raman Spectroscopies for the Authentication of Edible Oils. Journal of the American Oil Chemists’ Society 1998, 75, 987–992.
- Baeten, V.; Aparicio, R. Edible Oils and Fats Authentication by Fourier Transform Raman Spectrometry. Biotechnology Agronomy Society and Environment 2000, 4, 196–203.
- Davis, A.N.; McIntyre, P.; Morgan, E.D. Study of the Use of Molecular Spectroscopy for the Authentication of Extra Virgin Olive Oils. Part I: Fourier Transform Raman Spectroscopy. Applied Spectroscopy 2000, 54, 1864–1867.
- Barthus, R.C.; Poppi, R.J. Determination of the Total Unsaturation in Vegetable Oils by Fourier Transform Raman Spectroscopy and Multivariate Calibration. Vibrational Spectroscopy 2001, 26, 99–105.
- Tay, A.; Singh, R.K.; Krishnan, S.S.; Core, J.P. Authentication of Olive Oil Adulterated with Vegetable Oils Using Fourier Transform Infrared Spectroscopy. LWT–Food Science and Technology 2002, 35, 99–103.
- Tapp, H.S.; Defernez, M.; Kemsley, E.K. FTIR Spectroscopy and Multivariate Analysis Can Distinguish the Geographic Origin of Extra Virgin Olive Oils. Journal of Agricultural and Food Chemistry 2003, 51, 6110–6115.
- Rusak, D.A.; Brown, L.M.; Martin, S.D. Classification of Vegetable Oils by Principal Component Analysis of FTIR Spectra. Journal of Chemical Education 2003, 80, 541–543.
- Schulz, H.; Baranska, M.; Belz, H.-H.; Rösch, P.; Strehle, M.A.; Poll, J. Chemotaxonomic Characterisation of Essential Oil Plants by Vibrational Spectroscopy Measurements. Vibrational Spectroscopy 2005, 35, 81–86.
- Strehle, M.A.; Rösch, P.; Baranska, M.; Schulz, H.; Popp, J. On the Way to a Quality Control of the Essential Oil of Fennel by Means of Raman Spectroscopy. Biopolymers 2005, 77, 44–52.
- Yang, H.; Irudayraj, J.; Paradkar, M.M. Discriminant Analysis of Edible Oils and Fats by FTIR, FT-NIR and FT-Raman Spectroscopy. Food Chemistry 2005, 93, 25–32.
- Schulz, H.; Ōzkan, G.; Baranska, M.; Krüger, H.; Ozcan, M. Characterisation of Essential Oil Plants from Turkey by IR and Raman Spectroscopy. Vibrational Spectroscopy 2005, 39, 249–256.
- Baeten, V.; Pierna, J.A.F.; Dardenne, P.; Meurens, M.; Garciäa-Gonzaälez, D.L.; Aparicio-Ruiz, R. Detection of the Presence of Hazelnut Oil in Olive Oil by FT-Raman and FT-MIR Spectroscopy. Journal of Agricultural and Food Chemistry 2005, 53, 6201–6206.
- Vlachos, N.; Skopelitis, Y.; Psaroudaki, M.; Konstantinidou, V.; Chatsilazarou, A.; Tegou, E. Applications of Fourier Transform-Infrared Spectroscopy to Edible Oils. Analytica Chimica Acta 2006, 573–574, 459–465.
- Strehle, K.R.; Rösch, P.; Berg, D.; Schulz, H.; Popp, J. Quality Control of Commercially Available Essential Oils by Means of Raman Spectroscopy. Journal of Agricultural and Food Chemistry 2006, 54, 7020–7026.
- Bendini, A.; Cerretani, L.; Di Virgilio, A.; Belloni, P.; Bonoli-Carbognin, M.; Lercker, G. Preliminary Evaluation of the Application of the FTIR Spectroscopy to Control the Geographic Origin and Quality of Virgin Olive Oils. Journal of Food Quality 2007, 30, 424–437.
- Sinelli, N.; Cosio, M.S.; Gigliotti, C.; Casiraghi, E. Preliminary Study on Application of Mid Infrared Spectroscopy for the Evaluation of the Virgin Olive Oil “Freshness.” Analytica Chimica Acta 2007, 598, 128–134.
- El-Abassy, R.M.; Donfack, P.; Materny, A. Visible Raman Spectroscopy for the Discrimination of Olive Oils from Different Vegetable Oils and the Detection of Adulteration. Journal of Raman Spectroscopy 2009, 40, 1284–1289.
- Lerma-Garcia, M.J.; Ramis-Ramos, G.; Herrero-Martinez, J.M.; Simo-Alfonso, E.F. Authentication of Extra Virgin Olive Oils by Fourier-Transform Infrared Spectroscopy. Food Chemistry 2010, 118, 78–83.
- Samyn, P.; Van Niuwkerke, D.; Schoukens, G.; Vonck, L.; Stanssens, D.; Van den Aabbeele, H. Quality and Statistical Classification of Brazilian Vegetable Oils Using Mid-Infrared and Raman Spectroscopy. Applied Spectroscopy 2012, 66, 552–562.
- Siddiqui, N.; Ahmad, A. Infrared Spectroscopic Studies on Edible and Medicinal Oils. International Journal of Science, Environment and Technology 2013, 2, 1297–1306.
- Jentzsch, P.V.; Ciobota, V. Raman Spectroscopy As An Analytical Tool for Analysis of Vegetable and Essential Oils. Flavour and Fragrance Journal 2014, 29, 287–295.
- Rohman, A.; Windarsih, A.; Riyanto, S.; Sudjadi; Ahmad, A.S.; Rosman, A.S.; Yusoff, F.M. Fourier Transform Infrared Spectroscopy Combined with Multivariate Calibrations for the Authentication of Avocado Oil. International Journal of Food Properties 2016, 19, 680–687.
- Lai, Y.W.; Kemsley, E.K.; Wilson, R.H. Quantitative Analysis of Potential Adulterants of Extra Virgin Olive Oil Using Infrared Spectroscopy. Food Chemistry 1995, 53, 95–98.
- Wesley, I.J.; Pacheco, F.; McGill, A.E.J. Identification of Adulterants in Olive Oils. Journal of the American Chemical Society 1996, 73, 515–518.
- Yang, H.; Irudayaraj, J. Comparison of Near-Infrared, Fourier Transform-Infrared, and Fourier Transform-Raman Methods for Determining Olive Pomace Oil Adulteration in Extra Virgin Olive Oil. Journal of the American Oil Chemists’ Society 2001, 78, 889–895.
- Che Man, Y.B.; Marina, A.M.; Rohman, A.; Al-Kahtani, H.A.; Norazura, O. A Fourier Transform Infrared Spectroscopy Method for Analysis of Palm Oil Adulterated with Lard in Pre-Fried French Fries. International Journal of Food Properties 2014, 17, 354–362.
- Ozen, B.; Maurer, L. Detection of Hazelnut Oil Adulteration Using FT-IR Spectroscopy. Journal of Agricultural and Food Chemistry 2002, 50, 3898–3901.
- Lopez-Diez, E.C.; Bianchi, G.; Goodacre, R. Rapid Quantitative Assessment of the Adulteration of Virgin Olive Oils with Hazelnut Oils Using Raman Spectroscopy and Chemometrics. Journal of Agricultural and Food Chemistry 2003, 51, 6145–6150.
- Ozen, B.F.; Weiss, I.; Mauer, L. Dietary Supplement Oil Classification and Detection of Adulteration Using Fourier Transform Infrared Spectroscopy. Journal of Agricultural and Food Chemistry 2003, 51, 5871–5876.
- Christy, A.A.; Kasemsumran, S.; Du, Y.; Ozaki, Y. The Detection and Quantification of Adulteration in Olive Oil by Near-Infrared Spectroscopy and Chemometrics. Analytical Sciences 2004, 20, 935–940.
- Baeten, V.; Pierna, F.J.A.; Dardenne, P.; Meurens, M.; Garciäa-Gonzaälez, D.L.; Aparicio-Ruiz, R. Detection of the Presence of Hazelnut Oil in Olive Oil by FT-Raman and FT-MIR Spectroscopy. Journal of Agricultural and Food Chemistry 2005, 53, 6201–6206.
- Kasemsumran, S.; Kang, N.; Christy, A.; Ozaki, Y. Partial Least Squares Processing of Near-Infrared Spectra for Discrimination and Quantification of Adulterated Olive Oils. Spectroscopy Letters 2005, 38, 839–851.
- Fragaki, G.; Spyros, A.; Siragakis, G.; Salivaras, E.; Dais, P. Detection of Extra Virgin Olive Oil Adulteration with Lampante Olive Oil and Refined Olive Oil Using Nuclear Magnetic Resonance Spectroscopy and Multivariate Statistical Analysis. Journal of Agricultural and Food Chemistry 2005, 53, 2810–2816.
- Wang, L.; Lee, F.S.C.; Wang, X.; He, Y. Feasibility Study of Quantifying and Discriminating Soybean Oil Adulteration in Camellia Oils by Attenuated Total Reflectance MIR and Fiber Optic Diffuse Reflectance NIR. Food Chemistry 2006, 95, 529–526.
- Manaf, M.A.; Che Man, Y.B.; Hamid, N.S.A.; Ismail, A.; Abidin, S.Z. Analysis of Adulteration of Virgin Coconut Oil by Palm Kernel Olein Using Fourier Transform Infrared Spectroscopy. Journal of Food Lipids 2007, 14, 111–121.
- Allam, M.; Hamed, S.F. Application of FTIR Spectroscopy in the Assessment of Olive Oil Adulteration. Journal of Applied Sciences Research 2007, 3, 102–108.
- Groselj, M.; Vracko, M.M.; Pierna, J.A.F.; Baeten, V.; Novic, M. The Use of FT-MIR Spectroscopy and Counter-Propagation Artificial Neural Networks for Tracing the Adulteration of Olive Oil. Acta Chimica Slovenica 2008, 55, 935–941.
- Gurdeniz, G.; Ozen, B. Detection of Adulteration of Extra-Virgin Olive Oil by Chemometric Analysis of Mid-Infrared Spectral Data. Food Chemistry 2009, 116, 519–525.
- Obeidad, S.M.; Khanfar, M.S.; Obeidad, W.M. Classification of Edible Oils and Uncovering Adulteration of Virgin Olive Oil Using FTIR with the Aid of Chemometrics. Australian Journal of Basic and Applied Sciences 2009, 3, 2048–2053.
- Alexa, E.; Dragomirescu, A.; Pop, G.; Lianu, C.; Dragos, D. The Use of FT-IR Spectroscopy in the Identification of Vegetable Oils Adulteration. Journal of Food, Agriculture and Environment 2009, 7, 20–24.
- Gergen, I. Metode Spectroscopice de Investigare Si Control a Compozitiei Alimentelor. Editura Agroprint, Timisoara (Spectroscopic methods of investigation and control of food composition) 2009, 113–119.
- El-Abassy, R.M.; Donfack, P.; Materny, A. Visible Raman Spectroscopy for the Discrimination of Olive Oils from Different Vegetable Oils and the Detection of Adulteration. Journal of Raman Spectroscopy 2009, 40, 1284–1289.
- Rohman, A.; Man, Y.B.C. Fourier Transform Infrared (FTIR) Spectroscopy for Analysis of Extra Virgin Olive Oil Adulterated with Palm Oil. Food Research International 2010, 43, 886–892.
- Maggio, R.M.; Cerretani, L.; Chiavaro, E.; Kaufman, T.S.; Bendibi, A. A Novel Chemometric Strategy for the Estimation of Extra Virgin Olive Oil Adulteration with Edible Oils. Food Control 2010, 21, 890–895.
- Poiana, M.-A.; Mousdis, G.; Ersilia, A.; Moigradean, D.; Nwgrea, M.; Mateescu, C. Application of FT-IR Spectroscopy to Assess the Oil Adulteration. Journal of Agroalimentary Processes and Technologies 2012, 18, 277–282.
- Rohman, A.; Che Man, Y.B.; Nurrulhidayah, A.F. Fourier-Transform Infrared Spectra Combined with Chemometrics and Fatty Acid Composition for Analysis of Pumpkin Seed Oil Blended Into Olive Oil. International Journal of Food Properties 2015, 18, 1086–1096.
- Oussama, A.; Elabadi, F.; Platinakov, S.; Kzaiber, F.; Tauler, R. Detection of Olive Oil Adulteration Using FT-IR Spectroscopy and PLS with Variable Importance of Projection (VIP) Scores. Journal of the American Oil Chemists’ Society 2012, 89, 1807–1812.
- Liang, P.; Wang, H.; Chen, C.; Ge, F.; Liu, D.; Li, S.; Han, B.; Xiong, X.; Zhao, S. The Use of Fourier Transform Infrared Spectroscopy for Quantification of Adulteration in Virgin Walnut Oil. Journal of Spectroscopy 2013, ID 305604, 1–6.
- Pandurangan, M.K.; Murugesan, S.; Gajivaradhan, P. Application of FTIR Spectroscopy to Assess the Groundnut Oil Adulteration. Journal of Chemical and Pharmaceutical Research 2014, 6, 553–560.
- Sheibani, A.; Ghotbaddini-Bahraman, N.; Sadeghi, F. FT-IR Application for the Detection of Pistachio Oil Adulteration. Oriental Journal of Chemistry 2014, 30, 1205–1209.
- Poiana, M.-A.; Alexa, E.; Mounteanu, M.-F.; Gligor, R.; Moigradean, D.; Mateescu, C. Use of ATR-FTIR Spectroscopy to Detect the Changes in Extra Virgin Olive Oil by Adulteration with Soybean Oil and High Temperature Heat Treatment. Open Chemistry 2015, 13, 689–698.
- Arnold, R.G.; Hartung, T.E. Infrared Spectroscopic Determination of Degree of Unsaturation of Fats and Oil. Journal of Food Science 1971, 36, 166–168.
- Bailey, G.F.; Horvat, R.J. Raman Spectroscopic Analysis of the Cis/Trans Isomer Composition of Edible Vegetable Oils. Journal of the American Oil Chemists’ Society 1972, 49, 494–498.
- Bernard, J.L.; Sims, L.G. IR Spectroscopy for Determination of Total Unsaturation. Industrial Research and Development 1980, 22, 81–83.
- Sadeghi-Jorabchi, H.; Wilson, R.H.; Belton, P.S.; Edwards-Webb, J.D.; Coxon, D.T. Quantitative Analysis of Oils and Fats by Fourier Transform Raman Spectroscopy. Spectrochimica Acta A 1991, 47A, 1449–1458.
- Afran, A.; Newbery, J.E. Analysis of the Degree of Unsaturation in Edible Oils by Fourier Transform-Infrared/Attenuated Total Reflectance. Spectroscopy 1991, 6, 31–34.
- Ulberth, F.; Haider, H.J. Determination of Low Level Trans Unsaturation in Fats by Fourier Transform Infrared Spectroscopy. Journal of Food Science 1992, 57, 1444–1447.
- Muniategui, S.; Paseiro, P.; Simal, J. Measurement of the Degree of Unsaturation of Oils and Fats Using Infra-Red Spectroscopy and Its Relationship with Iodine Value. Grasas y Aceites 1992, 43, 1–5.
- Li-Chan, E.C.Y. The applications of Raman Spectroscopy in Food Science. Trends in Food Science and Technology 1996, 7, 361–370.
- Kinder, R.; Ziegler, C.; Wessels, J.M. γ-Irradiation and UV-C Light-Induced Lipid Peroxidation: A Fourier Transform-Infrared Absorption Spectroscopic Study. International Journal of Radiation Biology 1997, 71, 561–571.
- Yoshida, S.; Yoshida, H. Nondestructive Analyses of Unsaturated Fatty Acid Species in Dietary Oils by Attenuated Total Reflectance with Fourier Transform IR Spectroscopy. Biopolymers (Biospectroscopy) 2003, 70, 604–613.
- Christy, A.A., Egeberg, P.K. Quantitative Determination of Saturated and Unsaturated Fatty Acids in Edible Oils by Infrared Spectroscopy and Chemometrics. Chemometrics and Intelligent Laboratory Sysytems 2006, 82, 130–136.
- Silveira, F.L.; Silveira, L.; Villaverde, A.B.; Pacheco, M.T.T.; Pasqualucci, C.A. Use of Dispersive Raman Spectroscopy in the Determination of Unsaturated Fat in Commercial Edible Oil- and Fat-Containing Industrialized Foods. Instrumentation Science and Technology 2010, 38, 107–123.
- Van der Voort, F.R.; Sedman, J.; Emo, G.; Ismail, A.A. Rapid and Direct Lodine Value and Saponification Number Determination of Fats and Oils by Attenuated Total Reflectance/Fourier Transform Infrared Spectroscopy. Journal of the American Oil Chemists’ Society 1992, 69, 1118–1123.
- Baeten, V.; Hourant, P.; Morales, M.T.; Aparicio, R. Oil and Fat Classification by FT-Raman Spectroscopy. Journal of Agricultural and Food Chemistry 1998, 46, 2638–2646.
- Li, H.; Van de Voort, F.R.; Ismail, A.A.; Sedman, J.; Cox, R.; Simard, C. Discrimination of Edible Oil Products and Quantitative Determination of Their Iodine Value by Fourier Transform Near-Infrared Spectroscopy. Journal of the American Oil Chemists’ Society 2000, 77, 29–36.
- Yuan, J.-J.; Wang, Ch.-Z.; Chen, H.-X.; Ye, J.-Z.; Zhou, H. Identification and Detection of Adulterated Camellia Oleifera Abel. Oils by Near Infrared Transmittance Spectroscopy. International Journal of Food Properties 2016, 19, 300–313.
- Baeten, V.; Aparicio, R.; Marigheto, N.; Wilson, R. Olive Oil Analysis by Infrared and Raman Spectroscopy: Methodologies and Applications. In Handbook of Olive Oil; Harwood; et al.; Ed.; Springer Science Business Media: New York, NY, 2000.
- Chapman, D. Infrared Spectroscopy of Lipids. Journal of the American Oil Chemists’ Society 1965, 42, 353–371.