
ABSTRACT
Aspergillus flavus detection and the removal of contaminated pistachio are critically important. In this work, an impedimetric electrochemical DNA sensor using gold nanoparticles on the glassy carbon electrode was developed for the sensitive detection of the aflD gene of A. flavus. This biosensor had a linear range of the detection, which was from 1 nM to 10 µM with the detection limit of 0.55 nM, while the best time for hybridization was 4 hr. Results for the detection and reproducibility of the synthetic 21-nucleotide target and the target 76-nucleotide polymerase chain reaction product were the same due to the sensitivity of measurement. In addition, this biosensor can be used to enumerate A. flavus up to 2.5 × 10⁸ spores/mL.
Introduction
The mycotoxigenic molds like Aspergillus are the major food safety concerns and have a very important role in the food spoilage and the reduction of the food quality offered in the market.[Citation1,Citation2] Aspergillus flavus is associated with some diseases, in addition, it is one of the main aflatoxin producers.[Citation3] aflD is one of the structural genes of aflatoxin gene cluster in A. flavus and other Aspergillus spp. The existence of aflD could be associated with aflatoxin production[Citation4] and indicates that this gene has potential to be as a marker.[Citation5]
Development of the food productions increases the risk of the food contamination with the microbial or chemical agents. On the other hand, it forces the food industries and related organizations to use the fast, cheap, and accurate methods of analysis for the safety and health of consumers and it also supports the global trade procedures by identifying and confining the trade in the contaminated products.[Citation6]
Although several methods have been developed to detect this microorganism, an effective strategy for presenting this toxigenic fungus has not been shown yet.[Citation1] DNA biosensors have extremely potential functions, especially for the food analyses as an emerging and developed application.[Citation6,Citation7] In comparison to other methods, the electrochemical sensors due to their sensitivity, simplicity, repeatability, portability, and compatibility with the microfabrication technologies are the widely accepted detection platforms for DNA analyses.[Citation7–Citation9] Electrochemical Impedance Spectroscopy (EIS) is a label-free DNA detection technique, which does not need biomolecules changes with the labels, such as fluorophore, magnetic beads or an enzyme.[Citation10] There are many articles on the application of the EIS based on DNA probes immobilization, which recognizes the complementary ssDNA target via the hybridization. These techniques measure the impedance amount of the electrode surface over a range of frequencies.[Citation11–Citation14] As it has been said about this technique, with the impedance data a complete description of an electrochemical system is possible.[Citation15]
Gold nanoparticles (AuNPs) are used in the structure of the EIS sensors.[Citation16] The EIS is affected by the changes in the interfacial electron transfer and AuNPs can intercede this electron transfer across the self-made monolayer on the surface of the electrode.[Citation8] On the other area, AuNPs could enhance the electrode surface area, and increase the amount of immobilization and availability of DNA probe.[Citation17,Citation18] Due to the strong correlation between sulfur and gold atoms, the SH—Au linkages are used for covalent coupling of biomolecules on the surface of the AuNPs.[Citation7,Citation19]
This article has focused on the detection of aflD gene by EIS. As shown in , the glassy carbon electrode (GCE) was coated with AuNP that was nominated (AuNP—GCE). A specific ssDNA probe of aflD gene was immobilized by forming a thiol via SH2 moiety at the 5ʹ-terminus of the DNA probe on the AuNP–GCE. In the absence of the DNA target, the flexible ssDNA probe supports efficient contacts between the [Fe(CN)6]3−/4− reducer and AuNP—GCE, there was a low electron transfer resistance (Ret) of the electrochemical DNA sensor. After the hybridization, a rigid probe-target duplex was formed which contact between the [Fe(CN)6]3−/4− reducer and AuNP—GCE was prevented. This led to an increasing in the Ret of the electrochemical DNA sensor. The fabrication and performance of the DNA sensor and its application in the analysis of the real samples are discussed in this study. A standard A. flavus and also a sample of the infected pistachio with A. flavus were examined for analyzing of the real samples. In the current research, a DNA biosensor was developed for sensitive detection of aflatoxin producing gene of A. flavus in pistachio and its efficacy was evaluated.
Scheme 1. The glassy carbon electrode was coated with AuNPs (AuNP—GCE). A specific ssDNA probe of aflD gene was immobilized on AuNP–GCE. In the absence of the target DNA, the flexible ssDNA probe supports efficient contact between the [Fe(CN)6]3−/4− reducer and AuNP—GCE, there is a low electron transfer resistance (Ret) of the electrochemical DNA sensor. After the hybridization, a rigid probe-target duplex is formed which contact between the [Fe(CN)6]3−/4− reducer and AuNP—GCE was prevented. This leads to an increasing in the Ret of the electrochemical DNA sensor.
![Scheme 1. The glassy carbon electrode was coated with AuNPs (AuNP—GCE). A specific ssDNA probe of aflD gene was immobilized on AuNP–GCE. In the absence of the target DNA, the flexible ssDNA probe supports efficient contact between the [Fe(CN)6]3−/4− reducer and AuNP—GCE, there is a low electron transfer resistance (Ret) of the electrochemical DNA sensor. After the hybridization, a rigid probe-target duplex is formed which contact between the [Fe(CN)6]3−/4− reducer and AuNP—GCE was prevented. This leads to an increasing in the Ret of the electrochemical DNA sensor.](/cms/asset/0a3ac7f5-19a9-4232-9fe3-c4f07638532e/ljfp_a_1291675_sch0001_oc.jpg)
Materials and methods
Fungal strain and media
The strain A. flavus PTCC 5004 (IR 111)[Citation20] was obtained from Iranian Research Organization for Science and Technology (IROST, Iran). This strain has aflatoxin biosynthesis gene and produces 270 µg/kg aflatoxin B1 in pistachio nuts. Potato Dextrose Agar (PDA) (Merck) was used for the cultivation and sporulation of this strain at 25°C in the dark. When the cultures were entirely sporulated (After 10 days of incubation), the spores were harvested by adding 10 mL of sterile pure water containing 0.1% (v/v) tween 80 (Merck) and gently rubbing the culture with a sterile bent glass rod (3 times). The suspension was collected and centrifuged at 3000 rpm/min for 5 min at the room temperature. This action was repeated several times until 2 mL of very concentrated spore solution residues were obtained. The Thoma hemocytometer slide was used to enumerate the spore numbers. These spores were kept frozen in 50% glycerol at—20°C.[Citation3,Citation21,Citation22]
Pistachio contamination
Fifty grams of pistachio flour (Pistacia vera) were transferred into tow flasks, and mixed with 20 ml of H2O and sterilized at 121°C for 15 min. The first flask of pistachio flour was inoculated with 1 × 10⁷ spores/mL of A. flavus PTCC 5004 and the second flask was used as the non-inoculated control. The flasks were incubated at 25°C in the dark. DNA extraction and polymerase chain reaction (PCR) amplification were carried out after 7 days.[Citation21]
Total DNA extraction and PCR amplification
DNA was isolated from A. flavus PTCC 5004 and contaminated pistachio by using a DNA extraction kit (MBK0011, IBRC, Iran). PCR amplification of the 76-mer antisense strands of the aflD gene was carried out with a 20-mer forward primer and a 20-mer reverse primer (). The primers were designed internally for the PCR amplicon fragment, and its specificity was preliminarily assessed by following the BLAST database (http://www.ncbi.nlm.nih.gov/BLAST/) and their secondary structures were examined with Gene Runner (version 3.05, Hastings Soft-ware, USA). The reaction solution (50 µL) contained dNTPs (0.2 mM each), PCR Buffer 1X- MgCl2 2 mM, DNA template (20 ng), forward and reverse primer (0.4 uM for each one), and Taq DNA polymerase (1U; TaKaRa Hot Start Version). PCR conditions: 95°C for 4 min, followed by 35 cycles of 95°C for 10 s, 58°C for 20 s, and 72°C for 10 s, and then 72°C for 5 min for final extension. 76-mer PCR product: 5ꞌ-GGGGCACTTCGTTATCCACACGGATGGATCTCAACTCCCCTGGTAG GACGCTAGTAACGACGAAGCGCAGTCATAT-3ꞌ. After PCR amplification, the PCR product was purified by using the purification kit (MBK0071, IBRC, Iran). To detect PCR product, the electrophoresis by using gel agarose 2% was performed at 160 V for 1 h.
Table 1. DNA probe, target, and primers.
Synthesis of AuNPs on glassy carbon electrode
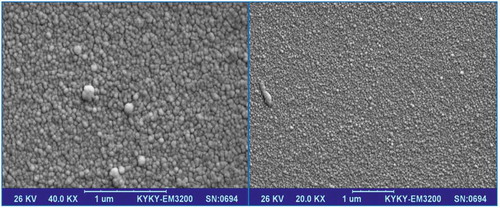
The surface of the GCE was polished by 0.5 µm alumina slush and cleaned by double-distilled water. The electrode was electrochemically cleansed in 1 M H2SO4 trough potential scanning range −0.2 V and 1.6 V up to a repeatable cyclic voltammogram was acquired. The gold nanoparticles (AuNPs) were generated on the surface of the electrode by the electrodeposition process via the potential cyclic scanning of the working electrode among −0.20 and +1.6 V at a scan rate of 50 mV/s for 10 cycles. A 0.1 M NaNO3 aqua solution consisting 0.25 mM HAuCl4 · 3H2O and 0.01 M H2SO4 was utilized for the gold particles electrodeposition on the electrode surface. These characteristics were optimized in the previous investigation.[Citation7] The AuNP–GCE surface characterization was obtained via the scanning electron microscopy (SEM) by a KYKY—EM—3200 microscope with an accelerating voltage of 26 KV.[Citation19,Citation23,Citation24]
DNA probe immobilization and hybridization
DNA probe that has used in this study had 21 nucleotide sequences and it was used by Scherm and colleagues (2005) as the reverse primer in the technique of RT—PCR to detect aflD gene transcripts.[Citation6] The oligonucleotide sequences for the probe, the target, and the primers are shown in . The single-stranded probe DNA was terminated with a thiol group. All solutions of DNA were stocked with 0.1 M phosphate buffer solution (PBS buffer) pH 7.4. The oligonucleotide stock solutions (100.0 μM) were prepared in 0.1 M PBS buffer, pH 7.4 and maintained in frozen at −20°C.
The effective parameters such as the incubation time of DNA probe, the concentration of DNA probe, and the hybridization time were optimized in order to obtain the best condition for the experiments. Previously in similar studies, the incubation time of mercaptohexanol (MCH) had been optimized.[Citation7,Citation25] DNA probe was manufactured by adding 8 µl of probe solution (10 µM) to the surface of the AuNP—GCE and the electrode left for 2 h before addition of blocking agent. The SH2 residue at the probe linked with the AuNPs, and consequently, the probe connected covalently on the AuNP—GCE surface.[Citation8] Then 8 µL of 6- MCH solution (6-mercaptohexanol and HAuCl4.3H2O were bought from Sigma-Aldrich Co. and double distilled water was used for all dilution) was added on the AuNP—GCE for 1 h as a blocking agent. MCH washed unsuitable adsorbed DNA from the electrode surface and cleaned nonspecific situations on the DNA monolayer.[Citation7]
Two types of the target DNA were used for the hybridization: the first one was a synthetic complementary 21 nucleotides DNA and the other one was the PCR products of 76 nucleotides DNA and in the control experiment, a random 76-mer sequence was used. The four samples of the PCR products included A. flavus (af), the contaminated pistachio with A. flavus (bf), and the non-contaminated pistachio as a control (cf) were used.
8 µl of the target DNA solution was added to the electrode surface in a sealed humidity chamber for the hybridization and kept at the room temperature for 4 h, then the sensor was washed with PBS buffer to remove the unhybridized DNA. Before the hybridization, the target DNA solution was heated at 95°C for 5 min and was transferred immediately into the ice and was held there for 5 min. This process was necessary for maintaining the right structural of the target DNA. The sensitivity of this DNA biosensor was examined by using the different concentrations of target DNA.[Citation8,Citation25]
Electrochemical impedance measurements
EIS was performed by using an Autolab potentiostat/galvanostat (PGSTAT 302 N, Eco Chemie, the Netherlands). The experimental conditions were controlled with Frequency Response Analyzer (FRA) and General Purpose Electrochemical System (GPES) software. All the tests were done with the three electrode systems: an Ag/AgCl/saturated KCl as a reference electrode, a platinum foil as a counter electrode, and a 3.0-mm-diameter GCE (Azar electrode, Urmia, Iran) as the working electrode. Every potentials, in this case, were presented in the qualification of the Ag/AgCl/saturated KCl electrode potentials. The measurements of the faradic impedance were displayed in the existence of 10 mM [Fe(CN)6]3−/4− reducer. For the pH measurements, a Metrohm 691 pH/ion Meter was utilized.
EIS was performed for the recognition of the DNA probe immobilization and the DNA target hybridization in a base solution of the reducer ([Fe(CN)6]3−/4−, 10 mM) consisting of 0.1 M PBS buffer and 0.1 M KCl pH 7.4. EIS was registered in the frequency ranging from 0.1 to 105 Hz at a constant potential EIS of 150 mV with an alternating voltage of 10 mV.[Citation7,Citation25]
Results
Fungal growth
The strain was grown on PDA and the spores were harvested in sterile water as well. Although the spore germination was related to the water activity and temperature, the fungi strain that was obtained for this research produced 108 spores/mL in optimum condition (at 25°C in the dark during 3 days incubation), and each spore was contained approximately 0.036 picogram DNA.[Citation26] The aflatoxin biosynthesis gene was detected in this strain which was approved by the specific primers and the PCR product. The PCR reaction of the alfD gene is shown in . The af, bf, and cf bands are related to the PCR products of A. flavus, contaminated pistachio with A. flavus, and the control experiment without any gene amplification, respectively.
Figure 1. Agarose gel electrophoresis of PCR product. ((af): PCR product of A. flavus. (bf): PCR product of contaminated pistachio. (cf): control experiment without any genes).
Characteristics of AuNP—GCE
AuNPs electrodeposited on the GCE by the cyclic voltammetry and AuNP–GCE were formed as well. shows the AuNP–GCE electrochemical response scanning between—0.2 and +1.6 V for 10 electrodeposition scans. The anodic peaks at 1.09 and 1.26 V were related to Au oxidation. On the returned scan, the lowest point was related to the next reduction of the oxides previously constructed. Overall, this represented the deposition of AuNPs on the electrode surface.[Citation23,Citation24] The SEM image of the surface of the AuNP–GCE is shown in . AuNPs with an average diameter of approximately 35 nm were obtained.
Figure 2. a. Cyclic voltammograms of bare electrode and AuNP electrodeposited electrode (potential scanning: −0.2–0.6 V, Scan rate: 50 mV s−1, in 10 mM [Fe(CN)6]3−/4−). b. Cyclic voltammogram recorded at AuNP–GCE (potential scanning: −0.2–1.6 V, Scan rate: 50 mV s−1, N = 10, in 0.1 M NaNO3 aqueous solution with 0.25 mM HAuCl4 · 3H2O and 0.01 M H2SO4).
![Figure 2. a. Cyclic voltammograms of bare electrode and AuNP electrodeposited electrode (potential scanning: −0.2–0.6 V, Scan rate: 50 mV s−1, in 10 mM [Fe(CN)6]3−/4−). b. Cyclic voltammogram recorded at AuNP–GCE (potential scanning: −0.2–1.6 V, Scan rate: 50 mV s−1, N = 10, in 0.1 M NaNO3 aqueous solution with 0.25 mM HAuCl4 · 3H2O and 0.01 M H2SO4).](/cms/asset/77a86c30-36a5-4f91-91bb-c1708cccf791/ljfp_a_1291675_f0002_oc.jpg)
Figure 3. SEM images of AuNP–GCE provided by electrodeposition from a 0.1 M NaNO3 aqua solution with 0.25 mM HAuCl4·3H2O and 0.01 M H2SO4.
Immobilization of DNA probe and detection of hybridization by impedance measurements
It is well known that EIS is an effective tool for studying the interface properties of the surface-modified electrodes. Some parameters such as the surface electron transfer resistance (Ret) and the Warburg element (Zw) have a direct impact on EIS. The complex impedance Z(w) can be represented as the sum of the real Z′(w) and the imaginary Z″(w) components. Obviously, the Ret controls the kinetics of the electron transfer of the reducer on the electrode surface in the EIS. Therefore, this analytical method is very sensitive to the changes on the electrode surface and it is an appropriate application tool for using in the DNA detection. For studying the way of the DNA immobilization, the hybridization, and the amplified analysis, it was just investigated the correspondence among the concentration of DNA and Ret.[Citation27,Citation28]
In this study, the EIS spectrum was used to define the characteristics of the electrode surface. shows the EIS of the different modified electrode. In this figure, the EIS spectrum of the bare electrode, AuNP—GCE, ssDNA—AuNP—GCE, and dsDNA—AuNP—GCE is also shown. The results showed that when AuNPs electrodeposited on the GCE, the impedance responses were decreased, and when the probe and consequently the DNA target were connected on the AuNP—GCE, the impedance responses were increased. The DNA target hybridization enhanced the Ret from 43 KΩ to 98 KΩ. The increased signal observed by the electrochemical DNA sensor revealed that the DNA target attached to the DNA probe and duplex was formed.
Figure 4. EIS of different modified electrode. (EIS was performed in a base solution of 10 mM [Fe(CN)6]3−/4− with 0.1 M KCl and 0.1 M PBS buffer pH 7.4. EIS was registered in the frequency ranging from 0.1 to 105 Hz at a constant potential EIS of 150 mV with an alternating voltage of 10 mV).
![Figure 4. EIS of different modified electrode. (EIS was performed in a base solution of 10 mM [Fe(CN)6]3−/4− with 0.1 M KCl and 0.1 M PBS buffer pH 7.4. EIS was registered in the frequency ranging from 0.1 to 105 Hz at a constant potential EIS of 150 mV with an alternating voltage of 10 mV).](/cms/asset/a8ac7f25-b609-4747-b4ff-6ca95d0de4a9/ljfp_a_1291675_f0004_oc.jpg)
When the thiolated probe of aflD gene was combined covalently on the AuNP—GCE, the electron transfer resistance was increased. This showed that the ssDNA probe had been immobilized onto the AuNP—GCE. The larger amount of the Ret illustrated that the DNA probes can prevent the reducer, [Fe(CN)6]3−/4−, from achieving the electrode surface. It was related to the additional charge among the reducer, [Fe(CN)6]3−/4−, and the negatively charged phosphate backbone of the DNA probe. One of its consequences was that the ability for electron transfer was reduced at the electrode surface.[Citation25] While complementary aflD target was added into the setup, the DNA hybridization was happened and a duplex was formed among the ssDNA target and the ssDNA probe on the AuNP—GCE which the charge density on the surface of the electrode was increased much more and the contact between the [Fe(CN)6]3−/4− reducer and AuNP–GCE was prevented. This was led to a change in the Ret amount and, consequently, was impeded the electron transfer.[Citation7,Citation18]
Optimization of useful parameter on electrochemical measurement
The probe concentration, the target concentration, the probe immobilization, and the target hybridization time were investigated in different conditions to obtain the best results for the sensor detection. The DNA probe incubation time was experimentally examined. shows the results of the DNA probe incubation time’s optimization. The results showed that the best incubation time was 2 h. The biosensor responses were enhanced by increasing incubation time from 1 to 2 h. After 3 h, the biosensor responses were risen by lightly (0.21 KΩ) which was dispensable. As a result, 2 h was used as the best incubation time in the next analyses.
Figure 5. EIS of different incubation time of probe. (EIS was performed in a base solution of 10 mM [Fe(CN)6]3−/4− with 0.1 M KCl and 0.1 M PBS buffer pH 7.4. EIS was registered in the frequency ranging from 0.1 to 105 Hz at a constant potential EIS of 150 mV with an alternating voltage of 10 mV).
![Figure 5. EIS of different incubation time of probe. (EIS was performed in a base solution of 10 mM [Fe(CN)6]3−/4− with 0.1 M KCl and 0.1 M PBS buffer pH 7.4. EIS was registered in the frequency ranging from 0.1 to 105 Hz at a constant potential EIS of 150 mV with an alternating voltage of 10 mV).](/cms/asset/c4c3f7ef-32f5-4484-bc72-6ec130eceb11/ljfp_a_1291675_f0005_oc.jpg)
In addition, the DNA probe concentration has a significant effect on the sensitivity of the DNA sensor. Therefore, the various concentrations of the DNA probe solution (0.1, 1, 10, and 102 μM) were used to optimize the concentration of the probe. There was no significant result for the concentration of the DNA probe over 10.0 μM, probably relating to the active site saturation for immobilizing the DNA probe. Thus, a probe solution of 10 μM and the incubation time of 2 h were chosen for next analyses. In the above experiments, the EIS measurements were carried out to improve conditions.
Furthermore, the effect of the hybridization time on the sensitivity of the biosensor was also examined in order to optimize the hybridization process. shows that the impedance responses to the hybridization were increased by 4 h. After 6 h, the biosensor responses were decreased. Therefore, 4 h was selected as the best time of the hybridization for next analyses. In the above experiments, the EIS measurements were carried out to optimize conditions.[Citation25]
Figure 6. EIS of different incubation time of hybridization. (EIS was performed in a base solution of 10 mM [Fe(CN)6]3−/4− with 0.1 M KCl and 0.1 M PBS buffer pH 7.4. EIS was registered in the frequency ranging from 0.1 to 105 Hz at a constant potential EIS of 150 mV with an alternating voltage of 10 mV).
![Figure 6. EIS of different incubation time of hybridization. (EIS was performed in a base solution of 10 mM [Fe(CN)6]3−/4− with 0.1 M KCl and 0.1 M PBS buffer pH 7.4. EIS was registered in the frequency ranging from 0.1 to 105 Hz at a constant potential EIS of 150 mV with an alternating voltage of 10 mV).](/cms/asset/bfe90dca-b7bb-4da6-b298-a5e1db414c4a/ljfp_a_1291675_f0006_oc.jpg)
To investigate the sensitivity of this DNA electrochemical sensor during the DNA target hybridization on the AuNP—GCE, the behavior related to the concentration of the impedance signal was examined. As shown in , the current peaks were risen by increasing the DNA target concentration, indicating that when the DNA duplex concentration was soared on the electrode the electron transfer was decreased and subsequently the impedance responses were increased. The impedance responses due to the target concentration ranged linearly from 1 nM to 10 µM. The detection limit was 0.55 nM and the correlation coefficient was 0.982. The reproducibility of this biosensor was 3.0% by measuring a 0.05 µM concentration (n = 5) of the DNA target. Furthermore, this biosensor can be used to enumerate A. flavus up to 2.5 × 10⁸ spores/mL.
Figure 7. EIS of hybridization process at a different concentration of DNA target. (a) probe; (b) 0.001 µM; (c) 0.005 µM; (d) 0.01 µM; (e) 0.05 µM; (f) 0.1 µM; (g) 1.0 µM; (h) 10 µM. (EIS was performed in a base solution of 10 mM [Fe(CN)6]3−/4− with 0.1 M KCl and 0.1 M PBS buffer pH 7.4. EIS was registered in the frequency ranging from 0.1 to 105 Hz at a constant potential EIS of 150 mV with an alternating voltage of 10 mV).
![Figure 7. EIS of hybridization process at a different concentration of DNA target. (a) probe; (b) 0.001 µM; (c) 0.005 µM; (d) 0.01 µM; (e) 0.05 µM; (f) 0.1 µM; (g) 1.0 µM; (h) 10 µM. (EIS was performed in a base solution of 10 mM [Fe(CN)6]3−/4− with 0.1 M KCl and 0.1 M PBS buffer pH 7.4. EIS was registered in the frequency ranging from 0.1 to 105 Hz at a constant potential EIS of 150 mV with an alternating voltage of 10 mV).](/cms/asset/7c6a8b09-aa3f-47ee-944c-265fe944abdb/ljfp_a_1291675_f0007_oc.jpg)
EIS measurement of the PCR product from Aspergillus flavus and contaminated pistachio
The efficiency of this biosensor for detection of A. flavus gene was examined. The electrochemical DNA sensor was used to reveal the PCR products of the 76-mer antisense strands of the aflD gene. The results are shown in and the DNA sensor Ret background was exhibited in the probe curve. By hybridizing of the PCR products of the aflD gene, the impedance signal was increased noticeably (af and bf curves). The af and bf curves were related to the PCR products of A. flavus and the contaminated pistachio with A. flavus, respectively. The PCR product was obtained from the control experiment without any genes and a random sequence of 76-mer as a control is shown in cf and R curves, respectively. This spectrum has revealed that the remarkable increasing of Ret was due to the hybridization of the immobilized probes to the PCR products of A. flavus (af curve) and contaminated pistachio (bf curve). In addition, the concentration of the PCR product can be measured by a comparison between the EIS chart of sensitivity () and the EIS chart of the PCR products (). In conclusion, the DNA concentration of (af) was 0.05 µM and (bf) was 0.1 µM.
Figure 8. EIS of PCR product. (af): PCR product of Aspergillus flavus. (bf): PCR product of contaminated pistachio. (cf): control experiment, without any genes. (R): random 76-mer sequence. (EIS was performed in a base solution of 10 mM [Fe(CN)6]3−/4− with 0.1 M KCl and 0.1 M PBS buffer pH 7.4. EIS was registered in the frequency ranging from 0.1 to 105 Hz at a constant potential EIS of 150 mV with an alternating voltage of 10 mV).
![Figure 8. EIS of PCR product. (af): PCR product of Aspergillus flavus. (bf): PCR product of contaminated pistachio. (cf): control experiment, without any genes. (R): random 76-mer sequence. (EIS was performed in a base solution of 10 mM [Fe(CN)6]3−/4− with 0.1 M KCl and 0.1 M PBS buffer pH 7.4. EIS was registered in the frequency ranging from 0.1 to 105 Hz at a constant potential EIS of 150 mV with an alternating voltage of 10 mV).](/cms/asset/d3c122cd-8ab4-4852-8f9d-7a4b669170be/ljfp_a_1291675_f0008_oc.jpg)
Discussion
The pistachio contamination with Aspergillus species has a risk to consumer’s safety and also it can cause the irreparable economic damages.[Citation29] Therefore, the DNA electrochemical sensor was developed for enumerating and detecting the presence of this type of infection in the pistachio. The results confirmed that this DNA biosensor can be used to detect the PCR products with the same sensitivity as a synthetic oligonucleotide. The hybridization of the DNA target (aflD) to the immobilized DNA probe led to increasing of the Ret of the DNA sensor, whereas the non-complementary sequences did not influence on the measured impedance. Another important property of this DNA biosensor was that we can measure the concentration of DNA in a PCR product.
There are several methods for detection and measurement of aflatoxin, like TLC and HPLC,[Citation30] and recently a rapid and cost-effective, direct injection electrospray ionization mass spectrometric (ESI-MS) technique was used to develop the aflatoxin assay.[Citation31] However, in our work, a sensitive DNA probe-based biosensor was developed to analyze the aflatoxin producers and PCR products.
Since physiological factors and mutated genes aflC or aflR affect aflatoxin biosynthesis in A. flavus,[Citation31] the aflD gene will not detect gene expression even though this system can be developed by using quantum-dot (QD) electrochemical,[Citation32] restriction endonuclease-based electrochemical biosensor technology,[Citation33] and a polymerization-induced enzymatic amplification-based electrochemical biosensor[Citation34] for the screening of point mutation in the gene. Therefore, this technique is more useful for enumeration of A. flavus rather than the toxicity detection. The standard in the pistachio fungi count is now 103 CFU/g.[Citation35] In the future, this standard should have development to a number of toxin producers.
So far, there is little information about DNA sensor of aflatoxin; however, a DNA-based gold tag piezoelectric biosensor for alfD gene detection was developed by Tombelli et al.[Citation21] with a detection limit of 0.04 µM. While in our work, the AuNP tag impedimetric electrochemical DNA biosensor was developed with a detection limit of 0.55 nM.
The DNA electrochemical biosensors can detect very small pieces of DNA with high sensitivity and good selectivity, regardless of a leading expert and the high cost, while the procedure is rapid, repeatable, and in addition, no external marker-containing indicator is required. In this biosensor, the significant changes were observed in the electrochemical parameters when AuNP, probe, and DNA target were connected to the electrode surface. Furthermore, the production of the AuNPs on the electrode surface is easy[Citation19] and the AuNP-modified surface had an extensive area and enhanced Ret. These advantages may be appropriate for the manufacture of more effective electrochemical biosensors.[Citation28]
This system has some limitations too, like detection of gene expression or diagnostic between alive and death cells; however, detection of mRNA as a target in the future can solve this problem on electrochemical DNA sensor. One of the limitations of this sensor was that the concentrations above 10 µM did not detect by this sensor and 10 µM was its saturation point. Of course, this biosensor has the potential for developing for identifying gene expression, point mutation, and other gene disorder.
Conclusion
Identification and the removal of the contaminated nuts during pistachio processing are probably the best way to reduce mold and mycotoxin contamination. Although electrochemical sensors with the microfabrication technologies are sensitive, simple, and widely used for detection of DNA, this assay must be developed for gene expression and enumeration as well. In this work, a system was developed for enumeration of toxin producer fungi and these data could be useful for the enumeration of the different fungi in the food contamination by using the standard probe detectors.
Acknowledgments
The authors wish to thank Yazd University Research Council and University of Isfahan for financial support of this research. The authors declare that they have no conflict of interest.
References
- Dalié, D.K.D.; Deschamps, A.M.; Richard-Forget, F. Lactic Acid Bacteria – Potential for Control of Mould Growth and Mycotoxins: A Review. Food Control [Internet] 2010, 21, 370–380. doi.org/10.1016/j.foodcont.2009.07.011.
- Kollia, E.; Proestos, C.; Zoumpoulakis, P.; et al. Inhibitory Effect of Cynara Cardunculus L. Extract on Aflatoxin B1 Production by Aspergillus Parasiticus in Sesame (Sesamum Indicum L.). International Journal of Food Properties [Internet] 2016, 1–10. doi.org/10.1080/10942912.2016.1206928.
- Sardiñas, N.; Vázquez, C.; Gil-Serna, J.; et al. Specific Detection and Quantification of Aspergillus Flavus and Aspergillus Parasiticus in Wheat Flour by SYBR® Green Quantitative PCR. International Journal of Food Microbiology [Internet] 2011, 145, 121–125. http://linkinghub.elsevier.com/retrieve/pii/S0168160510006720.
- Scherm, B.; Palomba, M.; Serra, D.; et al. Detection of Transcripts of the Aflatoxin Genes Afld, Aflo, and Aflp by Reverse Transcription-Polymerase Chain Reaction Allows Differentiation of Aflatoxin-Producing and Non-Producing Isolates of Aspergillus Flavus and Aspergillus Parasiticus. International Journal of Food Microbiology 2005, 98, 201–210.
- Rodrigues, P.; Soares, C.; Kozakiewicz, Z.; et al. Identification and Characterization of Aspergillus Flavus and Aflatoxins. Communicating Current Research and Educational Topics and Trends in Applied Microbiology 2007, 2, 527–534.
- Mcgrath, T.F.; Elliott, C.T.; Fodey, T.L. Biosensors for the Analysis of Microbiological and Chemical Contaminants in Food. Analytical and Bioanalytical Chemistry 2012, 403, 75–92.
- Mazloum-Ardakani, M.; Rajabzadeh, N.; Benvidi, A.; et al. Sex Determination Based on Amelogenin DNA by Modified Electrode with Gold Nanoparticle. Analytical Biochemistry [Internet] 2013, 443, 132–138. doi.org/10.1016/j.ab.2013.08.028.
- Wang, C.; Yuan, X.; Liu, X.; et al. Signal-On Impedimetric Electrochemical DNA Sensor Using Dithiothreitol Modified Gold Nanoparticle Tag for Highly Sensitive DNA Detection. Analytica Chimica Acta [Internet] 2013, 799, 36–43. doi.org/10.1016/j.aca.2013.09.024.
- Thi, T.; Lien, N.; Dai, T.; et al. Multi-Wall Carbon Nanotubes (Mwcnts) -Doped Polypyrrole DNA Biosensor for Label-Free Detection of Genetically Modified Organisms by QCM and EIS. Talanta 2010, 80, 1164–1169.
- Benvidi, A.; Rajabzadeh, N.; Mazloum-Ardakani, M. Simple and Label-Free Electrochemical Impedance Amelogenin Gene Hybridization Biosensing Based on Reduced Graphene Oxide. Biosensors and Bioelectronic [Internet] 2014, 58, 145–152. doi.org/10.1016/j.bios.2014.01.053.
- Casse, N.; Gautier, C.; Cougnon, C. Detection and Modelling of DNA Hybridization by EIS Measurements Mention of a Polythiophene Matrix Suitable for Electrochemically Controlled Gene Delivery. Biosensors and Bioelectronics 2007, 22, 2025–2031.
- Park, J.; Park, S. DNA Hybridization Sensors Based on Electrochemical Impedance Spectroscopy as a Detection Tool. Sensors 2009, 9, 9513–9532.
- Keighley, S.D.; Li, P.; Estrela, P.; et al. Optimization of DNA Immobilization on Gold Electrodes for Label-Free Detection by Electrochemical Impedance Spectroscopy. Biosensors and Bioelectronics 2008, 23, 1291–1297.
- Abdalhai, M.H.; Bashari, M.; Ji, J.; et al. Rapid and Sensitive Detection of Foodborne Pathogenic Bacteria (Staphylococcus Aureus) Using an Electrochemical DNA Genomic Biosensor and Its Application in Fresh Beef. Journal of Agricultural and Food Chemistry 2014, 62, 12659–12667.
- Park, S.-M.; Yoo, J.-S. Electrochemical Impedance Spectroscopy for Better Electrochemical Measurements. Analytical Chemistry [Internet] 2003, 75, 455 A–461 A. doi.org/10.1021/ac0313973.
- Bonanni, A.; Valle, M. Use of Nanomaterials for Impedimetric DNA Sensors: A Review. Analytica Chimica Acta [Internet] 2010, 678, 7–17. doi.org/10.1016/j.aca.2010.08.022.
- Mazloum-Ardakani, M.; Heidari, M.M.; Naderi, M.; et al. Detection of Amplified SRY Gene by a Novel Electrochemical Biosensor Based on Gold Nanoparticles. Scientia Iranica [Internet] 2012, 19, 913–918. doi.org/10.1016/j.scient.2012.01.009.
- Siddiquee, S.; Rovina, K.; Yusof, N.A.; et al. Nanoparticle-Enhanced Electrochemical Biosensor with DNA Immobilization and Hybridization of Trichoderma Harzianum Gene. Sensing and Bio-Sensing Research [Internet] 2014, 2, 16–22. http://www.sciencedirect.com/science/article/pii/S2214180414000063.
- Cheng, X.R.; Hau, B.Y.H.; Endo, T.; et al. Au Nanoparticle-Modified DNA Sensor Based on Simultaneous Electrochemical Impedance Spectroscopy and Localized Surface Plasmon Resonance. Biosensors and Bioelectronic [Internet] 2014, 53, 513–518. doi.org/10.1016/j.bios.2013.10.003.
- Mojtahedi, H.; Rabie, C.J.; Lübben, A.; et al. Toxic Aspergilli from Pistachio Nuts. Mycopathologia 1979, 67, 123–127.
- Tombelli, S.; Mascini, M.; Scherm, B. DNA Biosensors for the Detection of Aflatoxin Producing Aspergillus Flavus and A. Parasiticus. Monatsh Chem. 2009, 140, 901–907.
- Uldahl, S.A.; Knutsen, G. Spore Swelling and Germination as a Bioassay for the Rapid Screening of Crude Biological Extracts for Antifungal Activity. Journal of Microbiological Methods [Internet] 2009, 79, 82–88. doi.org/10.1016/j.mimet.2009.08.007.
- Gotti, G.; Fajerwerg, K.; Evrard, D.; et al. Electrodeposited Gold Nanoparticles on Glassy Carbon: Correlation between Nanoparticles Characteristics and Oxygen Reduction Kinetics in Neutral Media. Electrochimica Acta 2014, 128, 412–419.
- Hezard, T.; Fajerwerg, K.; Evrard, D.; et al. Gold Nanoparticles Electrodeposited on Glassy Carbon Using Cyclic Voltammetry: Application to Hg (II) Trace Analysis. Journal of Electroanalytical Chemistry [Internet] 2012, 664, 46–52. doi.org/10.1016/j.jelechem.2011.10.014.
- Mazloum-Ardakani, M.; Hosseinzadeh, L.; Heidari, M.M. Detection of the M268T Angiotensinogen A3B2 Mutation Gene Based on Screen-Printed Electrodes Modified with a Nanocomposite: Application to Human Genomic Samples. Microchim Acta 2016, 183, 219–227.
- Faustinelli, P.C.; Wang, X.M.; Palencia, E.R.; et al. Genome Sequences of Eight Aspergillus Flavus Spp. and One A. Parasiticus Sp., Isolated from Peanut Seeds in Georgia. Genome Announcements 2016, 4, 3–4.
- Fu, Y.; Yuan, R.; Xu, L.; et al. Indicator Free DNA Hybridization Detection via EIS Based on Self-Assembled Gold Nanoparticles and Bilayer Two-Dimensional 3-Mercaptopropyltrimethoxysilane onto a Gold Substrate. Biochemical Engineering J 2005, 23, 37–44.
- Park, B.; Yoon, D.; Kim, D. Formation and Modification of a Binary Self-Assembled Monolayer on a Nano-Structured Gold Electrode and Its Structural Characterization by Electrochemical Impedance Spectroscopy. Journal of Electroanalytical Chemistry [Internet] 2011, 661, 329–335. doi.org/10.1016/j.jelechem.2011.08.013.
- Ashktorab, N.; Shahnoushi, N. Evaluating the Effect of Aflatoxin Food Safety Concerns on Iran’ S Pistachio Trade with Gravity Model. African Journal of Agricultual Research 2013, 8, 5320–5326.
- Wengui, L.; Kunlong, X.; Rong, X.; et al. Development of an HPLC-Based Method for the Detection of Aflatoxins in Pu-Erh Tea. International Journal of Food Properties 2015, 18, 842–848.
- Patel, T.K.; Anand, R.; Singh, A.P.; et al. Evaluation of Aflatoxin B1 Biosynthesis in A. Flavus Isolates from Central India and Identification of Atoxigenic Isolates. Biotechnology and Bioprocess Engineering. 2014, 19, 1105–1113.
- Mazloum-Ardakani, M.; Aghaei, R.; Mehdi, M. Quantum-Dot Biosensor for Hybridization and Detection of R3500Q Mutation of Apolipoprotein B-100 Gene. Biosensors and Bioelectronic [Internet] 2015, 72, 362–369. doi.org/10.1016/j.bios.2015.05.014.
- Qicai, L.; Qiang, Y.; Wennan, W.; et al. DNA Electrochemical Sensor for Detection of PRSS1 Point Mutation Based on Restriction Endonuclease Technique. Preparative Biochemistry and Biotechnology 2015, 45, 430–437.
- Feng, K.; Zhao, J.; Wu, Z.; et al. High-Sensitive Electrochemical Detection of Point Mutation Based on Polymerization-Induced Enzymatic Amplification. Biosensors and Bioelectronics [Internet] 2011, 26, 3187–3191. doi.org/10.1016/j.bios.2010.12.024.
- INSO. Pistachio Kernel Specifications and Test Methods. Iranian National Standardization Organization. 2013; 5th. Revision. ICS:67.080.10. INSO:218.