
ABSTRACT
Structural changes of proteins in fresh noodles during mixing, resting, sheeting, and cooking were investigated. The protein structural changes were evaluated by measuring the protein content, molecular weight, thiol and disulfide contents, secondary structure, thermal properties, microstructure, and mean particle size. The protein content was not significantly changed during fresh noodle processing. The wheat protein molecular weight decreased from 66.2 to 22.0 kDa during the cooking process. The disulfide content increased during the mixing and cooking processes. Additionally, the cooking process caused an increase in the number of gluten protein absorption peaks in the FTIR analysis. The secondary structure was mainly composed of β-sheets, and their proportion decreased in the cooking process. Gluten proteins were demonstrated to have high thermal stability with an average denaturation temperature of 84.9°C. There was a significant relationship between the gluten protein properties and fresh noodle processing.
Introduction
Fresh noodles, a traditional staple food, have been consumed for thousands of years in many Asian countries. Because of their convenience, high nutritional quality, and enjoyable flavor, fresh noodles are popular globally.[Citation1,Citation2] Fresh noodles are raw, wet noodles in which moisture content ranges from 32% to 40%. Notably, the process of fresh noodle production changes the components within the noodles, playing an important role in improving their quality.
Fresh noodle processing typically comprises dough mixing, resting, sheeting, cutting, and cooking. After those steps, noodle strands can be packed and marketed directly.[Citation3] The process of mixing aims to diffuse the components and to hydrate the flour particles, which is the basic procedure in noodle production.[Citation4] During dough mixing and resting, SDS-unextractable polymers in flours have a well-organized structure and are further adjusted.[Citation5] The sheeting process aims to achieve a smooth dough sheet of perfect thickness and the best eating quality.[Citation3] However, the process of sheeting has nonreversible effects on dough extension properties.[Citation6] In addition, in terms of quality and texture, the interaction pattern between the starch and protein of fresh noodles could have changed during the cooking process.[Citation7]
Wheat proteins are typical cereal proteins. The wheat gluten proteins form three-dimensional structures and play an important role in wheat dough quality. Wheat proteins are sensitive during the fresh noodle making process.[Citation8] The protein content and adequate gluten strength are closely correlated with fresh noodle quality, and a suitable range of protein content is important for textural characteristics.[Citation3] The protein content can reflect the level of nutrition in wheat flour and can have a significant effect on dough rheological properties.[Citation9] Gluten proteins are divided into gliadins and glutenins based on their solubility in alcohols.[Citation10] The proteins in wheat flour are composed of gliadins and glutenins. Gliadin proteins are monogenic alcohol-soluble proteins with molecular weights ranging from 30 to 60 kDa and are broadly classified into four types (ω-, γ-, β-, and α-gliadins). Glutenins, a type of polymeric protein, are categorized into low-molecular-weight glutenin subunits (LMW-GS) and high-molecular-weight glutenin subunits (HMW-GS).[Citation11–Citation13] The proportion of extracted glutenin proteins has a crucial effect on the strength of dough. Rheological properties of dough have been correlated with the secondary structure of gluten proteins.[Citation14] To study the relationship of gluten particle size and wheat product properties, reducing the gluten protein particle sizes was shown to decrease the development time by farinograph and mixograph.[Citation15] The smaller sizes of gluten protein particles also indicated increased starch damage in dough.
This study aimed to investigate the protein structural changes of fresh noodle processing, which is very important to comprehend the quality properties of the noodles. Sodium dodecyl sulfate–polyacrylamide gel electrophoresis (SDS-PAGE) was used to evaluate the protein molecular weight. The contents of thiol and disulfide groups were used to evaluate the formation of the gluten network structure. Fourier transform infrared (FTIR) spectroscopy was applied to measure the proportion changes in the secondary structure. The thermal properties of glutens were measured by differential scanning calorimetry (DSC); scanning electron microscopy (SEM) was employed to have a better understanding of the gluten microscopic structures. The mean particle sizes of gluten proteins were measured using a laser particle size analyzer.
Materials and methods
Materials
High protein wheat flour was procured from Lijin Foodstuff & Edible Oil Corporation, Ltd. (Tianjin, China). The percentage moisture, protein, and ash contents were 10.9%, 12.2%, and 0.41%, respectively. Refined iodized salt was obtained from Tianjin Changlu Salt Industry Co., Ltd. (Tianjin, China). All chemicals and reagents used were of analytical grade.
Preparation of noodles and gluten samples
The noodle formula consisted of 100 parts of flour and 38 parts of distilled water. On a flour weight basis, NaCl was added at 2.0% in distilled water first. The ingredients were mixed for 8 min and formed a crumbly dough. The prepared dough was placed to rest in a plastic bag for 30 min at room temperature. The crumbly dough was passed through a hand-operated extruder machine (Mode FK156-3, Beijing, China) 5 times with the roller gap reduced continuously to obtain dough sheets. Then, sheets were cut into noodles 2 mm in width and 1 mm in thickness. Fresh noodles (50 g) were cooked in 500 mL of boiling distilled water for the optimal cooking time.
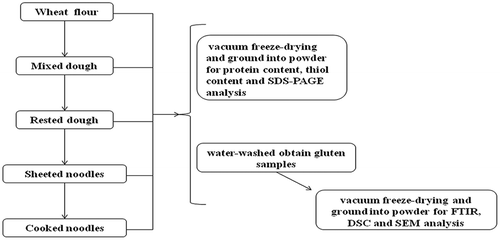
The samples were prepared following the method of Qiong Wang et al.[Citation16] and the method of sampling shown in . Samples from different sampling points were divided into two parts; the first was immediately lyophilized to obtain freeze-dried dough or noodles, and the second was water-washed until the water ran clear of starch to obtain gluten and then lyophilized to obtain freeze-dried gluten. All the above samples were ground into powder in a mortar, sieved, and preserved until analysis.
Figure 1. Method of sampling and sample analysis in fresh noodle processing.
Protein content
The protein content was determined by the Kjeldahl method with a conversion factor of 6.25 using a TUOPU Nitrogen Determinator (ZDDN-II, TUOPU Zhejiang Pty Ltd.). Samples were subject to three replicate determinations.
Sodium dodecyl sulfate–polyacrylamide gel electrophoresis
SDS-PAGE of proteins was tested according to the method of Man Li et al.[Citation8] with some modifications. SDS–PAGE was performed using 12% separating gel (pH 8.8) and 5% stacking gel (pH 6.8). A 50 mg quantity of each sample was stirred in 1 mL of extraction buffer (pH 6.8, 0.01 M Tris–HCl, including 10% (w/v) SDS, 5% (v/v) 2-mercaptoethanol (2-ME), 10% (v/v) glycerol, and 0.1% (w/v) bromophenol blue). The dispersions were heated for 5 min at 100°C and then were centrifuged (8000 g, 5 min). Sample volumes of 10 µL were loaded into the instrument, and electrophoresis was performed at 100 V during the run. The gel used 0.25% w/v Coomassie brilliant blue R250 stain and was de-stained in 10% acetic acid.
Fourier transform infrared spectroscopy
FTIR of gluten samples in the fresh noodle production process was performed according to the method of Kaiqiang Wang et al.[Citation17] FTIR spectra were recorded on an IS50 FTIR spectrometer (Thermo Nicolet Inc, Waltham, MA, USA) equipped with a DTGS KBr detector. Each freeze-dried gluten had a 1 mg sample weighed and added to 150 mg of KBr. These ingredients were mixed with an agate mortar and pestle. After that, samples were formed into tablets by hydraulic pressure, and the tablets were suitable for FTIR experiments. FTIR spectra were recorded at absorbances from 4000 to 400 cm−1.
The amide I band (1600–1700 cm−1) in each spectrum was analyzed using the Omnic software (version 8.1) and Peakfit software (version 4.12, SPSS Inc., Chicago, IL, USA) to evaluate the secondary structure changes in wheat gluten. The targeted structures were β-sheet, 1610–1640 cm−1; random coils, 1640–1650 cm−1; α-helices, 1650–1670 cm−1; and β-turns, 1670–1700 cm−1[Citation18,Citation19]
Thiol and disulfide contents
The values of disulfide SS contents could reflect the aggregation levels between proteins. Contents of accessible thiol (SHfree), total thiol equivalents (SHeq), and disulfide groups (SS) were determined according to the method described by Wagner Magali et al.[Citation20]cm−1). For measurement of the total thiol equivalent groups (SHeq), 30 mg of samples was exhaustively reduced with dithioerythritol (40 mM DTE in 80 mM Tris/HCl, pH 8.5, 0.3 mL) for 2 h at 60°C and then washed two times with 1.6 mL of glacial (18°C) acetic acid (100 mM) in acetone. After centrifugation (5 min, 959 g), the pellet was finally suspended in 1.3 mL of thiol reaction buffer and treated as previously described for (SHfree) determination. The disulfide group (SS) content was calculated from the SHfree and SHeq determinations (SHeq = 2SS+SHfree). All results are expressed in μmol per g of protein.
Differential scanning calorimetry
DSC of gluten samples was performed according to the method of Yulan Wang et al.[Citation21] with some modifications. DSC was carried out using a DSC-60A (Shimadzu, Japan) instrument with TA60 thermal analysis software. Approximately 2 mg of lyophilized sample was weighed into a hermetically sealed sample pan. The reference was an empty pan. DSC was performed in the temperature range of 25–200°C at a heating rate of 10°C/min. After heating, the sample was cooled to room temperature, and the DSC curves were obtained for the next step of analysis.
Scanning electron microscopy
SEM was performed by the method of Yulan Wang et al.[Citation21] and Agnieszka Nawrocka et al.[Citation22] The freeze-dried gluten samples were mounted on specimen stubs using double-sided adhesive tape and coated with gold. Coated samples were photographed using a JSM-IT300LV SEM (JEOL Ltd., Japan) with 3000 × magnification at an accelerating voltage of 10 kV.
Gluten proteins’ particle size measurement
The size of gluten protein particles was determined using a BT-90 Mastersizer (Dandong, China).[Citation16] Lyophilized gluten protein powder was dissolved in isopropyl alcohol, and it was mixed using mechanical agitation and treated with ultrasound for 1 min to dissolve the gluten clots to obtain an obscuration of 15–20%. The size of gluten protein particles was expressed by the mean particle size.
Statistical analysis
The SPSS statistical software (Version 19.0, SPSS Inc.) was used to certify significant differences in protein properties of different fresh noodle production processes by one-way analysis of variance (ANOVA), where p < 0.05 was considered to be significant.
Results and discussion
Wheat protein content
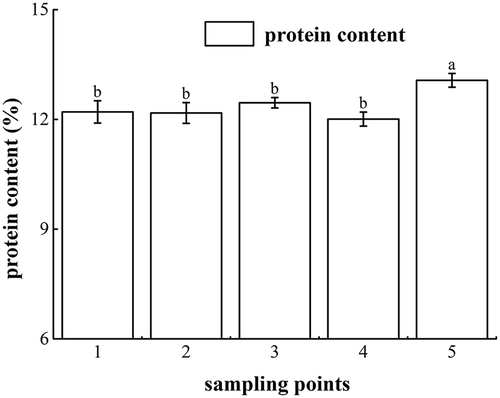
To understand the protein losses in fresh noodles during processing, the protein contents of mixed dough, rested dough, sheeted noodles, and cooked noodles were evaluated. The change of protein content in the fresh noodles during processing is shown in . At the five sampling points, the protein contents were 12.2 ± 0.3%, 12.2 ± 0.3%, 12.5 ± 0.1%, 12.0 ± 0.2%, and 13.1 ± 0.2%, respectively. The cooked noodles showed the highest protein content value compared to those after the other processes, and heat treatment by cooking significantly increased the protein content of fresh noodles (p < 0.05). As noodles were cooked in boiling water, the hydrogen bonds between the gluten protein and starch in noodles were continuously breaking, prompting starch gelatinization along with protein coagulation.[Citation7] Additionally, a notable amount of amylopectin and amylose had been dispersed out of the starch granules, and these starches were dissolved in the water.[Citation23] Therefore, the proportion of protein in cooked noodles was higher than in the other processes.
Figure 2. Changes in the total protein content in the fresh noodle processing. Sampling point 1 means wheat flour; sampling point 2 means mixed dough; sampling point 3 means rested dough; sampling point 4 means sheeted noodles; sampling point 5 means cooked noodles. Superscripts denote significant difference (p < 0.05).
Electrophoretic profiles of wheat proteins
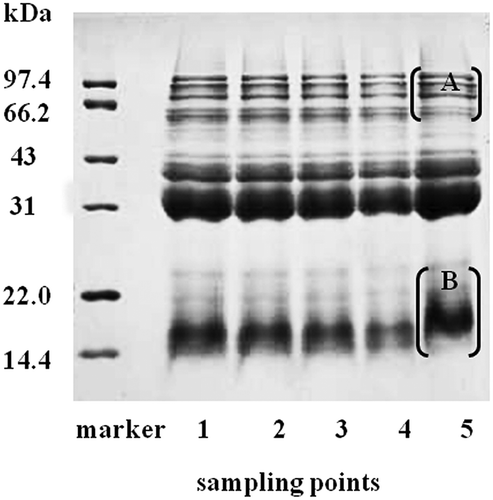
Wheat protein profiles from SDS-PAGE are shown in . The protein molecular weight ranges from 14.4 to 97.4 kDa. The results showed that there were no significant changes in wheat protein molecular weight during the mixing, resting and sheeting processes. However, it could be observed that the intensity of some bands (Part B, 14.4–22.0 kDa) had increased greatly after cooking, and the bands (Part A, 66.2–97.4 kDa) that are mainly glutenin had decreased or vanished. These changes may reflect the decomposition of high molecular weight proteins due to the heat effect of cooking, which suggested polymerization of glutenin. This is consistent with a previous work, which reported that the intensity of the bands of glutenin (66.2 –97.4 kDa) noticeably decreased at 95°C and that glutenins exposed their inner structure more easily than gliadins at high temperature.[Citation24] With the successive and intense heat treatments, damage to the intramolecular disulfide bonds and development of new intermolecular disulfide bonds and protein–protein interactions occurred in wheat gluten proteins.[Citation25,Citation26]
Figure 3. SDS-PAGE profiles of the total protein in the fresh noodle processing.
Contents of thiol and disulfide groups of wheat proteins
Accessible thiol (SHfree) in wheat proteins contributed to the formation of disulfide groups (–S–S–) and thus the gluten three-dimensional network structure.[Citation8] shows the contents of SHfree, SHeq, and SS of wheat protein in the fresh noodle production processes. A decrease in SHfree was observed after mixing (50.96 to 44.34 μmol/g protein, p < 0.05) along with an increase in SS (36.01 to 41.10 μmol/g protein, p < 0.05). The results likely indicate the formation of the gluten three-dimensional structure during flour hydration and mixing. It should be noted that there was a significant decrease in SHfree after cooking (37.94 to 13.20 μmol/g protein, p < 0.05) and a significant increase in SS in the same process (44.28 to 57.44 μmol/g protein, p < 0.05). This result indicated an increasing aggregation of gluten protein upon heat treatments by cooking. This observation was in accordance with the results of SDS-PAGE, confirming the polymerization of glutenin. In a previous study, Wagner Magali et al.[Citation20] also discovered that the content of SHfree was reduced significantly during the pasta overcooking process.
Table 1. The contents of accessible thiol (SHfree), total thiol equivalent (SHeq), and disulfide groups (SS) in the fresh noodle processing.
Secondary structure analysis of gluten proteins
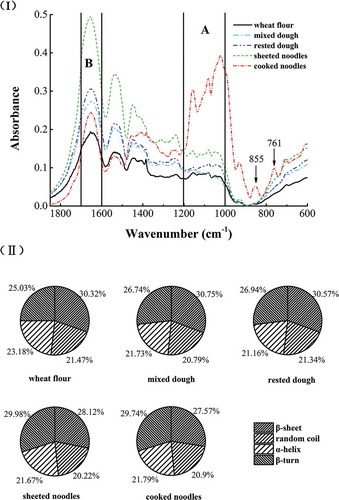
FTIR spectroscopy can be used to observe changes in the secondary structure of gluten proteins.[Citation27] The FTIR spectra of gluten proteins are depicted in . As shown in region A, there were three apparent peaks at 1022, 1081, and 1157 cm−1, which corresponded to the C–O–C stretching and CO (–COH) stretching of starch.[Citation10] There existed no clear differences in region A during the mixing, resting and sheeting processes. In contrast, the intensities of these three peaks were observed to have increased significantly in gluten proteins of cooked noodles, reflecting that there was residual starch in the samples. This is potentially induced by the increased connectivity between protein and starch during cooking. Two peaks with considerable intensities never observed in other samples existed in the cooked noodle gluten protein spectra, one peak at 855 cm−1, which is characteristic of aromatic C–H out-of-plane deformation, and another peak at 761 cm−1, which may correspond to the S–N stretching mode.[Citation28,Citation29]
Region B (1600–1700 cm−1) is the amide I region. The secondary structure analysis from amide I bands has been broadly described. The stable band near 1655 cm−1 is assigned to α-helical structure.[Citation30] In region B, the peak at 1654 cm−1 exhibits different absorptive intensities during the noodle processing. During mixing, resting and sheeting processes, the absorption intensity of amide I increased gradually, whereas the absorption intensity of amide I decreased dramatically in the cooking process. This result indicated that the secondary structure in gluten proteins was broken by heating reactions in cooked noodles.
The amide I peaks ranging from 1700–1600 cm−1 mainly originate from C = O stretching vibrations, and this region is influenced by hydrogen bonding. The amide I band of proteins is formed of many folded composing bands, which indicate different protein secondary structural components such as α-helices, β-sheets, β-turns, and random coil structures.[Citation19,Citation31] II) shows the proportions of the secondary structures of wheat proteins in the fresh noodle processing. The fraction of β-sheet structure increased slightly (from 30.32% to 30.75%) during the mixing process. In contrast, the β-sheet structure decreased (from 30.57% to 27.57%) during the sheeting and cooking processes. Previous work has reported that the β-sheet structure composed of hydrophobic interactions and hydrogen bonding acts as a dilatant in the gluten network.[Citation32] During the dough mixing, the flour powder forms viscous wet granules; after proper kneading it becomes a rubber-like dough.[Citation33] Heat treatment can alter the structure and physicochemical properties of a protein.[Citation34] First, wheat flour was hydrated with water, which is good for the gluten network formation. Second, the hydrogen bonding in the gluten network was broken, due to the mechanical and heat treatment from the sheeting and cooking processes.
Figure 4. The change in the wheat proteins secondary structures in the fresh noodle processing. (I) FT-IR spectrum of wheat proteins in different fresh noodles processing shown in the range 400–1800 cm–1 after baseline correction. (II) Proportions of the secondary structures of wheat proteins in the fresh noodles processing. Values on the pie chart means the percentage of each secondary structure.
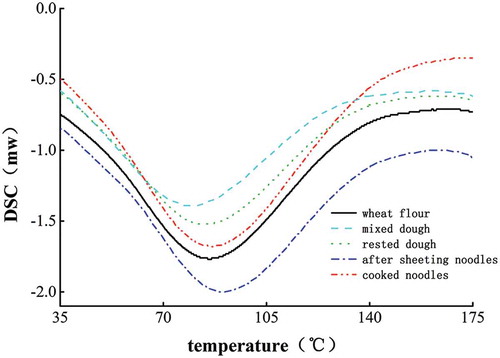
DSC analysis of gluten proteins
Thermal analysis is usually used to study the influence of thermal processing on cereal proteins.[Citation35] presents examples of thermograms for gluten proteins during the fresh noodle making process. shows characteristic thermal parameters of gluten proteins during the fresh noodle processing. The gluten protein DSC thermograms showed only one endothermic peak, which averaged at 84.9°C with average enthalpies of 149.20 J/g. Similarly, in a previous study, the gluten proteins had an ordered structure based on the high enthalpy values.[Citation35] A higher Tp indicated that the gluten protein was more thermodynamically stable. In other words, proteins with higher Tp are not easy to denature at lower temperatures.[Citation36] Therefore, the thermodynamic properties of gluten are stable. There was no significant change in the Tp of gluten during fresh noodle processing.
Table 2. Thermal characteristic parameters of gluten proteins in the fresh noodle processing.
Figure 5. DSC curves of gluten proteins in the fresh noodle processing.
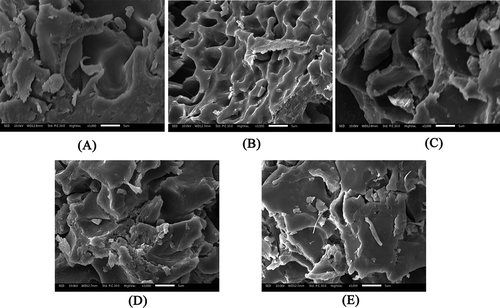
SEM image analysis of gluten proteins
Scanning Electron Microscopy was used to monitor changes in the microstructure of gluten.[Citation22,Citation37] shows SEM photos of gluten proteins during fresh noodle processing. Small granules visible in the images are starch molecules that were not washed out. The visible apertures of gluten in mixed dough and rested dough were observed to be much larger than those in wheat flour, sheeted noodles and cooked noodles. In addition, gluten in , 6D and presented a more laminar structure, while gluten in and 6C presented a more fibrous structure. Gluten protein polymerization might occur upon sheeting and cooking (Fig. 6D and ). Therefore, the gluten three-dimensional network structure was formed by mixing, completed by resting, and finally modified by sheeting and cooking. This was probably due to the mechanical and thermal effects from fresh noodle processing.
Figure 6. SEM photos of gluten proteins in the fresh noodle processing. (A) Wheat flour gluten, (B) mixed dough gluten, (C) rested dough gluten, (D) sheeted noodle gluten, (E) cooked noodle gluten.
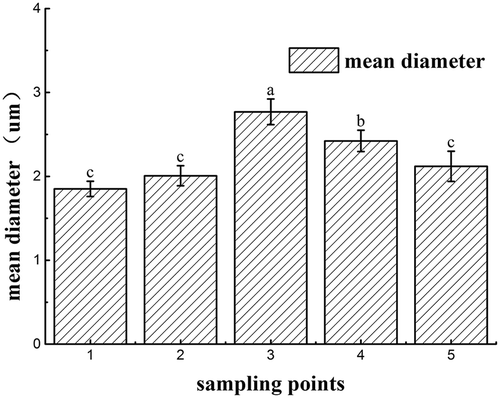
Mean particle size of gluten proteins
By taking particle diameter measurement as a tool, the aggregation of gluten proteins was evaluated.[Citation16,Citation38] As showed in , the mean particle size of gluten proteins significantly increased from 1.85 to 2.77 μm during the resting process (p < 0.05). The results may be because the mean particle size of gluten proteins was directly dependent upon the degree of gluten network structure, and the gluten was hydrated in the process of mixing and resting. However, the mean particle size of gluten proteins in both sheeted and cooked noodles decreased significantly. This result was probably due to gluten proteins being modified as a laminar structure, showing low solubility in isopropyl alcohol. The mean diameter results are consistent with the results of gluten SEM image analysis, confirming the laminar structure of glutenin in the sheeting and cooking processes. Agnese Panozzo et al. discovered that the changes in gluten particle size distribution suggested the modification of intra- and inter-molecular protein–protein interactions, which include the contents of SHfree and disulfide bonds (–S–S–).[Citation39] Therefore, the results are also consistent with the results of the thiol and disulfide group contents.
Figure 7. The change in the mean particle size of gluten proteins in the fresh noodles processing. Sampling point 1 means wheat flour gluten; sampling point 2 means mixed dough gluten; sampling point 3 means rested dough gluten; sampling point 4 means sheeted noodles gluten; sampling point 5 means cooked noodles gluten. Superscripts denote significant difference (p < 0.05).
Conclusions
Fresh noodle manufacture induced a series of remarkable changes in the physicochemical properties of gluten proteins. In detail, the mixing process was effective in improving gluten aggregation and forming gluten network structure by increasing the content of disulfide groups (–S–S–), the intensity of the amide I band and the proportion of β-sheets. The resting process only slightly completed the gluten network structure compared to the other processes. The sheeting process changed the microstructure of gluten from fibrous to laminar by mechanical treatment, and the denaturation temperature of sheeted noodles was determined to be the highest among the noodle processes. Notably, the cooking process increased the content of disulfide groups (–S–S–) and the number of FTIR absorption peaks but decreased the molecular weight and the proportion of β-sheets in gluten proteins. These significant changes in the cooking process indicated that the gluten network structure was dramatically modified by heat treatments. In conclusion, the gluten three-dimensional network structure was formed, completed and further modified during the mixing, resting, sheeting, and cooking phases, especially in the cooking process. This study increased our insight into the behaviors of the gluten network during processing and provided references for evaluating the noodle quality.
Related Research Data
References
- Li, M.; Luo, L.J.; Zhu, K.X.; Guo, X.N.; Peng, W.; Zhou, H.M. Effect of Vacuum Mixing on the Quality Characteristics of Fresh Noodles. Journal of Food Engineering 2012, 110, 525–531.
- Li, M.; Zhu, K.X.; Wang, B.W.; Guo, X.N.; Peng, W.; Zhou, H.M. Evaluation the Quality Characteristics of Wheat Flour and Shelf-life of Fresh Noodles as Affected by Ozone Treatment. Food Chemistry 2012, 135, 2163–2169.
- Fu, B.X. Asian Noodles: History, Classification, Raw Materials, and Processing. Food Research International 2008, 41, 888–902.
- Liu, R.; Wei, Y.M.; Ren, X.L.; Xing, Y.L.; Zhang, Y.Q.; Zhang, B. Effects of Vacuum Mixing, Water Addition, and Mixing Time on the Quality of Fresh Chinese White Noodles and the Optimization of the Mixing Process. Cereal Chemistry 2015, 92, 427–433.
- Aussenac, T.; Carceller, J.L.; Kleiber, D. Changes in SDS Solubility of Glutenin Polymers during Dough Mixing and Resting. Cereal Chemistry 2001, 78, 39–45.
- Chakrabartibell, S.; Bergström, J.S.; Lindskog, E.; Sridhar, T. Computational Modeling of Dough Sheeting and Physical Interpretation of the Non-linear Rheological Behavior of Wheat Flour Dough. Journal of Food Engineering 2010, 100, 278–288.
- Ye, X.; Sui, Z. Physicochemical Properties and Starch Digestibility of Chinese Noodles in Relation to Optimal Cooking Time. International Journal of Biological Macromolecules 2016, 84, 428–433.
- Li, M.; Zhu, K.X.; Peng, J.; Guo, X.N.; Amza, T.; Peng, W.; Zhou, H.M. Delineating the Protein Changes in Asian Noodles Induced by Vacuum Mixing. Food Chemistry 2014, 143, 9–16.
- Payne, P.I.; Nightingale, M.A.; Krattiger, A.F.; Holt, L.M. The Relationship between HMW Glutenin Subunit Composition and the Bread-making Quality of British-grown Wheat Varieties. Journal of the Science of Food & Agriculture 1987, 40, 51–65.
- Li, W.; Dobraszczyk, B.J.; Dias, A.; Gil, A.M. Polymer Conformation Structure of Wheat Proteins and Gluten Subfractions Revealed by ATR-FTIR. Cereal Chemistry 2006, 83, 407–410.
- Katyal, M.; Virdi, A.S.; Kaur, A.; Singh, N.; Kaur, S.; Ahlawat, A.K.; Singh, A.M. Diversity in Quality Traits Amongst Indian Wheat Varieties I: Flour and Protein Characteristics. Food Chemistry 2016, 194, 337–344.
- Shewry, P.R.; Tatham, A.S.; Forde, J.; Kreis, M.; Miflin, B.J. The Classification and Nomenclature of Wheat Gluten Proteins: A Reassessment. Journal of Cereal Science 1986, 4, 97–106.
- Ram, S. High Molecular Weight Glutenin Subunit Composition of Indian Wheats and Their Relationships with Dough Strength. Journal of Plant Biochemistry and Biotechnology 2012, 12, 151–155.
- Kaur, A.; Singh, N.; Kaur, S.; Katyal, M.; Virdi, A.S.; Kaur, D.; Ahlawat, A.K.; Singh, A.M. Relationship of Various Flour Properties with Noodle Making Characteristics among Durum Wheat Varieties. Food Chemistry 2015, 188, 517–526.
- Sapirstein, H.D.; David, P.; Preston, K.R.; Dexter, J.E. Durum Wheat Breadmaking Quality: Effects of Gluten Strength, Protein Composition, Semolina Particle Size and Fermentation Time. Journal of Cereal Science 2007, 45, 150–161.
- Wang, Q.; Li, Y.; Sun, F.S.; Li, X.Y.; Wang, P.D.; Sun, J.T.; Zeng, J.; Wang, C.; Hu, W.; Chang, J.L.; Chen, M.J.; Wang, Y.S.; Li, K.X.; Yang, G.X.; He, G.Y. Tannins Improve Dough Mixing Properties through Affecting Physicochemical and Structural Properties of Wheat Gluten Proteins. Food Research International 2015, 69, 64–71.
- Wang, K.Q.; Luo, S.Z.; Cai, J.; Sun, Q.Q.; Zhao, Y.Y.; Zhong, X.Y.; Jiang, S.T.; Zheng, Z. Effects of Partial Hydrolysis and Subsequent Cross-linking on Wheat Gluten Physicochemical Properties and Structure. Food Chemistry 2016, 197, 168–174.
- Zhang, Q.; Shen, Y.H.; Xie, A.J. Study on the Microstructure of Protein in Soluble Complexes Containing Bovine Serum Albumin and Calcium Hydroxyapatite and Calcium Carbonate. Spectroscopy & Spectral Analysis 2000, 22, 267–269.
- Haris, P.I.; Severcan, F. FTIR Spectroscopic Characterization of Protein Structure in Aqueous and Non-aqueous Media. Journal of Molecular Catalysis B Enzymatic 1999, 7, 207–221.
- Wagner, M.; Morel, M.H.; Bonicel, J.; Cuq, B. Mechanisms of Heat-mediated Aggregation of Wheat Gluten Protein upon Pasta Processing. Journal of Agricultural & Food Chemistry 2011, 59, 3146–3154.
- Wang, Y.; Belton, P.S.; Bridon, H.; Garanger, E.; Wellner, N.; Parker, M.L.; Grant, A.; Feillet, P.; Noel, T.R. Physicochemical Studies of Caroubin: A Gluten-like Protein. Journal of Agricultural & Food Chemistry 2001, 49, 3414–3419.
- Nawrocka, A.; Kowalski, R.; Gruszecki, W.I. Influence of Dietary Fibre on Gluten Proteins Structure &Ndash; a Study on Model Flour with Application of FT-Raman Spectroscopy. Journal of Raman Spectroscopy 2015, 46, 309–316.
- Heneen, W.K.; Brismar, K. Structure of Cooked Spaghetti of Durum and Bread Wheats. Starch/Starke 2003, 55, 546–557.
- Luo, Y.; Li, M.; Zhu, K.X.; Guo, X.N.; Peng, W.; Zhou, H.M. Heat-induced Interaction between Egg White Protein and Wheat Gluten. Food Chemistry 2016, 197, 699–708.
- Ravi, R.; Ajila, C.M.; Rao, U. Role of Steaming and Toasting on the Odor, Protein Characteristics of Chickpea (Cicer Arietinum L.) Flour, and Product Quality. Journal of Food Science 2011, 76, S148–S155.
- Jeanjean, M.F.; Damidaux, R.; Feillet, P. Effect of Heat Treatment on Protein Solubility and Viscoelastic Properties of Wheat Gluten. Cereal Chemistry 1980, 57, 325–331.
- Wellner, N.; Mills, E.N.C.; Brownsey, G.; Wilson, R.H.; Brown, N.; Freeman, J.; Halford, N.G.; Shewry, P.R.; Belton, P.S. Changes in Protein Secondary Structure during Gluten Deformation Studied by Dynamic Fourier Transform Infrared Spectroscopy. Biomacromolecules 2005, 6, 255–261.
- Deepa, M.; Agnihotry, S.A.; Gupta, D.; Chandra, R. Ion-pairing Effects and Ion-solvent-polymer Interactions in Lin(CF3SO2)2-PC-PMMA Electrolytes: A FTIR Study. Electrochimica Acta 2004, 49, 373–383.
- Kotilainen, R.A.; Toivanen, T.J.; Alen, R.J. FTIR Monitoring of Chemical Changes in Softwood during Heating. Journal of Wood Chemistry & Technology 2000, 20, 307–320.
- Bonnier, F.; Rubin, S.; Debelle, L.; Ventéo, L.; Pluot, M.; Baehrel, B.; Manfait, M.; Sockalingum, G.D. FTIR Protein Secondary Structure Analysis of Human Ascending Aortic Tissues. Journal of Biophotonics 2008, 1, 204–214.
- Susanne, M.; Wolfgang, F.; Hanns-Christian, M. FTIR and Ndsc as Analytical Tools for High-concentration Protein Formulations. Pharmaceutical Research 2006, 23, 1350–1363.
- Tuhumury, H.C.D.; Small, D.M.; Day, L. The Effect of Sodium Chloride on Gluten Network Formation and Rheology. Journal of Cereal Science 2014, 60, 229–237.
- Schiraldi, A.; Fessas, D. The Role of Water in Dough Formation and Bread Quality. In Breadmaking: Improving Quality, Ed.; Cauvain, S.P.; Cambridge, England: Woodhead Publishing, 2003, 306–320.
- Zhang, H.H.; Claver, I.P.; Qin, L.; Zhu, K.X.; Peng, W.; Zhou, H.M. Structural Modification of Wheat Gluten by Dry Heat-enhanced Enzymatic Hydrolysis. Food Technology & Biotechnology 2012, 50, 53–58.
- León, A.; Rosell, C.M.; Barber, C.B.D. A Differential Scanning Calorimetry Study of Wheat Proteins. European Food Research & Technology 2003, 217, 13–16.
- Khatkar, B.S.; Barak, S.; Mudgil, D. Effects of Gliadin Addition on the Rheological, Microscopic and Thermal Characteristics of Wheat Gluten. International Journal of Biological Macromolecules 2014, 53, 38–41.
- Giacintucci, V.; Guardeño, L.; Puig, A.; Hernando, I.; Sacchetti, G.; Pittia, P. Composition, Protein Contents, and Microstructural Characterisation of Grains and Flours of Emmer Wheats (Triticum Turgidum Ssp. Dicoccum) of the Central Italy Type. Czech Journal of Food Sciences 2014, 32, 115–121.
- Hu, X.; Zhao, M.M.; Sun, W.Z.; Zhao, G.L.; Ren, J.Y. Effects of Microfluidization Treatment and Transglutaminase Cross-linking on Physicochemical, Functional, and Conformational Properties of Peanut Protein Isolate. Journal of Agricultural and Food Chemistry 2011, 59, 8886–8894.
- Panozzo, A.; Manzocco, L.; Lippe, G.; Nicoli, M.C. Effect of Pulsed Light on Structure and Immunoreactivity of Gluten. Food Chemistry 2016, 194, 366–372.