
ABSTRACT
In this work, an open-ended coaxial probe was used to characterize the dielectric properties of different tequilas and agave-distilled spirits in the range from 500 MHz to 20 GHz. The alcohol content of these beverages was clearly identified at these frequencies. From a Cole–Cole plot, the relaxation time (τ) was extracted and it was observed that there was a linear correlation between alcohol content and τ, where lower τ corresponds to lower ethanol content. In addition, dielectric differences were also found between silver, aged, and extra-aged tequilas. As aging increased, the real and imaginary parts of the permittivity increased (p < 0.05). These findings offered a new method for detecting alcohol content in tequila as well as for identifying tequila aging.
Introduction
Tequila is one of the most consumed spirits around the world, with about 230 million liters drank per year in 2013.[Citation1] Tequila is originally from the region of Tequila, Jalisco, Mexico. It is produced from Agave tequilana Weber cv. ‘Blue’ using a distillation process. The officially delimited denomination of origin (geographical indication) where tequila can be grown includes municipalities in five Mexican states (all of the state of Jalisco, plus parts of Guanajuato, Michoacán, Nayarit, and Tamaulipas).[Citation2]
Tequila Regulator Council (CRT) in Mexico classifies tequila to be Tequila 100% pure agave if it is obtained from mature heads of agave, which is previously hydrolyzed or cooked, and introduced to alcoholic fermentation with yeast. The worts (mostos) should be able to mix together in formulation with other sugars in a proportion not exceeding 49%. Generally, tequilas are classified based on aging: (a) white or silver tequila (Blanco), which is obtained after fermentation and double distillation; (b) aged tequila (Reposado) is extracted after aging in oak barrels for 3–12 months; and (c) extra-aged tequila (Añejo) is acquired after being aged from 1 to 3 years.[Citation3,Citation4] The alcohol contents must be between 35% and 55%. In addition, other agave-distilled spirits are commercially available, but normally have lower alcohol content. In the local supermarket we found these spirits with alcohol content from 26% to 34%.
There are official methods to determine alcoholic content in distilled liquors, which include the use of a refractometer (official method 950.04) or a pycnometer (official method 942.06), according to AOAC.[Citation5] The refractometer method needs a previous calibration curve, while the pycnometer method involves a time-consuming distillation to determine the density of the distilled sample. In the literature, we can find different methods to characterize alcoholic beverages.[Citation6–Citation12] For tequila, both gas and liquid chromatography have been published for identifying some compounds (ethanol, methanol, higher alcohols, ethyl acetate, acetaldehyde, and others).[Citation7,Citation8,Citation12] Raman spectroscopy[Citation10] and Fourier transform infrared-spectroscopy[Citation11] have been used to measure the alcohol content in tequila. UV–visible spectroscopy[Citation6] has been applied as a verification method. However, these techniques can be very expensive or can be complicated to apply. Another measurement technique is surface plasmon resonance (SPR).[Citation13,Citation14]
One of the main advantages of using microwave techniques over optical methods to characterize beverages is their ability to penetrate different non-metallic containers such as bottles or barrels. This gives the possibility of making non-destructive sensors capable of performing in situ measurements. The objective of this work is to provide the dielectric characteristics of different types of tequila and other agave-distilled spirits in the microwave range to determine the alcohol content and the recognition of different tequila types (e.g. silver, aged, and extra-aged).
Materials and methods
Materials
Nine samples of tequila (100% agave) and three agave-distilled spirits having different alcohol contents were purchased at a local supermarket in Puebla, Mexico. Samples made from 100% agave contain 35%, 38%, 40%, or 46% alcohol. Samples of other agave-distilled spirits (not tequila) had lower alcohol contents of 26%, 28%, or 34%. provides detailed information about the different spirits. Samples were not manipulated prior to experimentation.
Table 1. Characteristics of the samples of tequila and distilled spirits analyzed in this study.
Dielectric properties
The open-ended coaxial probe technique has been used to study the dielectric properties of liquid and semiliquid materials.[Citation15–Citation18] The dielectric constant (ε′) is defined by the amount of electromagnetic energy stored in a material. The dielectric loss factor (ε″) is characterized by the amount of electromagnetic energy converted into heat in a material. For this reason, a material with a higher ε″ value has the capability of converting more energy into heat than a lower ε″ material. The loss tangent is the ratio of ε″ over ε′[Citation15]
The frequency behavior of the dielectric properties is described by[Citation16]
where is the static dielectric constant,
is the dielectric constant at high frequencies where molecular orientation does not affect polarization, f is frequency in Hz, and
is the relaxation time (τ).
Dielectric measurements
A vector network analyzer, VNA (Keysight Technologies, N9918A FieldFox) and an 85070E open-ended coaxial probe kit were used to conduct the measurements. The VNA was turned on for approximately 2 h for stabilization. Subsequently, a standard open-short-load calibration was performed with 101 discrete frequencies. The VNA was connected to the open-ended coaxial probe and an air-short-deionized water (25°C) calibration was conducted. Around 500 mL of deionized water was kept in a 13.5 cm height glass flask having a diameter of 5 cm, and the probe tip was kept at 36 cm from the ground level. The probe tip was immersed 2 cm inside the water, resulting in a distance of about /8 from the probe tip to the bottom of the sample at the lowest frequency. With this setup, the system error was about 5% after calibration.[Citation18] Initially, 500 mL of tequila was poured in a glass vessel at room temperature. Air bubbles were manually removed to prevent measurement errors. Ten readings were taken and the mean values were calculated. This process was carried out for all brands of tequila and distilled agave spirits. Every measurement took less than 1 min.
Statistical analysis
Results were analyzed by ANOVA using the software Minitab 17 (Minitab Inc., State College, PA). Differences were established at the significant level of p = 0.05, using the Tukey test.
Results and discussion
Dielectric constant
presents the experimental results of ε′ of all different types of tequila over the entire bandwidth (500 MHz–20 GHz). The ε′ decreased with increasing frequency (p < 0.05). The reason behind this behavior is explained by Eq. (2), if at a given temperature, εs, ε, and τ are almost constant. It is seen that ε′ has a negative relationship with the square of frequency.
Figure 1. Dielectric constant of tequilas and agave-distilled spirits with different alcohol contents at room temperature.
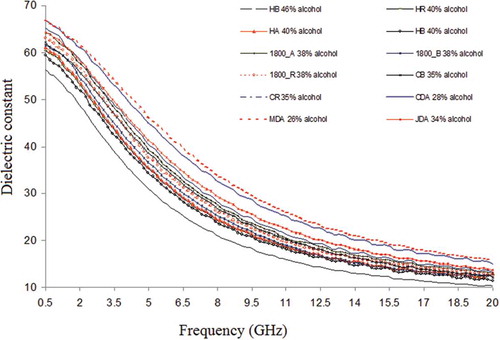
Moreover, higher ε′ values were related to agave-distilled spirits with lower alcohol content than tequila (p < 0.05). The plot with the lowest ε′ values corresponded to the tequila with the highest alcohol content (46%), whereas the trace with the highest ε′ values corresponded to the agave-distilled spirit with 26% alcohol. This may be due to agave-distilled spirits having a higher content of sugars, water, and fatty acids.[Citation19,Citation20]
Dielectric loss factor
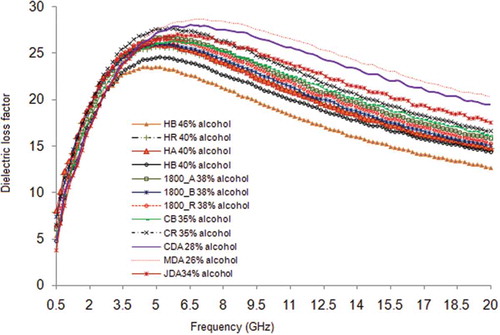
shows the ε″ of different types of tequila versus frequency. The graphs exhibited an inverted-U shape behavior, where the loss increased from 500 MHz to about 5 GHz and then it started decreasing for higher frequencies. The spirits with a lower alcohol content had the highest loss (p < 0.05). The distilled spirit with 26% alcohol had the maximum loss, which was ε″ = 28 at around 7 GHz, followed by the spirit with 28% alcohol (ε″ = 26) at around 6.5 GHz. For a higher alcohol content, the ε″ value was lower, and also, the frequency at which this maximum was achieved was also lower. The lowest value was observed for the sample with the highest alcohol content (46%) with a maximum of ε″ = 23 at 5 GHz (p < 0.05).
Figure 2. Dielectric loss factor of tequilas and agave-distilled spirits with different alcohol contents at room temperature.
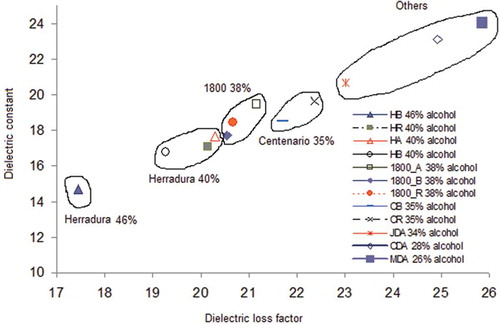
For comparison purposes, the real versus imaginary parts were plotted at 10 GHz. The results are shown in . As can be seen in the graph, there were clear differences in permittivity values depending on the alcohol content. First, for agave-distilled spirits, the ε′ values were higher as their alcohol content was lower. The lowest ε′ value (14.7) was found for tequila with 46% alcohol, and the highest was for the sample with 26% alcohol (ε′ = 24). By grouping the readings in terms of alcohol content, we found that tequilas with 40% of alcohol were at the lower end of the graph with readings ranging from ε′ = 16.8 to ε′ = 17.65. Tequilas with 38% alcohol ranged from ε′ = 17.7 to ε′ = 19.4 and tequilas with 35% alcohol had values from 18.5 to 19.6. Moreover, we could also identify tequila aging. When comparing the same brands with the same alcohol content, we found that extra-aged tequilas had higher ε′ values, whereas silver tequilas (without the aging process) had lower ε′ values. Tequilas with 40% alcohol had ε′ = 16.8 for the silver version, the aged tequila had ε′ = 17, and the extra-aged one had ε′ = 17.65. Tequilas with 38% alcohol presented ε′ = 17.7 (silver), ε′ = 18.4 (aged), and ε′ = 19.4 (extra-aged). Finally, for tequilas with 35% ethanol, the values were ε′ = 18.5 (silver) and ε′ = 19.6 (aged). This can be explained due to the larger amount of ethyl esters in the longer-aged tequilas due to the esterification of fatty acids.[Citation20] Aging differences in the optical regime were also found in reference.[Citation9]
Figure 3. Dielectric constant versus dielectric loss factor at 10 GHz.
From these results, the empirical relationship for ε′ versus alcohol content was obtained. This is plotted in . As can be seen, increasing alcohol content corresponds to decreasing ε′. By curve fitting we obtain Eq. (4), where the correlation coefficient is RCitation2 = 0.9529.
Figure 4. Linear trend between ε′ and ε″ versus alcohol content.
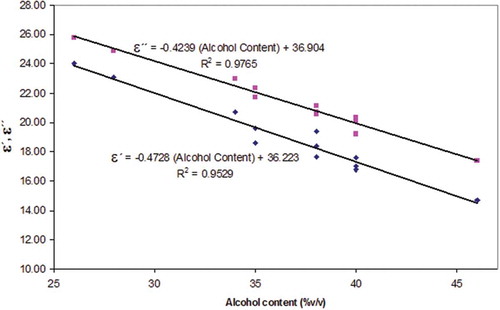
These differences were also identified in ε″. Silver tequilas had the lowest ε″ values for the same brand and the same alcohol content, in comparison to the highest value for the extra-aged tequila. For tequilas with 40% ethanol, silver had ε″ = 19.2, aged had ε″ = 20.1, and extra-aged had ε″ = 20.3. For tequilas with 38% ethanol, its non-aged version (silver) showed ε″ = 20.5, aged ε″ = 20.6, and extra-aged ε″ = 21.1. Finally, for tequila with 35% ethanol, silver had ε″ = 21.7 and aged ε″ = 22.3. The lowest overall value (ε″ = 17.4) was found for the silver tequila with 46% alcohol, whereas the highest value (ε″ = 25.8) was found for the agave-distilled spirit with 26% alcohol. Generally, agave-distilled tequilas presented higher loss due to their lower alcohol content and higher water content (p < 0.05), which is in agreement with the findings reported by Bohigas and Tejada[Citation21] for alcoholic beverages and ethanol solutions. The empirical relationship between ε″ and alcohol content is shown in . A linear trend was observed following Eq. (5), where the correlation coefficient is greater than 0.97.
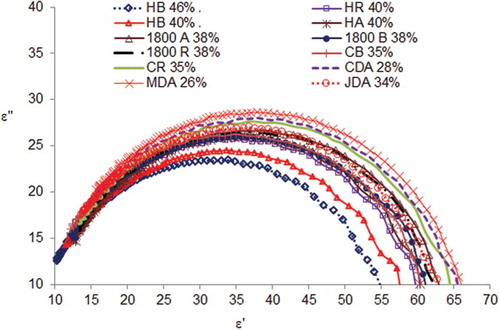
Cole–Cole analysis
A Cole–Cole graph can be obtained by plotting the imaginary part of ε′ versus the real part. This plot is useful to define if a system has a single τ, as well as for finding the values of and εs.[Citation22] These results are shown in . According to Debye’s expression for ε′ (Eq. 2),
and εs may be obtained from the intersection of the curve with the ε′ axis. The summit corresponds to τ.[Citation22] Therefore, these values were calculated from the Cole–Cole diagram and are presented in . The values of εs varied from 55 to 65.1, whereas ε′(s) converged at lower frequencies to about 8.5. The values of τ were between τ = 21.9 and τ = 36 ps, and the relaxation frequency was between 4.42 and 7.27 GHz, which are very similar to those reported for other alcoholic beverages and aqueous alcoholic solutions.[Citation21]
Table 2. Static dielectric constant (εs), dielectric constant (), and relaxation time (τ) from Debye’s equation, and relaxation frequency (fR) for tequilas and agave-distilled spirits.
Figure 5. Cole–Cole diagram for tequilas and agave-distilled spirits at room temperature.
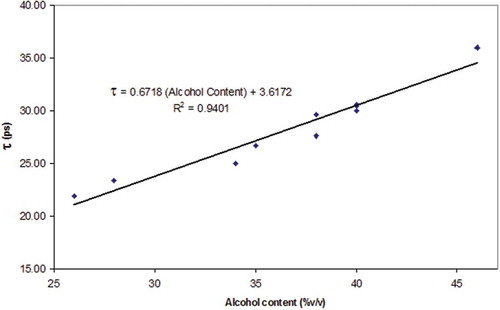
Furthermore, using these values, the alcohol contents of tequila and distilled agave spirits were correlated to τ as shown in . As can be seen, there is a linear trend between these variables. The lowest value was found to be τ = 21.9 ps for 25% alcohol, and the highest was τ = 36 ps for 46% alcohol. By using curve fitting we obtained the following relationship, where the correlation coefficient is RCitation2 = 0.9401
Figure 6. Relaxation time versus alcohol content.
Conclusion
In this paper, we presented the dielectric properties of different types of tequila and agave-distilled spirits from 500 MHz to 20 GHz using an open-ended coaxial probe. This method showed the potential of identifying alcohol content and different aging of tequila beverages. From these results we found a linear trend where ε′ increased as the alcohol content decreased. In addition, for the same alcohol content spirits, longer aging produced higher ε′ values. The ε″ exhibited an inverted-U shape behavior, where the loss increased from 500 MHz to about 5 GHz and then it started decreasing for higher frequencies. The ε″ was higher for the samples with a lower alcohol content, showing a linear relationship at 10 GHz. Furthermore, aging was also verified as longer aging resulted in higher loss. Finally, it was observed that there was a linear correlation between alcohol content and τ, where lower τ corresponds to lower ethanol content.
Funding
The authors thank the financial support from CONACyT (Consejo Nacional de Ciencia y Tecnología, Mexico) for Project 180061 and PRODEP-NPTC UGTO 543/2016.
Additional information
Funding
Related Research Data
References
- The Economist: Highest Consumption of Selected Spirits. http://www.economist.com/blogs/graphicdetail/2013/06/daily-chart-9 2013 (accessed on 10 January 2016).
- Bowen, S.; Valenzuela Zapata, A. Geographical Indications, Terroir, and Socioeconomic and Ecological Sustainability: The Case of Tequila. Journal of Rural Studies 2009, 25(1), 108–119.
- Consejo Regulador del Tequila. http://www.crt.org.mx 2016 (accessed on 10 January 2016).
- Mexican Association of Tequila. htttp://acamextequila.com.mx 2016 (accessed on 10 January 2016).
- AOAC International. Official Methods of Analysis; 18th ed.; AOAC International: Gaithersburg, MD, 2000.
- Barbosa-García, O.; Ramos-Ortiz, G.; Maldonado, J.L.; Pichardo-Molina, J.L.; Meneses-Nava, M.A.; Landgrave, J.E.A.; Cervantes-Martínez, J. UV–Vis Absorption Spectroscopy and Multivariate Analysis as a Method to Discriminate Tequila. Spectrochimica Acta Part A: Molecular and Biomolecular Spectroscopy 2007, 66(1), 129–134.
- Bauer-Christoph, C.; Christoph, N.; Aguilar-Cisneros, B.O.; López, M.G.; Richling, E.; Rossmann, P. Authentication of Tequila by Gas Chromatography and Stable Isotope Ratio Analyses. European Food Research and Technology 2003, 217(5), 438–443.
- Ceballos-Magaña, S.G.; Jurado, J.M.; Martín, M.J.; Pablos, F. Quantitation of Twelve Metals in Tequila and Mezcal Spirits as Authenticity Parameters. Journal of Agricultural and Food Chemistry 2009, 57(4), 1372–1376.
- Luna-Moreno, D.; Monzón-Hernández, D.; Noé-Arias, E.; Regalado, L.E. Determination of Quality and Adulteration of Tequila through the Use of Surface Plasmon Resonance. Applied Optics 2012, 51(21), 5161–5167.
- Fraustro-Reyes, C.; Medina-Gutierrez, C.; Sato-Berru, R.; Sahagún, L.R. Qualitative Study of Ethanol Content in Tequilas by Raman Spectroscopy and Principal Component Analysis. Spectrochimica Acta Part A: Molecular and Biomolecular Spectroscopy 2005, 61(11–12), 2657–2662.
- Lachenmeier, D.W.; Richling, E.; López, M.G.; Frank, W.; Schreier, P. Multivariate Analysis of FTIR and Ion Chromatographic Data for the Quality Control of Tequila. Journal of Agricultural and Food Chemistry 2005, 53(6), 2151–2157.
- Muñoz-Rodríguez, D.; Wrobel, K.; Wrobel, K. Determination of Aldehydes in Tequila by High-Performance Liquid Chromatography with 2,4-Dinitrophenylhydrazine Derivatization. European Food Research and Technology 2008, 221(6), 798–802.
- Yuan, W.; Ho, H.P.; Suen, Y.K.; Kong, S.K.; Lin, C. Improving the Sensitivity Limit of Surface Plasmon Resonant Biosensors by Detecting Mixed Interference Signals. Applied Optics 2007, 46(33), 8068–8073.
- Gupta, G.; Sugimoto, M.; Matsui, Y.; Kondoh, J. Use of a Low Index Prism in Surface Plasmon Resonance Biosensing. Sensors and Actuators B: Chemical 2008, 130(2), 689–695.
- Coronel, P.; Simunovic, J.; Sandeep, K.P.; Kumar, P. Dielectric Properties of Pumpable Food Materials at 915 MHz. International Journal of Food Properties 2008, 11(3), 508–518.
- Zhu, X.; Guo, W.; Jia, Y. Temperature-dependent Dielectric Properties of Raw Cow’s and Goat’s Milk from 10 to 4,500 Mhz Relevant to Radio-frequency and Microwave Pasteurization Process. Food and Bioprocess Technology 2014, 7(6), 1830–1839.
- Lombardo, R.; Rubino, T.; Cammalleri, M. Dielectric Characterization of Fruit Nectars at Low RF Frequencies. International Journal of Food Properties 2015, 18(10), 2312–2326.
- Kataria, T.K.; Olvera-Cervantes, J.L.; Corona-Chávez, A.; Rojas-Laguna, R.; Sosa-Morales, M.E. Dielectric Properties of Guava, Mamey Sapote, Prickly Pears and Nopal in the Microwave Range. International Journal of Food Properties 2017. doi:10.1080/10942912.2016.1261154
- Martínez-López, G.; Luna-Moreno, D.; Monzón-Hernández, D.; Valdivia-Hernández, R. Optical Method to Differentiate Tequilas Based on Angular Modulation Surface Plasmon Resonance. Optics and Lasers in Engineering 2011, 49, 675–679.
- Vallejo-Córdoba, B.; González-Córdoba, A.F.; Estrada-Montoya, M.C. Tequila Volatile Characterization and Ethylester Determination by Solid Phase Microextraction Gas Chromatography/Mass Spectrometry Analysis. Journal of Agricultural and Food Chemistry 2004, 52, 5567–5571.
- Bohigas, X.; Tejada, J. Dielectric Characterization of Alcoholic Beverages and Solutions of Ethanol in Water under Microwave Radiation in the 1–20 Ghz Range. Food Research International 2010, 43, 1607–1613.
- Vander Vorst, A.; Rosen, A.; Kotsuka, Y. RF/Microwave Interaction with Biological Tissues; Vol. 181; John Wiley & Sons, New Jersey, United States, 2006.