
ABSTRACT
The goal of this research was to develop dynamic predictive models for five alkaloids in Coptis during the process of stir-frying with wine by near-infrared spectroscopy (NIR). Six batches of samples were collected and then processed on the basis of orthogonal design. With high-performance liquid chromatography (HPLC) analysis as reference, calibration models were generated by a partial least squares (PLS) regression. The root mean square errors of prediction (RMSEP) for the PLS models of jatrorrhizine, epiberberine, coptisine, palmatine, and berberine were 0.0030, 0.0387, 0.0206, 0.0095, and 0.0516, and the correlation coefficients (R) were 99.43%, 98.41%, 99.29%, 99.23%, and 99.87%, respectively. Accordingly, these results demonstrated that the models could be efficiently used to develop robust methods of online analysis and quality control for Coptis.
Introduction
Currently, traditional Chinese medicines (TCMs) still play an important role in the treatment and prevention of human diseases. The safety, effectiveness, and quality of processed TCMs have attracted worldwide attention.[Citation1] As a type of TCM, Coptis has many medicinal values and is widely used in clinical care.[Citation2] Coptis is derived from the dried roots of Coptis chinensis Franch., Coptis deltoidea C. Y. Cheng et Hsiao and Coptis teeta Wall., which are called “Wei Lian”, “Ya Lian”, and “Yun Lian” in Chinese, respectively.[Citation3] Modern pharmacological studies have shown that Coptis has multiple pharmacological effects such as dissipating heat and drying dampness, easing disturbed states of mind, and purging fire to eliminate toxins.[Citation4-Citation6] Generally, Coptis needs to be processed before use because Coptis is strongly bitter and cold, which can be alleviated in processed Coptis. At present, there are several methods to process Coptis. One of the most popular is stir-frying with wine, which means soaking the Coptis in rice wine for several minutes and then stir-frying it to dryness.[Citation2,Citation3]
Along with the process of stir-frying with wine, the main chemical constituents of Coptis are in constant flux. As has been reported, Coptis is rich in alkaloids, including jatrorrhizine, epiberberine, coptisine, palmatine, and berberine, which are considered the major active constituents and quality control targets for Coptis.[Citation7,Citation8] To date, several conventional methods, for example, high-performance liquid chromatography (HPLC), have been reported for the qualitative and quantitative analysis of extracts and their active components in Coptis.[Citation9,Citation10] However, in these methods, Coptis must be removed from the process of stir-frying with wine, and the samples require tedious pretreatment and time-consuming analysis.[Citation11] In addition, Coptis in different processed states has different contents of the five alkaloids. Therefore, it is necessary to determine a method that can rapidly online monitor the variation of the contents during the stir-frying process.
Near-infrared spectroscopy (NIR) coupled with chemometrics is a quick, accurate, and non-destructive analytical tool, which can be considered as a replacement for traditional chemical analysis. As it possesses advantages of fast acquisition, no sample preparation, noninvasiveness, nondestructiveness, and simultaneous determination, NIR spectroscopy with fiberoptic probes has been widely used in qualitative discrimination, quantitative determination, identifying counterfeits and forecasting the stability of TCMs, among other applications.[Citation12–Citation19] This is the first study using NIR to simultaneously analyse these five alkaloids in Coptis during the process of stir-frying with wine.
The purpose of this study was to evaluate the possibilities of rapid dynamic quantitative analysis of jatrorrhizine, epiberberine, coptisine, palmatine, and berberine in Coptis during the process of stir-frying with wine by NIR. Firstly, 155 samples of raw Coptis were processed with rice wine as per the results of an orthogonal design. Secondly, the processed Coptis samples were detected by NIR. Then, calibration models generated by partial least squares (PLS) of the five alkaloids were established based on the NIR spectra and the reference data collected from HPLC. Finally, the validation set was used to validate the predictive ability of the optimized PLS models. This study was performed as a laboratory simulation intended for subsequent use in rapid online analysis and quality control to monitor the industrial process of stir-frying Coptis with wine.
Materials and methods
Materials and reagents
Six batches of Coptis were obtained from different provinces of China. Jatrorrhizine hydrochloride (batch no.W1900010), epiberberine (batch no.W0400010), coptisine hydrochloride (batch no.W2160010), palmatine (batch no.W0410010), and berberine hydrochloride standards (batch no.R3550010) were obtained from the ANPEL Scientific Instrument Company (Shanghai, PR China). Rice wine was purchased from the Kuaijishan Shaoxing Wine Company (Zhejiang, PR China). HPLC-grade acetonitrile was obtained from the Tianjin Kermel Chemical Reagent Company (Tianjin, PR China). Water was purified by an ultrapure water system. All the other reagents were of analytical grade.
Sample preparation
The 25 different Coptis processing methods were generated by the orthogonal design method and are shown in . Coptis slices weighing 80 g were mixed with the appropriate quantity of rice wine and stir-fried to homogeneity. After the rice wine was absorbed by Coptis for different periods, the slices were placed into a stir-fry vessel and heated at the designed temperature controlled by an infrared thermometer (GM320, BENETECH, PR China) for 6 min. Next, the processed Coptis were removed, cooled, and ground by a grinder. Finally, the small fragments were screened. In this study, six batches were used, and 155 samples were collected.
Table 1. Orthogonal design of processed Coptis.
Spectra acquisition
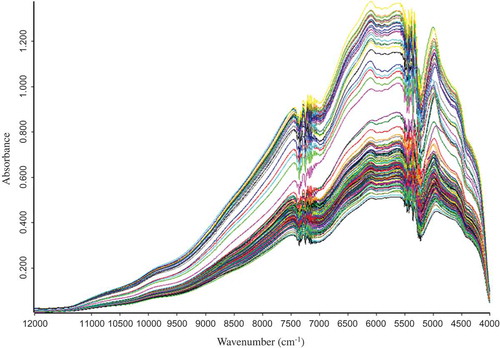
The NIR spectra of processed Coptis samples, shown in , were recorded by a Quas-IR 3000 spectrometer (Vspec, USA) equipped with a PbS detector, sample cup and rotary tables. The spectra were obtained at a resolution of 8 cm−Citation1 over a wavelength range of 12000–4000 cm−Citation1 with 32 scans per spectrum, and air absorbance was recorded as the reference standard. To avoid error from the external environment, all samples were equilibrated to indoor temperature (25°C) prior to NIR analysis. In addition, the humidity was kept at the ambient level in the laboratory.
Figure 1. Near‑infrared spectra of Coptis samples.
Determination of reference values
Using the Chinese Pharmacopoeia (volume I, 2015 edition), the reference values were analysed immediately after the NIR measurements.Citation3 An 1100 HPLC system (Agilent Technologies Inc., USA) containing an ultraviolet–visible detector was used for the quantitative determination of the alkaloids at a wavelength of 345 nm. A Kromasil (Akzo Nobel Inc., Sweden) C18 column (250 mm × 4.6 mm, 5 μm) was employed at 35°C. The elution system was composed of acetonitrile–water (50:50) containing 50 mmol/L of monopotassium phosphate and 25 mmol/L of sodium dodecyl sulfate (SDS) at a flow rate of 1.0 mL/min. The sample aliquots (10 μL) were injected into the HPLC for content analysis.
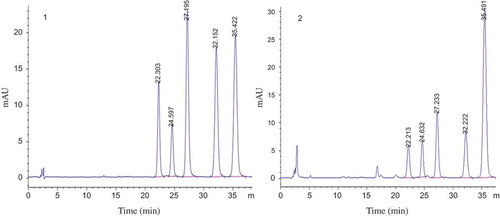
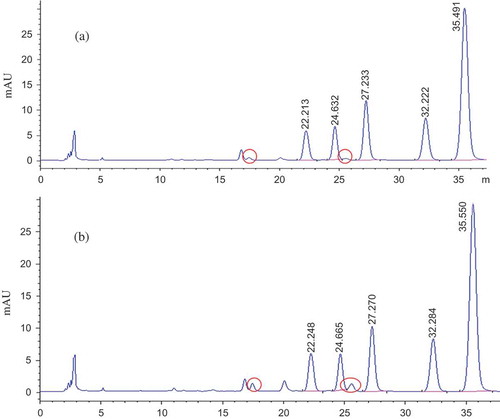
All 155 samples were analysed by the above-mentioned HPLC method. Representative HPLC chromatograms of the standard solution (five alkaloids) and the processed Coptis sample solution are shown in . Baseline separation for all five alkaloids could be achieved successfully. The chromatographic peaks were identified by comparing their retention times against known standard peaks.
Figure 2. HPLC results of standard substance (a) and processed Coptis sample (b) Peak No.: 1. Jateorrhizine; 2. Epiberberine; 3. Coptisine; 4. Palmatine; and 5. Berberine.
Data processing
All the computations, including data acquisition, spectral preprocessing, variable selection, chemometric regression models construction and validation were performed using OPUS spectral acquisition and processing software (Operant LLC Licensed to MTG, USA).
Results and discussion
Quantitative calibration models
Division of calibration and validation set: Among the 155 samples, 1 out of 5 was selected randomly for validation analysis, and thus, 31 samples were selected into the validation set to validate the PLS models, and the remaining 124 samples were used as the calibration set to establish the calibration models.[Citation20]
Optimizing the calibration models using the PLS method
Spectral pretreatment methods: To gather full and effective information from the spectral data and eliminate noise, baseline shift, and matrix background interference, the spectra must be preprocessed.Citation15 In this study, different optimization methods were implemented by the OPUS software including Constant Offset Elimination(COE), Straight Line Subtraction (SLS), Vector Normalization (VN), Min Max Normalization (MMN), Multiplicative Scatter Correction (MSC), First Derivative, Second Derivative, First Derivative + SLS, First Derivative + VN and First Derivative + MSC.
The PLS methods must be computed for each number of components, and the optimum factors for the calibration set were selected based on the correlation coefficients of the calibration set (Rcal), the root mean square errors of cross-validation (RMSECV), and the residual predictive deviations (RPD). The models with the best prediction ability are usually selected on the basis of the root mean square error (RMSEP) and the correlation coefficients of the validation set (Rval).[Citation21,Citation22] Calibration models with the highest R and RPD as well as the lowest RMSECV are considered optimal. OPUS could determine the values of R, RPD, RMSECV and RMSEP, and then, the best spectral pretreatment methods were chosen according to these values. The results obtained with different preprocessing methods are shown in .
Table 2. Results obtained with different spectral pretreatment methods.
Spectral region and factors: In the complex system, it was difficult to use a classical univariate parameter for quantitative analysis. Therefore, the spectral region and PLS factors were chosen as two other standard parameters to optimize the calibration models.
One or several wavelengths related to alkaloids cannot be found in the NIR spectra because of the interferences of other components, so a spectral region rich in chemical information is usually used to establish the calibration models. The PLS method of OPUS is a powerful multivariate calibration method to recommend the appropriate spectral region. shows the appropriate spectral regions for the NIR models.
Table 3. Parameters of different spectral regions in PLS models.
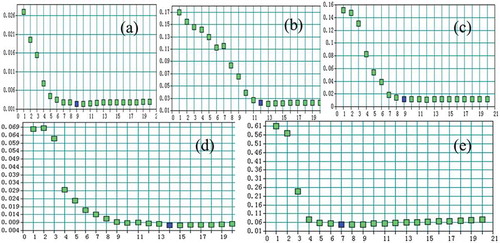
In the PLS method, the number of PLS factors (F) would directly affect the predictive ability of the calibration models. Not enough information would be obtained from the spectrum when F is too small, and the actual information would be misrepresented or ‘‘over fitted’’ when F is too large. OPUS is successful in recommending the ideal F according to the criteria of the best calibration. shows the relation between the RMSECV values (y-axis) and F (x-axis). When F>7, the RMSECV value of jatrorrhizine became gradual and tended to be stable, so the ideal F for jatrorrhizine PLS model was 7; the ideal F for epiberberine, coptisine, palmatine and berberine were 12, 9, 10, 7, respectively. Apparently, the given ideal F in and are clearly “over fitted”, so the smaller 7 of jatrorrhizine and 10 of palmatine were chosen.
With PLS regression, the calibration models were finally optimized individually by spectral pretreatment methods, spectral range, and F.
Figure 3. Parameters of the number of model factors by RMSECV: (a) Jatrorrhizine,(b) Epiberberine, (c) Coptisine,(d) Palmatine, (e) Berberine.
Results and verification of the quantitative models
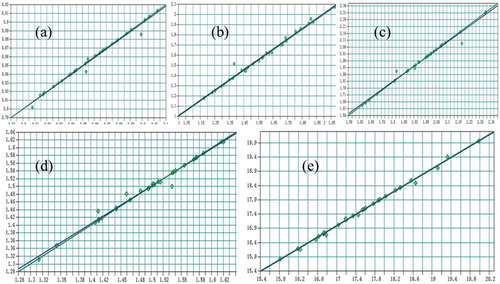
The validation set is used to validate the predictive ability of the optimized PLS models. Following the procedures mentioned above, the calibration models of the five alkaloids were established in this study, and the above optimized models were used to predict the contents of the 31 samples in the validation set. The results in show that the established models gave satisfactory fitting results and predictive ability and could be applied to monitor the contents of the five alkaloids in Coptis during stir-frying with wine. shows the correlation between the NIR predicted values (y-axis) and the reference values (x-axis) obtained by HPLC. The RMSEP and Rval of the validation set suggested that the predicted values from NIR are very close to the values determined by HPLC. However, deviations still existed in a few samples because the pretreatment process of Coptis was quite complex and Coptis was not completely uniform during HPLC determination and NIR spectrum collection. The T and F tests for the predicted result indicated that the accuracy and precision were satisfactory with a significance level of 0.05.
Table 4. Parameters of optimal models and validation results.
Figure 4. Relations of values measured by HPLC and the five alkaloids models: (a) Jatrorrhizine, (b) Epiberberine, (c) Coptisine, (d) Palmatine, (e) Berberine.
Discussion of the process of stir-frying Coptis with wine
Based on the results calculated by the orthogonal design assistant SPSS 11.5, as shown in , we found that the sequences of every factor and level in affecting the processed results were A3>A4>A5>A2>A1; B3>B1>B4>B2>B5; and C3>C4>C2>C5>C1. The results of variance analysis of each factor indicated that the stir-fried temperature was the most important factor, the rice wine content was the second most important factor and the sealed moistening time was the least important factor. Therefore, the optimized method for processing was C3A3B3. In other words, the optimized method was to add 15% (v/v) rice wine to 80 g of Coptis, seal for 2 h to moisten, and stir-fry at 160°C for 6 min, which was in accordance with the Chinese Pharmacopoeia.
Table 5. Statistical table of single factors created by SPSS. Dependent Variable: Content of total alkaloids.
The results also showed that different processing extents led to different contents of alkaloids in Coptis. Comparing the alkaloids contents of raw and processed Coptis, it can be observed that the contents of palmatine and berberine increased notably after processing, while the contents of epiberberine and coptisine decreased and the content of jatrorrhizine had no clear change, which indicated that the processing method does affect the chemical components in Coptis, but the mechanism requires further study.
In addition, as shown in , there were two new chromatographic peaks of unknown components generated during the process of stir-frying Coptis with wine. Further study is required to determine whether these new components are transformed from epiberberine and coptisine. It also requires further study whether these new components have any relations to the traditional saying “processed Coptis can ease the cold property of raw Coptis” or have any other new pharmacological effects.
Figure 5. HPLC results of raw (a) and processed Coptis (b).
Conclusion
In this study, six batches of samples, which were processed according to the results of an orthogonal design setting different contents of rice wine, sealed moistening time, and stir-fry temperature, were surveyed by NIR spectroscopy, and models were built by means of PLS. Their main parameters were also discussed in detail. The root mean square errors of prediction (RMSEP) for the PLS models of jatrorrhizine, epiberberine, coptisine, palmatine, and berberine were 0.0030, 0.0387, 0.0206, 0.0095, and 0.0516 and their correlation coefficients (R) were 99.43%, 98.41%, 99.29%, 99.23%, and 99.87%, respectively. The overall results showed that NIR spectroscopy combined with PLS provided reliable, stable and efficient analysis for jatrorrhizine, epiberberine, coptisine, palmatine, and berberine in Coptis during the process of stir-frying with wine and showed great promise for use in industrial manufacturing processes for rapid online analysis and quality control.
Declaration of interest
The authors declare that there is no conflict of interest.
Acknowledgements
The authors thank Sichuan Vspec Technologies Company, who provided the instruments and analysis instruction.
Funding
The authors graciously acknowledge the financial support provided by the National Sciences Foundation of PR China (No.81373969) and the University Key Research Projects of Henan Province (No. 17A360026).
Additional information
Funding
Related Research Data
References
- Dai, S.; Xu, B.; Zhang, Y.; Li, J.; Sun, F.; Shi, X.; Qiao, Y. Establishment and Reliability Evaluation of the Design Space for HPLC Analysis of Six Alkaloids in Coptis chinensis (Huanglian) Using Bayesian Approach. Chinese Journal of Natural Medicines. 2016, 14, 697−708.
- Yang, J.; Liu, Z.; Liu, B.; Zhu, Q. Determination of Coptis Chinensis’ Quality by FT-NIR Spectroscopy. Health. 2012, 4, 196–202
- China Pharmacopoeia Committee. Pharmacopoeia of the People’s Republic of China. China; Medical Science Press: Beijing, 2015.
- Prieto, J.M.; Recio, M.C.; Giner, R.M.; Máñez, S.; Giner-larza, E.M.; Ríos, J.L. Influence of Traditional Chinese Anti-Inflammatory Medicinal Plants on Leukocyte Andplatelet Functions. Journal of Pharmacy and Pharmacology. 2003, 55, 1275–1282.
- Wang, H.; Zhang, F.; Ye, F.; Ma, Y.; Zhang, D.Y. The Effect of Coptis chinensis on the Signaling Network in the Squamous Carcinoma Cells. Frontiers in Bioscience. 2011, 3, 326–340.
- Chin, L.; Cheng, Y.; Lin, S.; Lai, Y.; Lin, L.; Chou, M.Y.; Chou, M.C.; Yang, C. Anti-herpes simplex virus effects of berberine from Coptidis rhizoma, a major component of a Chinese herbal medicine, Ching-Wei-San. Archives of Virology. 2010, 155, 1933–1941.
- Sun, J.; Ma, J.S.; Jin, J.; Wang, H.S.; Wen, Q.H.; Zhang, H.G.; Zhou, Q.L. Qualitative and quantitative determination of the main components of huanglianjiedu decoction by HPLC-UV/MS. Acta Pharmacologica Sinica. 2006, 41, 380–384.
- Qiao, Y.L.; Sheng, Y.X.; Wang, L.Q.; Zhang, J.L. Development of a Rapid Resolution Liquid Chromatographic Method for Simultaneous Analysis of Four Alkaloids in Rhizoma coptidis Under Different Cultivation Conditions. Journal of Aoac International 2009, 92, 663–671.
- Liu, L.; Chen, Z. Analysis of Four Alkaloids of Coptis chinensis in Rat Plasma by High Performance Liquid Chromatography with Electrochemical Detection. Analytica Chimica Acta 2012, 737, 99–104.
- Liu, X.; Hu, S.; Chen, X.; Bai, X. Hollow Fiber Cell Fishing with High-Performance Liquid Chromatography for Rapid Screening and Analysis of an Antitumor-Active Protoberberine Alkaloid Group from Coptis chinensis. Journal of Pharmaceutical and Biomedical Analysis 2014, 98C, 463–475.
- Zhang, Y.; Xie, Y.F.; Song, F.R.; Liu, Z.Q.; Cong, Q.; Zhao, B. Quantitative Analysis of Berberine in Processed Coptis by Near-Infrared Diffuse Reflectance Spectroscopy. Chemical Research in Chinese Universities 2008, 24, 717–721
- Stenlund, H.; Johansson, E.; Gottfries, J.; Trygg, J. Unlocking Interpretation in Near Infrared Multivariate Calibrations by Orthogonal Partial Least Squares. Analytical Chemistry 2009, 81, 203–209.
- Andersson, M.; Folestad, S.; Gottfries, J.; Johansson, M. O.; Josefson, M.; Wahlund, K. G. Quantitative Analysis of Film Coating in a Fluidized Bed Process by In-line NIR Spectrometry and Multivariate Batch Calibration. Analytical Chemistry 2000, 72, 2099–2108.
- Xue, J.T.; Wu, C.J.; Wang, L.L.; Zhang, J.L.; Huang, G.; Jiang, S.; Wen, S.L.; Liang, Y.; Chao, R.B.; Chen, C.; Ye, L.M. Identification of the Types of Parched Areca Seed by Near Infrared Spectroscopy. Asian Journal of Chemistry 2012, 24, 822–826.
- Xue, J.; Wu, J.; Wang, L.; Jiang, S.; Huang, G.; Zhang, J.; Wen, S.; Ye, L. Dynamic Prediction Models for Alkaloid Content Using NIR Technology for the Study and Online Analysis of Parching in Areca Seed. Food Chemistry 2011, 126, 725–730.
- Wang, P.; Zhang, H.; Yang, H.; Nie, L.; Zang. H. Rapid Determination of Major Bioactive Isoflavonoid Compounds during the Extraction Process of kudzu (Pueraria lobata) by Near-Infrared Transmission Spectroscopy. Spectrochimica Acta Part A Molecular & Biomolecular Spectroscopy 2015, 137C, 1403–1408.
- Lau, C.; Chan, C.; Chau, F.; Mok, D. Rapid analysis of radix puerariae by near-infrared spectroscopy. Journal of Chromatography A 2009, 1216, 2130–2135.
- Wu, Y.; Sun, S.; Zhou, Q. Fourier Transform Mid-Infrared (MIR) and Near-Infrared (NIR) Spectroscopy for Rapid Quality Assessment of Chinese Medicine Preparation Honghua Oil. Journal of Pharmaceutical and Biomedical Aanalysis 2008, 46, 498–504.
- Qu, H.; Liu, Q.; Cheng, Y. Determination of the Coptis Extract Alkaloids Using Near-Infrared Diffuse Reflectance Spectroscopy. Chinese Journal of Analytical Chemistry 2004, 32, 477–480.
- Xue, J.; Han, C.;Xiong, D.; Huang, G.; Hong, A.; Liang, Y.; Yan, X.; Gan, Y.; Chen, C.; Chao, R.; Ye, L. Noninvasive Measurement of Glucose in Artificial Plasma with Near-Infrared and Raman Spectroscopy. Journal of Applied Spectroscopy 2014, 68, 428–433.
- Niu, X.; Zhao, Z.; Jia, K.; Li, X. A Feasibility Study on Quantitative Analysis of Glucose and Fructose in Lotus Root Powder by FT-NIR Spectroscopy and Chemometrics. Food Chemistry 2012, 133, 592–597.
- Sivakesava, S.; Irudayaraj, J.; Ali, D. Simultaneous Determination of Multiple Components in Lactic Acid Fermentation Using FT-MIR, NIR, and FT-Raman Spectroscopic Techniques. Process Biochemistry 2001, 37, 371–378.