
ABSTRACT
In this study, a method for the quantitative determination of rice starch based on hyperspectral imaging technology was proposed. First, the hyperspectral imaging system in the spectral range of 871–1766 nm was used to collect the hyperspectral images of 100 rice samples of 10 starch grades. The support vector regression (SVR) model was established to determine the starch content by using full-wavelength spectra data. Among all the models, the SVR-principal component analysis (SVR-PCA) model with the Radial Basis Function showed the best results. To simplify the calibration model, PCA was used for feature extraction and the cumulative contribution rate of the first six principal components reached 99%, which could reflect most of the information of the full spectra data. Three new regression models based on the selected wavelengths were developed and the results were improved obviously. The SVR-PCA model obtained the best accuracy in prediction and calibration with the determination coefficients of prediction (R2p) of 0.991, root mean square error of prediction (RMSEP) of 0.669%, the determination coefficients of calibration (R2c) of 0.989, and root mean square error of calibration (RMSEC) of 0.445%. The overall results from this study demonstrated that the hyperspectral image technology is feasible to detect rice starch.
Introduction
More than half of the population consumes rice as the staple food in the world, which possesses a great amount of starch, protein, fat, and some nutrient elements,[Citation1,Citation2] and it remains the most important source of nutrition and calories for people in Asian countries. With the global tight supply of rice, rice reserves have begun to be valued. There is increasing scholarly awareness that ‘food insecurity’ is one of the most critical and complex issues facing the East Asian region, and indeed the world.[Citation3,Citation4] Therefore, promoting rice quality and yield is closely related not only to people’s living conditions but also to the major response for ensuring world food security given the extreme climate change and huge population growth.[Citation5] Rice starch, which appropriately occupies 80% of the whole rice grain, plays an important role in nutrition and cooking rice quality through its internal structure and physicochemical properties.[Citation6]
Rice starch is a common raw material used in either food or nonfood industries. Accurately and quickly detecting the starch content of storage rice is very important. However, traditional methods for the identification of rice starch mainly focus on the appearance of rice and depend on the feelings of professionals, which are tedious, time-consuming, expensive, and greatly influenced by subjective factors. Therefore, there is great interest to develop an effective method for the rapid, precise, and nondestructive identification of rice starch. Hyperspectral imaging is an emerging technology that integrates the advantages of conventional digital imaging and spectroscopy technology in a single system to simultaneously obtain both image and spectral information from an object.[Citation7–Citation9] Compared with single imaging or spectroscopy technology, hyperspectral imaging can provide more details for exploring the relationship among hyperspectral data of different objects.
Rice is composed of carbon, hydrogen, oxygen, nitrogen, and other organic molecules; the vibrational frequencies of these molecules are in the near-infrared region of the electromagnetic spectrum. Therefore, different matter can produce the characteristic absorption to the near-infrared radiation, and the absorption intensity of different bands has a corresponding relationship with the molecular structure and concentration of this matter.[Citation10] This is the theoretical basis of near-infrared spectroscopy analysis to analyse the content of some components in the sample. Therefore, a growing number of researchers devoted themselves to using hyperspectral imaging technology as a powerful tool for the detection of food, crops, or other products.[Citation11–Citation13] Traditional detection methods are time-consuming, laborious, and their accuracy is low. Hyperspectral imaging technology has the advantages of being nondestructive, rapid, nonpolluting, and so on. In recent years, hyperspectral imaging technology has been reported for the quality and safety of food products, such as vegetables,[Citation14] meat,[Citation15,Citation16] egg,[Citation17] bean,[Citation18] and so on. However, there is no research on the application of quantitative detection of rice starch.
Therefore, in this study, a method for the quantitative determination of rice starch based on hyperspectral imaging technology is proposed. The specific objectives were to (1) acquire hyperspectral images of rice using hyperspectral images in the wavelength range of 871–1766 nm, (2) recognize the region of interest (ROI) of rice and extract the corresponding spectral information from the acquired hyperspectral images, and (3) use original spectral wavelengths and the optimal wavelengths to develop new SVR models and compare their performance.
Materials and methods
Samples preparation
To study the method for the rapid detection of starch content in rice, rice samples with different starch contents should be obtained. In this study, rice samples (Dongbei rice) were purchased from the local Agricultural Market in Zhenjiang, China. All samples were healthy, full, and smooth. First, the rice was loaded into 100 sample dishes (100 g each), all of which were labelled one by one. Then the samples were incubated in a humidity chamber (temperature of 30°C, relative humidity of 90%) according to the appropriate conditions of mold growth. Based on the variation of physicochemical properties and photosensitivity of rice storage with time, the cultivation stage was divided into 10 cycles (30 d each). The national standard “GB/T 5009.9–2008” (determination of starch content in foods) was used to measure the starch content of rice. shows the content of starch of the rice.
Table 1. Starch content of rice samples in different cycles.
The principle of acid hydrolysis: After the fat of the sample was removed by ether, the soluble sugar was removed by ethanol, the starch was hydrolysed by acid, and the content of reducing sugar was determined by the method of reducing sugar. The starch content in rice can be calculated as follows:
where X is the starch content (g/100g), A1 is the content of the reducing sugar of the sample hydrolysate, A2 is the quality of reducing sugar in the reagent blank (mg), 0.9 is the conversion coefficient of reducing sugar (glucose meter) into starch, m is the sample quality (g), V is the volume of hydrolysate (mL), and 500 is the total volume of sample solution (mL).
Hyperspectral imaging system
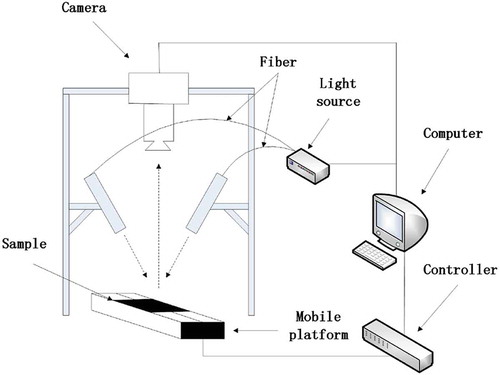
The hyperspectral images of the rice samples were acquired by a hyperspectral system. The hyperspectral data acquisition device is composed of the following five components: (1) a Visible-NIR spectrograph (ImSpector V10E, Spectral Imaging Ltd., Oulu, Finland) in the spectral range of 871–1766 nm with the image resolution of 672 × 512 and a spectral resolution of 2.8 nm, (2) a CCD video camera (DL-604M, Andor, Ireland), (3) an illumination unit, which consists of two 150 W fibre-optical halogen lamps (2900 version, Illumination Technologies, USA), (4) a control box (SC100, Beijing optical instrument factory, China) and an electric displacement platform (MTS120, Beijing optical instrument factory, China), and (5) a computer supported with Spectral-Cube data acquisition software (Spectral Imaging Ltd., Finland). A laboratory hyperspectral imaging system was constructed as shown in .
Figure 1. Hyperspectral imaging system.
Hyperspectral imaging acquisition
Before the experiment of hyperspectral image acquisition, the illumination source of the hyperspectral imaging system had been turned on and preheated for about 30 min for the stable light intensity. To eliminate the influence of dark current noise, the high spectral imaging system needed to carry out calibration, and the exposure time of the camera was adjusted as 20 ms and the moving speed of the displacement platform was set as 1.25 mm/s. During the experiment of hyperspectral imaging acquisition, rice samples were put on the mobile platform. The camera scanned the plane of the whole platform with the advance of the transmission device. The hyperspectral images of 100 rice samples were collected in turn.
In Environment for Visualizing Images (ENVI) software (ITT visual information solutions, Boulder, CO, USA), a rectangular ROI was selected in the centre of each sample. The reflectance spectra of the ROI were extracted and averaged along each band (256 bands) to generate one mean spectrum for each sample. In this study, to collect the spectral information more roundly, all area of the rice samples was selected as the ROI ().
Figure 2. Full procedure for selecting regions of interest.
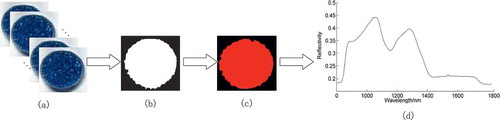
First, figure (a) was obtained from the experimental data by ENVI software. It can be seen from figure (a) that there was a shadow between the rice sample and the background and it was difficult to separate the rice from the background. In this paper, this problem is solved by the ratio method. A high-reflectivity image of rice and a low-reflectivity image of background are selected from the hyperspectral images. The new spectral image was obtained from the high-reflectivity image divided by the low-reflectivity image. Then the background and the rice can be clearly separated by setting the threshold value; the binary image like figure (b) was obtained by threshold processing. Then ENVI software was used for the application mask function to obtain the figure (c). Finally, ROI was used to extract the average spectral data of the whole sample, as shown in figure (d).
Spectral preprocessing
In the course of the experiment, there were a number of undesired effects, such as light scattering, baseline shifts, and random noise. These effects may cause spectral variations, which do not correspond to real responses and influence the robustness of subsequent multivariate calibration models.[Citation19]To address these undesirable effects, spectral data are subjected to pretreatment such as Savitzky–Golay smoothing (SG), least mean square (LMS), standard normal variate (SNV), and wavelet transform (WT). In this study, SNV was used to carry out the preprocessing of the original spectral data. Recently, SNV has been successfully applied in separating overlapping bands, noise removal, smoothing, baseline correction, and removing the multicollinearity effect of multidimensional spectra.[Citation20] All extraction routines were performed using the MATLAB R2009b software (The Mathworks, Inc., Natick, MA, USA).
Selection of optimal wavelengths
Hyperspectral data have a number of features, such as too many wavebands, large amount of data, high redundancy, and so on. However, optimal wavelengths selection, aiming to select only a few wavelengths that carry most of the useful information with minimum collinearity and redundancy from full spectra, is believed to reduce data dimensionality and solve the above-mentioned problems in dealing with hyperspectral image data. Many methods are available for selecting important wavelengths, such as regression coefficients (RC), principal component analysis (PCA), successive projections algorithm (SPA), and genetic algorithm (GA).[Citation21–Citation23]
In this study, PCA was used for wavelength selection. The conventional PCA is a statistical method that focuses on a linear projection of multivariate high dimensional data onto low-dimensional subspace by using least-square decomposition while maintaining the maximum variance [Citation24,Citation25]. PCA aims to find the orthogonal directions of strong variability in data.
Modeling analysis
To identify the starch content grades of rice samples accurately, quantitative models were developed based on the spectral data. Spectral data across the full wavelength range were processed using multivariate analysis to mine feature information related to the reference values of total pigments. A number of multivariate algorithms have been proposed for building quantitative models, such as multiple linear regression (MLR), partial least squares regression (PLSR), support vector regression (SVR), principal component regression (PCR), GAs, least-squares support vector regression (LS-SVR), and others.[Citation25–Citation27] In this study, SVR was used to develop the quantitative model for the starch content of rice.
Support vector machine (SVM) is one of the machine learning methods that has recently become used popularly and widely because of its ability to predict both classification and regression. SVR is derived from the theory of SVM.[Citation28] The basic idea of SVR is to nonlinearly map the input variables into a high dimensional feature space where they are linearly correlated with the output variable. The regression function can be defined in this feature space as follows:
where is the weight vector and b is the bias term. If the insensitive loss function ε is adopted, the aim of SVR is to look for an f(x) that can make the difference between the true and the training values less than the given error ε. Thus, function f(x) solution can be expressed as the following quadratic programming problem:[Citation29]
where and
are the slack variables that determine the upper and lower excess deviations.
is the regularization term, c is the error penalty factor used to regulate the difference between the regularization term and empirical risk, and
is the loss function that determines the accuracy of the training data point. Eq. (1) can be solved by introducing the Lagrange multiplier and optimality constraints. Hence a generic function given by Eq. (4) is obtained:
where and
are Lagrange multipliers, and the nonzero weight samples
and
are called support vectors.
Results and discussion
Spectral features of rice samples
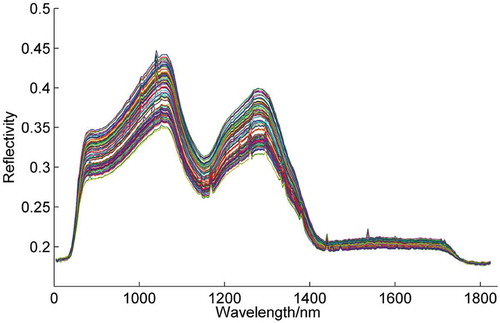
Before the extraction of hyperspectral data, the whole area of the rice samples was selected as the ROI; then the average spectral data of all rice samples were obtained. The spectrum of all samples is shown in . In addition, the differences among the spectral data were greater at the peak of the spectral curve. Therefore, the different starch gradients of rice can be classified according to hyperspectral data.
Figure 3. Raw spectra of rice samples.
Modeling based on full wavelengths
The selection of the best calibration method is important in spectral analysis. The performance of different calibration methods needs to be compared to choose the best. In this study, the 100 samples obtained were split into two groups randomly, 70 samples of which were selected for the calibration set and the rest 30 samples were used as the prediction set.
The SVR model was established to determine the starch content using full-wavelength spectra data that were pretreated by SNV. The SVR model has some common kernel functions, such as the linear kernel function, radial basis function, and sigmoid function. In this study, these three kernel functions had been selected as the kernel function of the SVR. shows the results obtained for calibration and prediction. As shown in , the SVR model with full-wavelength spectra data did not perform well in prediction. The SVR model of sigmoid function shows the lowest result. The SVR model of the linear kernel function performed well both in prediction and in calibration with a high R2p of 0.967, RMSEP of 1.154%, R2c of 0.972, and RMSEC of 0.690%. Among all the models, the SVR model of linear kernel function showed the best results.
Table 2. Results of starch content prediction of rice using the full spectral range.
Modeling based on optimal wavelengths
Although the calibration models based on the whole spectrum achieved good performance, the large number of wavelengths made the data processing time-consuming and inefficient. Therefore, selecting some optimal wavelengths from the full spectral range was necessary. The feature reduction method involves feature selection and feature extraction.
In this study, PCA was applied to select the optimal number of selected wavelengths for the above-mentioned three regression models. PCA was used to analyse the rice sample with the different starch content grades. According to the calculation of the corresponding Eigen value of each wavelength, the first six components had accounted for more than 99% of the variance in the data.
From , the results of three new regression models were improved obviously over the models that were established using full wavelengths. Comparing the three kinds of kernel functions, the Sigmoid Kernel Function did not achieve the desired results: R2p of 0.869, RMSEP of 2.043%, R2c of 0.904, and RMSEC of 1.804%. The best model in prediction and calibration was the SVR-PCA model of radial basis function with R2p of 0.991, RMSEP of 0.669%, R2c of 0.989, and RMSEC of 0.445%. Compared with the results of the best fit model based on full wavelengths, R2p and RMSEP had a little improvement.
Table 3. Results of starch content prediction of rice using the optimal wavelengths.
Conclusion
In this study, a hyperspectral imaging system in the range of 871–1766 nm was successfully used to measure the starch of rice. The average spectral data of rice samples were extracted by ENVI software. Two regression models were used to establish in this study. The average spectral data with full wavelengths were reduced by the PCA method. Compared with the full wavelengths spectral model, the feature reduction models had achieved good results with obvious improvement. Among all the models, the accuracy of the SVR-PCA model with the radial basis function was the highest in prediction with R2p of 0.991 and RMSEP of 0.669%. It could be seen that the feature selection method used to select the characteristic wavelength data was better in the modelling effect. In conclusion, the results showed that hyperspectral imaging technology for the detection of rice starch is feasible and it can measure the starch of rice quickly, effectively, and nondestructively.
Funding
This work was partially supported by National Natural Science Funds Projects (31471413), A Project Funded by the Priority Academic Program Development of Jiangsu Higher Education Institutions (PAPD), Six Talent Peaks Project in Jiangsu Province (ZBZZ-019).
Additional information
Funding
Related Research Data
References
- Lin, K.; Lu, S.; Wang, J.; Yang, Y. The Arsenic Contamination of Rice in Guangdong Province, the Most Economically Dynamic Provinces of China: Arsenic Speciation and Its Potential Health Risk. Environmental Geochemistry and Health 2015, 37, 353–361.
- Naito, S.; Matsumoto, E.; Shindoh, K.; Nishimura, T. Effects of Polishing, Cooking, and Storing on Total Arsenic and Arsenic Species Concentrations in Rice Cultivated in Japan. Food Chemistry 2015, 168, 294–301.
- Belesky, P.;. Regional Governance, Food Security and Rice Reserves in East Asia. Global Food Security 2014, 3, 167–173.
- Arase, D.;. Non-Traditional Security in China-ASEAN Cooperation: The Institutionalization of Regional Security Cooperation and the Evolution of East Asian Regionalism. Asian Survey 2010, 50, 808–833.
- Syahariza, Z.A.; Sar, S.; Hasjim, J.;, et al. The Importance of Amylose and Amylopectin Fine Structures for Starch Digestibility in Cooked Rice Grains. Food Chemistry 2013, 136, 742–749.
- Zhu, D.; Zhang, H.; Guo, B.;, et al. Physicochemical Properties of Indica-Japonica, Hybrid Rice Starch from Chinese Varieties. Food Hydrocolloids 2016, 63, 356–363.
- Kamruzzaman, M.; Sun, D.W.; Elmasry, G.; Allen, P. Fast Detection and Visualization of Minced Lamb Meat Adulteration Using NIR Hyperspectral Imaging and Multivariate Image Analysis. Talanta 2013, 103, 130–136.
- Kaliramesh, S.; Chelladurai, V.; Jayas, D.S.;, et al. Detection of Infestation by Callosobruchus Maculatus, in Mung Bean Using Near-Infrared Hyperspectral Imaging. Journal of Stored Products Research 2013, 52(1), 107–111.
- Serranti, S.; Cesare, D.; Marini, F.; Bonifazi, G. Classification of Oat and Groat Kernels Using NIR Hyperspectral Imaging. Talanta 2013, 103, 276–284.
- Ma, H.L.; Wang, J.W.; Chen, Y.J.; Cheng, J.L.; Lai, Z.T. Rapid Authentication of Starch Adulterations in Ultrafine Granular Powder of Shanyao by Near-Infrared Spectroscopy Coupled with Chemometric Methods. Food Chemistry 2016, 215, 108–115.
- Liu, L.; Ngadi, M.O.; Prasher, S.O.; Gariépy, C. Categorization of Pork Quality Using Gabor Filter-Based Hyperspectral Imaging Technology. Journal of Food Engineering 2010, 99, 284–293.
- Zhang, X.L.; He, Y. Rapid Estimation of Seed Yield Using Hyperspectral Images of Oilseed Rape Leaves. Industrial Crops & Products 2013, 42, 416–420.
- Diezma, B.; Lleó, L.; Roger, J.M.;, et al. Examination of the Quality of Spinach Leaves Using Hyperspectral Imaging. Postharvest Biology & Technology 2013, 85(3), 8–17.
- Sun, J.; Jin, X.M.; Mao, H.P.; Xiao-Hong, W.U.; Zhang, X.D.; Gao, H.Y. A Model for Predicting Nitrogen of Lettuce Leaves Based on Hyperspectral Imaging. Chinese Journal of Analytical Chemistry 2014, 42(5), 672–677.
- Wu, X.; Sun, J.; Wu, B.;, et al. Qualitative Analysis Model of near Infrared Spectra of Pork Based on Synergy Interval Partial Least Squares Discriminant Analysis. Laser and Optoelectronics Progress 2015, 52(4), 043003.
- Wu, X.H.; Tang, K.; Sun, J. Discrimination of Pork Storage Time Using near Infrared Spectroscopy and Adaboost+Olda. Spectroscopy and Spectral Analysis 2012, 32(12), 3238–3241.
- Zhang, W.; Pan, L.Q.; Tu, S.C.; Zhan, G.; Tu, K. Non-Destructive Internal Quality Assessment of Eggs Using a Synthesis of Hyperspectral Imaging and Multivariate Analysis. Journal of Food Engineering 2015, 157, 41–48.
- Sun, J.; Jiang, S.; Mao, H.; Wu, X.; Li, Q.L. Classification of Black Beans Using Vis-Nir Hyperspectral Imaging. International Journal of Food Properties 2015, 19(8), 1687–1695.
- Bi, Y.; Yuan, K.; Xiao, W.; Wu, J.; Shi, C.; Xia, J. A Local Pre-Processing Method for Near-Infrared Spectra, Combined with Spectral Segmentation and Standard Normal Variate Transformation. Analytica Chimica Acta 2016, 909, 30–40.
- Sun, J.; Zhang, M.X.; Li, Z.M.; Wu, X.H. Simulation of Smith Fuzzy PID Temperature Control in Enzymatic Detection of Pesticide Residues. International Journal of Agricultural and Biological Engineering 2015, 8(1), 50–56.
- Liu, K.; Chen, X.; Li, L.; Chen, H.; Ruan, X.; Liu, W. A Consensus Successive Projections Algorithm-Multiple Linear Regression Method for Analyzing near Infrared Spectra. Analytica Chimica Acta 2014, 858, 16–23.
- Lim, J.; Kim, G.; Mo, C.; Kim, M.S.; Chao, K.; Qin, J. Detection of Melamine in Milk Powders Using Near-Infrared Hyperspectral Imaging Combined with Regression Coefficient of Partial Least Square Regression Model. Talanta 2016, 151, 183–191.
- Khulal, U.; Zhao, J.; Hu, W.; Chen, Q. Nondestructive Quantifying Total Volatile Basic Nitrogen (TVB-N) Content in Chicken Using Hyperspectral Imaging (HSI) Technique Combined with Different Data Dimension Reduction Algorithms. Food Chemistry 2016, 197 Pt B, 1191–1199.
- Rodríguez-Pulido, F.J.; Barbin, D.F.; Sun, D.-W.; Gordillo, B.; González-Miret, M.L.; Heredia, F.J. Grape Seed Characterization by NIR Hyperspectral Imaging. Postharvest Biology & Technology 2013, 76, 74–82.
- Kamruzzaman, M.; Makino, Y.; Oshita, S. Parsimonious Model Development for Real-Time Monitoring of Starch in Red Meat Using Hyperspectral Imaging. Food Chemistry 2015, 196, 249–252.
- Sanaeifar, A.; Bakhshipour, A.; De, L.G.M. Prediction of Banana Quality Indices from Color Features Using Support Vector Regression. Talanta 2015, 148, 54–61.
- Goyal, M.K.; Bharti, B.; Quilty, J.; Adamowski, J.; Pandey, A. Modeling of Daily Pan Evaporation in Sub Tropical Climates Using ANN, LS-SVR, Fuzzy Logic, and ANFIS. Expert Systems with Applications 2014, 41, 5267–5276.
- Abbaszadeh, M.; Hezarkhani, A.; Soltani-Mohammadi, S. Proposing Drilling Locations Based on the 3d Modeling Results of Fluid Inclusion Data Using the Support Vector Regression Method. Journal of Geochemical Exploration 2016, 165, 23–34.
- Zhou, Q.; Shao, X.; Jiang, P.; Zhou, H.; Shu, L. An Adaptive Global Variable Fidelity Metamodeling Strategy Using a Support Vector Regression Based Scaling Function. Simulation Modelling Practice & Theory 2015, 59, 18–35.