
ABSTRACT
Tea quality is often evaluated by experienced tea tasters; however, their assessments are subjective, being influenced by their individual physiological and psychological condition. Herein, we fabricated a colorimetric sensor array-based artificial olfactory system for sensing the quality of Chinese green tea. First, the colorimetric sensors array was man-made using printing 12 chemically responsive dyes (9 porphyrins, metalloporphyrins and 3 pH indicators) on silica-gel flat plate. The plate was exposed to volatile organic compounds, and the colour changes in each sample were obtained by distinguishing between the images of sensor array before and after contact with tea sample. The values of colour composition changes were extracted from the dyes’ colour sections. Multivariate calibrations were applied through principal component analysis and back propagation artificial neural network (BP-ANN) for modelling. The optimum BP-ANN model was obtained with nine principal components, and the discrimination rate was equal to 85% and 86% in the calibration and prediction sets, respectively. We thus conclude that the low cost colorimetric sensor array-based artificial olfactory technique has great potential for application in intelligent evaluation of the quality of green tea.
Introduction
Tea (Camellia sinensis) is one of the most popular beverages in the world and is second only to water among non-alcoholic drinks. With the growing consumption of tea, its quality control has become increasingly important, particularly in the export business. Green tea is highly appreciated in China because of its good flavour and mellow taste,[Citation1] and it has distinct chemical characteristics corresponding to grades. Differentiations in the chemical constituents, including proteins, amino acids, polyphenols, catechins, caffeine, polysaccharides, trace elements, and volatile compounds, affect the quality of tea, which in turn determines the market value of the commodity. In general, a premium grade tea has superior flavour and taste as compared with a lower grade tea.[Citation2–Citation5]
The quality grade and market price of tea usually depend on the aroma and taste of the product. Tea prices varies with the quality grade, ranging from 30 to 1000 $/kg. The assessment of tea grade is important for both consumers and manufacturers, because it prevents unscrupulous traders from selling low-grade tea labelled as high-grade tea to increase their profit margin. Such fraud disturbs the order of market economy, violating consumers’ rights and conflicting with their interests. To resolve this problem, tea grades are evaluated by experienced tea tasters. However, sensory quality evaluation has some major drawbacks, such as substantial time consumption and expense, because extensive training of expert tasters is critical for ensuring reproducible results. The results from sensory quality evaluation can be markedly imprecise and biased, because they are highly susceptible to taster’s physiological or psychological condition.[Citation6] In recent years, quality control and evaluation of tea through high-performance liquid chromatography (HPLC)[Citation7] or gas chromatography–mass spectrometry (GC–MS)[Citation8] has been challenging because of high cost of instruments, extensive time and energy consumption, instability of detection, and several other uncertainties. Therefore, it is in urgent need of a rapid and precise analytical method for evaluating the quality of tea.
Recently, non-destructive techniques such as near infrared (NIR) spectroscopy and hyperspectral imaging (HSI) techniques have been widely applied to successfully develop calibration models for the quantification of quality parameters in tea as well as for the classification of tea grades, varieties, and geographical origins.[Citation9–Citation14] NIR spectroscopy is closely associated with the structure of plant molecule, and the chemical components differ among grades; thus, NIR spectroscopy can be applied in distinguishing tea grades. HSI is an emerging technology that combines traditional imaging and spectroscopic techniques to simultaneously obtain spatial and spectral information. Hence, information about surface characteristics can be obtained from the spatial images, and the chemical composition of tea can be evaluated by the spectral information. Customer’s satisfaction is closely related to tea quality; therefore, tea aroma is one of the main factors that influences purchase options.[Citation15,Citation16] In our study, a portable and non-destructive electronic nose (E-nose) was applied in tea grades classification based on aroma.[Citation17] Researchers have developed techniques for identifying various volatile substances in perishable materials by using E-nose based on metal oxide semiconductor (MOS) and other gas sensors, such as conducting organic polymer (COP), quartz crystal microbalance (QCM) surface acoustic wave, carbon nanotube (CNT), and conductive polymer nanocomposite (CPC) sensors.[Citation18] However, these techniques are inconvenient for the detection of volatile components in food additives owing to their sensitivity to humidity variations.
Here, we used the colorimetric sensor array, which is inspired by the mammalian behaviour of evaluating different samples through the sense of smell and has been widely used in food quality inspection.[Citation19–Citation21] The sensor array is composed of a gel flat plate containing sensitive colorimetric dyes. The array’s responses are attributable to the targeted interactions between the volatiles of interest and chemical dyes. The sensors need not to have a selective response; rather, they have nonspecific reactions with a range of chemicals. A colour imaging technique is used for deriving images from the regions of interest to evaluate the samples. In previous studies, gel flat plates were exposed to volatile organic compounds (VOCs), and the colour changes were distinguished based on images of the sensor array before and after contact with tea samples.[Citation22–Citation24] This method yields qualitative rather than quantitative results. Artificial olfactory system has successfully been utilised for the recognition and quality analysis of wine,[Citation25] vinegar,[Citation26] strawberry,[Citation27] chicken,[Citation28] pork,[Citation29] and fish.[Citation30] In previous studies, several modified sensors were used for classifying quality grades and geographical origins of tea. Li et al. [Citation31] reported an efficient liquid sensor array based on amino acid induced indicator displacement assays, and introduced a sensitive multilayer sensor based on the colorimetric redox reaction between polyphenols and Fe3+.[Citation32] On the basis of the colorimetric sensor array reported in earlier studies, we used a non-destructive and simple sensor array to differentiate Chinese green tea without brewing. For the first time, we applied a colorimetric sensor array-based artificial olfactory system fabricated with only 12 dyes in discriminating green tea among six different grades.
Therefore, we proposed a colorimetric sensor array-based artificial olfactory system for categorising green tea into different grades through multivariate analysis. The data obtained from olfactory sensors were analysed by employing principal component analysis (PCA) and back propagation artificial neural network (BP-ANN). The experimental procedure was as shown below: (1) to develop an inexpensive and innovative colorimetric sensor array-based artificial olfactory system, and (2) PCA and BP-ANN were systemically studied and compared, in order to optimise the classification ability of the proposed method.
Materials and methods
Samples preparation
A total of 150 Huangshan Maofeng green tea samples were obtained from Huangshan Xieyuda Co., Ltd, China, and the tea samples were divided into six grades based on the results of a human panel test. The collected samples were tightly packed in aluminium foil bags, sealed by using a vacuum packing machine, and then stored at 4°C until further use.
Fabrication of sensor array
A colorimetric sensor array-based artificial olfactory system was developed for evaluating the quality of green tea on the basis of aroma. Two basic requirements were considered in manufacturing the sensor array: (1) that each dye must contain a chemical response centre that interacts intensely with analytes and (2) that a strong coupling effect is achieved between the centre of the interaction and the chromophore. The required dye classes include (1) Lewis acid/base dyes (i.e., metal ion containing dyes), (2) Bronsted acidic or alkalinity dyes (i.e., pH indicators), and (3) Dyes with large permanent dipoles (i.e., Zwitterionic solvatochromic dyes).[Citation33] Owing to their axial ligand coordination sites, large number of spectral changes upon binding of the ligand, and salient colour reaction, metalloporphyrins are considered to approximate the ideal material for detecting metal-ligating vapours. Common pH indicator dyes change colour along with the proton (Bronsted) acidity or alkalinity of their environment.[Citation34]
A variety of commercial sensing materials, including porphyrins, metalloporphyrins, and pH indicators () were used to optimise the array response through a preliminary experiment. VOCs are small molecules, such as pinene, hexenols, pentanal, and hexanol. In previous experiments,[Citation28,Citation35] several materials were tested to select highly chemically responsive dyes. Eventually, nine porphyrins and metalloporphyrins materials (Sigma–Aldrich Chemical Co., Inc., Shanghai, China) and three pH indicators, namely methyl red, bromocresol green, and bromophenol blue (Sinopharm Chemical Reagent Co., Ltd.), were identified as the most suitable chemicals for the experiments and were used to fabricate the colorimetric sensor array. All chemicals were analytically pure and without any further purification before use. On the basis of foregoing research, the colour change values obtained after reaching equilibrium related to the concentration of sensitive material solution.[Citation36] With the decrease of the concentration, the hue shift of the sensor would be enhanced. Thus, the concentration of porphyrin solution is generally controlled between 1 mM and 4 mM, and the concentration of pH indicator is approximately 1 mM. Accordingly, 2 mg/mL stock solutions of the chemo-sensitive compounds were freshly prepared in chloroform or ethanol and subjected to ultrasound for hours. The colorimetric sensors array was fabricated by printing 2 μL of the fresh stock solution of each chemo-sensitive compound on C2 reverse phase silica gel plates (Merck KGaA, Germany) using microcapillary pipettes to define the spot area (Ø 3 mm).[Citation37] The sensor arrays were dried in fume hood and stored in closed environment before further use.
Figure 1. List of chemical dyes used to fabricate the sensor array.
Data acquisition
A functional prototype of the colorimetric sensor array-based artificial olfactory system was built, and the schematic diagram is shown in . An HP Scanjet 4890 flatbed scanner (Hewlett Packard Inc., Shanghai, China) was used to collect images of the sensor array, with the resolution set at 600 dpi through optimisation. The extracted red, green, and blue characteristic values ranged from 0 to 255.
Figure 2. Schematic of the colorimetric sensor array-based artificial olfactory system.
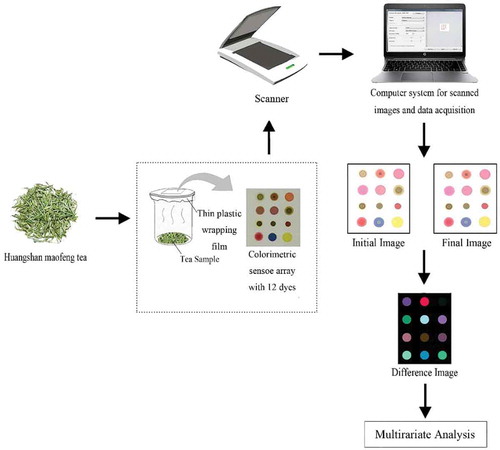
Tea samples were stored at 4°C before data acquisition, and the ambient temperature was controlled at 50°C during sampling. The samples were transferred to a 50 mL glass beaker from a sealed sample bag. The sensor array chip was installed upside down on an inert platform, and glass beaker was wrapped with a disposable plastic film to allow contact with the sample and to allow the reaction of head-gas produced from free VOCs in each sample. The reaction time and the volume of sample were all arranged to follow a uniform standard according to the preliminary experiment, so that the chip exhibited clear colour changes explicitly. In particular, the reaction between the selected dyes and VOCs in tea samples takes some time to reach equilibrium. The optimal reaction time was determined to be 2 –28 min with an interval of 2 min; image acquisition was conducted at each time point. Colour changes in the sensor array response at different time are shown in Figure S1. The results reveal that, at the beginning of the test, the colour changes of the selected dyes were obvious; but, after a certain point, the changes were too slight to detect. As can be observed in Figure S2, Euclidean distance was increasing dramatically until 10–16 min. Although the reaction tended to be saturated within 16 min, a reaction time of 24 min was selected as the optimised reaction time for subsequent experiments in order to ensure the obtained Euclidean distance in the final equilibration.
Before the array was exposed to the tea samples, an image (referred to as the “initial” image) was captured using a flatbed scanner. On the basis of the results of our preliminary experiment, 1.00 ± 0.01 g of tea sample was placed in a sealed container. Moreover, at the equilibrium time point (approximately 24 min), the sensor array was removed from the glass container. Then, the ‘‘final” image was obtained. The colour change of representative feature can be displayed on an RGB difference image, which was obtained by calculating the difference between the “initial” image and the “final” image. There was no one-to-one correspondence between the colour change in the sensor array and particular VOCs in tea. However, the colour change in the difference images indicated the characteristics of interactions between dyes and volatile compounds in the tea samples.
To avoid subtraction of artefacts at the periphery of the spots and factitious inhomogeneity, the centre of each dye (16 pixels radius of approximately 800 pixels) was averaged. Three colour components (R, G, and B) can be extracted from each dye spot, that is to say, 36 variables (i.e., 12 dyes × 3 colour components) could be obtained from each sensor array for one sample. Each variable had 256 possible colour values. In the experiment, the colour RGB image was an 8-bit image, and the colour values ranged from 0 to 255.
Multivariate calibration
In data processing, multivariate analysis methods were employed to precisely and accurately classify green tea samples of different grades by using the colorimetric sensor array. In order to process the RGB data of the difference image, pattern recognition algorithms (PCA and BP-ANN) were applied. The algorithms were executed in MATLAB Version 7.10.0 (Mathworks, Natick, USA) running on Windows 7, and the experimental results obtained were analysed. PCA mapping was performed using Origin Pro version 9.0 (Origin Lab. Corp., Northampton, MA).
Results
Sensor response
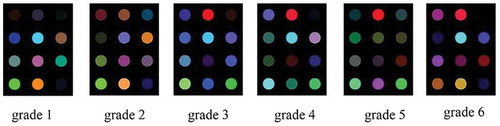
Classification of green tea of different grades remains a challenge job, because of the substantial number of compounds in the tea and the high similar in sensory characteristics among teas of different grades. In this study, a colorimetric sensor array was utilised to discriminate green tea of different grades. Depending on the plucking season, the tea cultivar, and particularly the plucking standard (i.e., the tenderness of raw materials), tea samples of different grades have unique volatile organic compounds, varying in the number of organic compounds present and their ratios. The characteristic fingerprints of each green tea sample are attributable to their inherent chemical characteristics. When chemically responsive dyes such as porphyrins, metalloporphyrins, and pH indicators interact with VOCs, their respective colours change. Thus, each difference image represents a specific colour change fingerprint. Therefore, tea samples of different grades can be classified with suitable multivariate analysis methods. shows difference images of green tea of six grades, and the differences among the grades could be easily found even by naked eye. Considering the reproducibility and stability of the artificial olfactory system, 25 samples from each grade were analysed. As shown in Figure S3, the colour changes in the profiles of tea samples from the same grade were quite similar indicating good reproducibility and stability of the artificial olfactory system.
Figure 3. Difference images of sensors array for six grades of green tea (first three lines indicate prophyrins and metalloporphyrins dyes, and the last line indicates three pH indicators).
Results of classification
Principal component analysis
PCA is a widely used pattern recognition method for analysing and classifying multiple target VOCs by using the colorimetric sensor array-based artificial olfactory system.[Citation38,Citation39] By determining a linear relationship that represents the characteristics of variables, it can effectively reduce the dimension of numerical datasets in a multivariate problem. The PCA algorithm decomposes the original data matrix; specifically, multivariate data sets are projected onto a completely new coordinate. The eigenvectors of the new data matrix thus formed are known as principal components (PCs) which constitute a linear combination of the original variables.[Citation40] The total number of PC equals to the number of the original variables, and it derived in decreasing order of importance.[Citation41]The first PC (PC1) accounts for the maximum of the total variables, the second PC (PC2) is not connected with the first and accounts for the maximum residual variance. Both the data coordinates in the new base (score plot) and the contribution to each component of the sensors (load plot) can be obtained by the PCA algorithm. The score plot is generally utilised to analyse the classification of data sets, while the load plot provides information on the relative importance of sensors to each PC and their mutual correlation.
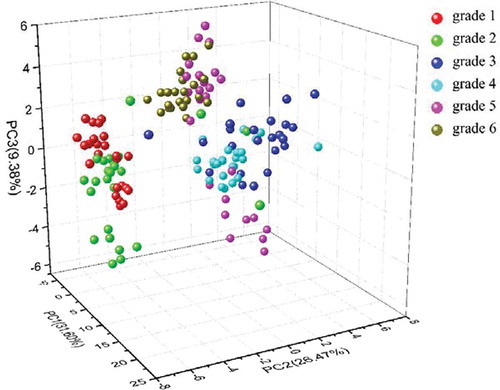
PCs are used for displaying the classification results of a data set. A two- or three-dimensional (3D) score plot consisting of the first two or three PCs shows visual distribution relationships between the results. More similar samples are more closely distributed. The plot, therefore, can be used to identify differences between the groups and to compare the distribution patterns of such differences within a group. To visualise the clustering trend of these samples, the first three PCs (i.e., PC1, PC2, and PC3) from PCA were used to draw the score plot.
The PCA results showed that the first 10 dimensions accounted for only 88.51% of the total variance, and the sensor array requires 15 dimensions to represent 93.50% of the total variance. Such a high dispersion rate indicated that our array of chemo-reactive dyes account for a wide range of chemical properties. shows a 3D plot constructed from the first three PCs, and the distribution of all samples in the PC1, PC2, and PC3 coordinate axes, confirming the presence of six groups. The variances of PC1, PC2, and PC3 were 31.6%, 26.47%, and 9.38%, respectively. The accumulated variance from the first three PCs was 67.45% of the total variance. That is, the 3D plot can represent only 67.45% of the variance in the original data. Thus, there exists no clear boundary of separation between different grades of green tea. The relative location of each sample in the 3D plot reflects the response of the array, which is based on the differences in the concentrations of various chemical compounds and the pH value of each analyte. As shown in , the samples of adjacent grades are overlapping, validating both the tea quality and the clustering process of the PCA algorithm. In general, the distance between the green tea samples of different grades reflects of the inherent quality of green tea. The quality between two adjacent grades is the most similar. To conclude as compared with the supervised pattern recognition methods, PCA has unsatisfactory discrimination. BP-ANN involves classical feed-forward multilayer networks and was hence, used for improved separation.
Figure 4. Cluster plot of PCA for different tea grades.
Back propagation artificial neural network
The ANN is a mathematical model inspired by structural and functional aspects of actual biological neural networks, and it serves as an efficient tool for accurate classification and distinction between categories. The ANN is a nonlinear analysis involving several simple units of computation, and the BP-ANN is one of the most widely used models.[Citation42] The BP-ANN model can self-adjust its structure to fit the training data to a large extent, and it offers a strong ability to extract features from the training data set. Therefore, when a well-trained BP-ANN model is applied to address the artificial olfactory system problem, it can achieve a superior performance compared with unsupervised techniques.[Citation43]
The BP-ANN model is composed of a set of interrelated artificial neurons arranged in layers, namely an input layer, one or more hidden layers, and an output layer. A connection (weights) exists unidirectionally from the input layer to the output layer. There is no connection between the neurons of the same layer; however, the adjacent layers are interconnected by a weighting factor. The data matrix is sent directly from the input layer to the hidden layer with a transfer function, which adjusts the output value between 0 and 1. The BP-ANN layers modify the connections between neurons weights through learning, and then the final error arrives at the minimum. Parameter selection during the construction of the model is an essential aspect of supervised learning algorithms. In this work, the network parameters (i.e., number of hidden nodes in the middle layers, scale functions, learning rate factor, momentum factors, and initial weights) were evaluated on the basis of the minimal mean square error values. The number of hidden nodes was initially set at 5; the learning rate and momentum were set at 0.1; the initial weight was set at 0.3; and the scale function was set to the ‘thah’ function. Selecting of the optimal number of PCs is a crucial task in BP-ANN. Several methods are dedicated to this purpose, the discrimination rates were used to select the optimal number in our study. The discrimination rate (%) = (N1/N2) * 100%, where N1 is the number of correctly classified samples, and N2 is the total number of samples.
shows the discrimination rates of the BP-ANN model for the calibration and prediction sets with different numbers of PCs. As shown in , most of the misclassified samples were between adjacent grades. The highest discrimination rate was obtained using nine PCs (85% for calibration set and 86% for prediction set) followed by six PCs (80% for both calibration set and prediction set). The model meets the requirements for classification and can be used in further experiment for data fusion.
Table 1. Classification results of tea grades in calibration and prediction sets
Figure 5. Discrimination rates of BP-ANN model for different numbers of PCs.
Discussion
Tea is rich in volatile compounds, which are responsible for its special odour and aroma. Volatile compounds are generated from carotenoids, lipids, glycosides, and other precursors as well as from the Maillard reaction.[Citation44] The production of VOCs is affected by the manufacturing process. trans-2-Hexenal, benzaldehyde, methyl-5-hepten-2-one, methyl salicylate, and indole are five key VOCs for distinguishing unfermented teas from fermented ones.[Citation45] In green tea, more than 200 volatiles were found, and approximately 30 of these were identified as important contributors to the green tea aroma.[Citation46] Classification of green tea of different grades remains a challenging task not only because the processing of unfermented green tea results in minimal oxidation as compared with the manufacturing of other teas, but also because of the substantial number of compounds in tea that are highly similar in their sensory characteristics, eben among different grades. Through GC–MS, caproicacidhexneyleste, linalool, and nonanal were identified as the most important components of the common Chinese green tea (Huangshan Maofeng tea) odour. In addition, linalool, dimethyi sulfidephide, and β-ionone are the main contributors to the overall aroma of green tea based on their aroma character impact value.[Citation45] Investigations on potent odorants of green tea infusions have identified some volatiles, such as 4-hydroxy-2,5-dimethyl-3(2H)-furanone, 3-hydroxy-4,5-dimethyl-2(5H)-furanone, coumarin, vanillin, geraniol, (E)-isoeugenol, and 2-methoxyphenol, as essential for the aroma of all three famous Chinese green tea cultivars.[Citation47] Porphyrins, metalloporphyrins, and pH indicators can react with various types of VOCs to produce colour changes via metal–ligand bonds and hydrogen bonds, enabling classification of tea grades.[Citation31,Citation34] In previous studies, common organic components such as amines, arenes, alcohols, aldehydes, carboxylic acids, esters, halocarbons, ketones, phosphines, sulfides, and thiols were distinguished through the analysis of colour change in a metal porphyrin sensor array.[Citation22]
To optimise performance in discriminating of green tea’s quality by using the artificial olfactory system, we systemically studied and compared PCA and BP-ANN through data analysis. Favourable classification results were achieved by the colorimetric sensor array-based artificial olfactory system. shows the discrimination rate of the BP-ANN model developed in this study. Comparison of these results with the PCA cluster plot for different tea grades ()indicated that (1) the samples from the adjacent grades were overlapping and followed a trend of cluster distribution in the PCA cluster plot; (2) all of the misclassified samples in the BP-ANN model were incorrectly classified into adjacent grades; (3) the BP-ANN algorithm was superior to the PCA algorithm in this study. The reasons for these findings are summarised as follows.
The quantities of VOCs in the tea samples of adjacent grades were similar, owing to the use of similar raw materials and manufacturing methods. The colorimetric sensor array exhibited a specific response to the VOCs and a corresponding colour fingerprint. The relative dispersion degree of green tea samples in the PCA cluster plot reflects the response of the array, which is based on the differences in the concentrations of various chemical compounds and the pH value of each analyte. Samples from the adjacent grades overlapped; thus, green tea samples were misclassified into the adjacent grades.
In contrast to PCA, the BP-ANN classification algorithm achieved a higher classification performance in this study. On the basis of statistical learning theory, although PCA provides an effective method for reducing the dimension of the original multivariable data set, the BP-ANN has advantages as a nonlinear classification algorithm. The evaluation of tea quality is a complex process that involves a nonlinear variation of the green tea aroma among grades. Although the colorimetric sensor array has a corresponding colour fingerprint for VOCs, the relationship between the fingerprint and tea quality is complex. Hence, data analysis by using linear tools does not apply in this complicated classification problem. The effectiveness of PCA in data dimension reduction is insignificant in the circumstances; the first three PCs accounted for only 67.45% of the total variances, owing to the selection of a wide array of chemical-property space. Hence, the chemo-reactive dye and the VOCs were independently bonded to each other; that is, there were not too many collinear variables in the sensor data set. In general, insufficient redundant information in the raw data led to unapparent dimension reduction. Therefore, the percentage of variance accounted for by PCs was quite limited. The topology network structure may be more applicable owing to self-study and self-regulation abilities. This explains why the BP-ANN algorithm was superior to the PCA algorithm.
Conclusion
In this study, a novel and economical colorimetric sensor array-based artificial olfactory system was developed for intelligent evaluation of green tea’s quality. The colour change profiles of the array were selected for the digital signal representation of the colorimetric sensor array and the unique fingerprint of specific tea samples. The results revealed that the colorimetric sensor array-based artificial olfactory system can be used to distinguish the grades of green tea by applying multivariate analysis, which has a great guiding significance for the green tea manufacturing industry. In addition, the entire analysis process is quick and easy; both pretreatment of the sample and the personnel professional qualifications are not required.
LJFP_A_1354021_SUPPLEMENTARY_DATA_FILE.docx
Download MS Word (829.8 KB)Acknowledgments
This study was financially supported by the National Key Research and Development Program of China (2017YFD0400800) and the Program for Changjiang Scholars and Innovative Research Team in University (No. IRT_15R01).
Related Research Data
References
- Zeng, X.; Tian, J.; Cai, K.; Wu, X.; Wang, Y.; Zheng, Y.; Su, Y.; Cui, L. Promoting Osteoblast Differentiation by the Flavanes from Huangshan Maofeng Tea Is Linked to a Reduction of Oxidative Stress. Phytomedicine. 2014, 21, 217–224. DOI: 10.1016/j.phymed.2013.08.026.
- Ramdani, D.; Chaudhry, A. S.; Seal, C. J. Chemical Composition, Plant Secondary Metabolites, and Minerals of Green and Black Teas and the Effect of Different Tea-To-Water Ratios during Their Extraction on the Composition of Their Spent Leaves as Potential Additives for Ruminants. J. Agric. Food Chem. 2013, 61, 4961–4967. DOI: 10.1021/jf4002439.
- Lv, S. D.; Wu, Y. S.; Song, Y. Z.; Zhou, J. S.; Lian, M.; Wang, C.; Liu, L. Multivariate Analysis Based on GC-MS Fingerprint and Volatile Composition for the Quality Evaluation of Pu-Erh Green Tea. Food Anal. Methods. 2015, 8, 321–333. DOI: 10.1007/s12161-014-9900-0.
- Gao, L.; Bian, M.; Mi, R.; Hu, X.; Wu, J. Quality Identification and Evaluation of Pu-Erh Teas of Different Grade Levels and Various Ages through Sensory Evaluation and Instrumental Analysis. Int. J. Food Sci. Technol. 2016, 51, 1338–1348. DOI: 10.1111/ijfs.13103.
- Lu, X.; Zhao, Y.; Sun, Y.; Yang, S.; Yang, X. Characterisation of Polysaccharides from Green Tea of Huangshan Maofeng with Antioxidant and Hepatoprotective Effects. Food Chem. 2013, 141, 3415–3423. DOI: 10.1016/j.foodchem.2013.06.058.
- Ouyang, Q.; Zhao, J.; Chen, Q. Instrumental Intelligent Test of Food Sensory Quality as Mimic of Human Panel Test Combining Multiple Cross-Perception Sensors and Data Fusion. Anal. Chim. Acta. 2014, 841, 68–76. DOI: 10.1016/j.aca.2014.06.001.
- Yi, T.; Zhu, L.; Peng, W. L.; He, X. C.; Chen, H. L.; Li, J.; Yu, T.; Liang, Z.; Zhao, Z.; Chen, H. Comparison of Ten Major Constituents in Seven Types of Processed Tea Using HPLC-DAD-MS Followed by Principal Component and Hierarchical Cluster Analysis. Lwt-Food Sci. Technol. 2015, 62, 194–201. DOI: 10.1016/j.lwt.2015.01.003.
- Wu, Y.; Lv, S.; Chen, W.; Gao, X.; Li, J.; Meng, Q. Comparative Analysis of Volatiles Difference of Yunnan Sun-Dried Pu-Erh Green Tea from Different Tea Mountains: Jingmai and Wuliang Mountain by Chemical Fingerprint Similarity Combined with Principal Component Analysis and Cluster Analysis. Chem. Cent. J. 2016, 10, 1–11. DOI: 10.1186/s13065-016-0159-y.
- Jiang, H.; Chen, Q. Chemometric Models for the Quantitative Descriptive Sensory Properties of Green Tea (Camellia Sinensis, L.) Using Fourier Transform near Infrared (FT-NIR) Spectroscopy. Food Anal. Methods. 2014, 8, 954–962. DOI: 10.1007/s12161-014-9978-4.
- Diniz, P. H. G. D.; Pistonesi, M. F.; Araújo, M. C. U. Using SPA-PLS and NIR Spectroscopy for the Determination of Total Polyphenols and Moisture in Commercial Tea Samples. Anal. Methods. 2015, 7, 3379–3384. DOI: 10.1039/C4AY03099K.
- Wang, X.; Huang, J.; Fan, W.; Lu, H. Identification of Green Tea Varieties and Fast Quantification of Total Polyphenols by Near-Infrared Spectroscopy and Ultraviolet-Visible Spectroscopy with Chemometric Algorithms. Anal. Methods. 2014, 7, 787–792. DOI: 10.1039/C4AY02106A.
- Diniz, P. H. G. D.; Gomes, A. A.; Pistonesi, M. F.; Band, B. S. F.; Araújo, M. C. U. D. Simultaneous Classification of Teas according to Their Varieties and Geographical Origins by Using NIR Spectroscopy and SPA-LDA. Food Anal. Methods. 2014, 7, 1712–1718.
- Deng, S.; Xu, Y.; Li, X.; He, Y. Moisture Content Prediction in Tealeaf with near Infrared Hyperspectral Imaging. Comput. Electron. Agric. 2015, 118, 38–46. DOI: 10.1016/j.compag.2015.08.014.
- Xie, C.; Li, X.; Shao, Y.; He, Y. Color Measurement of Tea Leaves at Different Drying Periods Using Hyperspectral Imaging Technique. PLoS One. 2014, 9, e113422–e113422. DOI: 10.1371/journal.pone.0113422.
- Zhu, Y.; Lv, H. P.; Dai, W. D.; Guo, L.; Tan, J. F.; Zhang, Y.; Yu, F.; Shao, C.; Peng, Q.; Lin, Z. Separation of Aroma Components in Xihu Longjing Tea Using Simultaneous Distillation Extraction with Comprehensive Two-Dimensional Gas Chromatography-Time-Of-Flight Mass Spectrometry. Separation Purif. Technol. 2016, 164, 146–154. DOI: 10.1016/j.seppur.2016.03.028.
- Han, Z. X.; Rana, M. M.; Liu, G. F.; Gao, M. J.; Li, D. X.; Wu, F. G.; Li, X. B.; Wan, X. C.; Wei, S. Green Tea Flavour Determinants and Their Changes over Manufacturing Processes. Food Chem. 2016, 212, 739–748. DOI: 10.1016/j.foodchem.2016.06.049.
- Dai, Y.; Zhi, R.; Zhao, L.; Gao, H.; Shi, B.; Wang, H. Longjing Tea Quality Classification by Fusion of Features Collected from E-Nose. Chemometr. Intell. Lab. Syst. 2015, 144, 63–70. DOI: 10.1016/j.chemolab.2015.03.010.
- Lippolis, V.; Pascale, M.; Cervellieri, S.; Damascelli, A.; Visconti, A. Screening of Deoxynivalenol Contamination in Durum Wheat by Mos-Based Electronic Nose and Identification of the Relevant Pattern of Volatile Compounds. Food Control. 2014, 37, 263–271. DOI: 10.1016/j.foodcont.2013.09.048.
- Griffiths, P. R.; Brennan, P. A. Roles for Learning in Mammalian Chemosensory Responses. Horm. Behav. 2014, 68, 91–102. DOI: 10.1016/j.yhbeh.2014.08.010.
- Lewis, N. S. Comparisons between Mammalian and Artificial Olfaction Based on Arrays of Carbon Black—Polymer Composite Vapor Detectors. Acc. Chem. Res. 2004, 37, 663–672. DOI: 10.1021/ar030120m.
- Ryman, S. K.; Bruce, N. D. B.; Freund, M. S. Temporal Responses of Chemically Diverse Sensor Arrays for Machine Olfaction Using Artificial Intelligence. Sens. Actuators B Chem. 2016, 231, 666–674. DOI: 10.1016/j.snb.2016.03.059.
- Rakow, N. A.; Suslick, K. S. A Colorimetric Sensor Array for Odour Visualization. Nature. 2000, 406, 710–713. DOI: 10.1038/35021028.
- Janzen, M. C.; Ponder, J. B.; Bailey, D. P.; Suslick, K. S. Colorimetric Sensor Arrays for Volatile Organic Compounds. Anal. Chem. 2006, 78, 3591–3600. DOI: 10.1021/ac052111s.
- Khulal, U.; Zhao, J.; Hu, W.; Chen, Q. Comparison of Different Chemometric Methods in Quantifying Total Volatile Basic-Nitrogen (TVB-N) Content in Chicken Meat Using a Fabricated Colorimetric Sensor Array. RSC Adv. 2016, 6, 4663–4672. DOI: 10.1039/C5RA25375F.
- Ouyang, Q.; Zhao, J.; Chen, Q.; Hao, L. Classification of Rice Wine according to Different Marked Ages Using a Novel Artificial Olfactory Technique Based on Colorimetric Sensor Array. Food Chem. 2013, 138, 1320–1324. DOI: 10.1016/j.foodchem.2012.11.124.
- Chen, Q.; Sun, C.; Ouyang, Q.; Liu, A.; Li, H.; Zhao, J. Classification of Vinegar with Different Marked Ages Using Olfactory Sensors and Gustatory Sensors. Anal. Methods. 2014, 6, 9783–9790. DOI: 10.1039/C4AY02386B.
- Liu, F.; Chen, H.; Tang, X. Investigation on Strawberry Freshness by Rapid Determination Using Artificial Olfactory System. Int. J. Food Properties. 2017. DOI: 10.1080/10942912.2017.1315595.
- Chen, Q.; Hui, Z.; Zhao, J.; Ouyang, Q. Evaluation of Chicken Freshness Using a Low-Cost Colorimetric Sensor Array with AdaBoost–OLDA Classification Algorithm. LWT-Food Sci. Technol. 2014, 57, 502–507. DOI: 10.1016/j.lwt.2014.02.031.
- Salinas, Y.; Ros-Lis, J. V.; Vivancos, J. L.; Martínez-Máñez, R.; Marcos, M. D.; Aucejo, S.; Herranz, N.; Lorente, I.; Garcia, E. A Novel Colorimetric Sensor Array for Monitoring Fresh Pork Sausages Spoilage. Food Control. 2014, 35, 166–176. DOI: 10.1016/j.foodcont.2013.06.043.
- Morsy, M. K.; Zór, K.; Kostesha, N.; Alstrøm, T. S.; Heiskanen, A.; El-Tanahi, H.; Sharoba, A.; Papkovsky, D.; Larsen, J.; Khalaf, H.; et al. Development and Validation of a Colorimetric Sensor Array for Fish Spoilage Monitoring. Food Control. 2015, 60, 346–352. DOI: 10.1016/j.foodcont.2015.07.038.
- Li, J.; Fu, B.; Huo, D.; Hou, C.; Yang, M.; Shen, C. Discrimination of Chinese Teas according to Major Amino Acid Composition by a Colorimetric IDA Sensor. Sens. Actuators B Chem. 2016, 240, 770–778. DOI: 10.1016/j.snb.2016.09.019.
- Li, J.; Fu, B.; Huo, D.; Hou, C.; Yang, M.; Shen, C. A Colorimetric Multilayer Sensor for Discriminating Red Wine and Green Tea by Measurement of Antioxidant Activity. Anal. Methods. 2016, 8, 3345–3352. DOI: 10.1039/C5AY03360H.
- Janzen, M. C.; Ponder, J. B.; Bailey, D. P.; Ingison, C. K.; Suslick, K. S. Colourimetric Sensor Arrays for Volatile Organic Compounds. Anal. Chem. 2006, 78, 3591–3600. DOI: 10.1021/ac052111s.
- Suslick, K. S.; Rakow, N. A.; Sen, A. Colourimetric Sensor Arrays for Molecular Recognition. Tetrahedron. 2004, 60, 11133–11138. DOI: 10.1016/j.tet.2004.09.007.
- Chen, Q.; Liu, A.; Zhao, J.; Ouyang, Q.; Sun, Z.; Huang, L. Monitoring Vinegar Acetic Fermentation Using a Colorimetric Sensor Array. Sens. Actuators B Chem. 2013, 183, 608–616. DOI: 10.1016/j.snb.2013.04.033.
- Rakow, N. A. A Metalloporphyrin-Based Colorimetric Nose: “Smell-Seeing”. University of Illinois at Urbana-Champaign: Urbana, America, 2001.
- Chen, Q.; Liu, A.; Zhao, J.; Qin, O. Classification of Tea Category Using a Portable Electronic Nose Based on an Odor Imaging Sensor Array. J. Pharm. Biomed. Anal. 2013, 84, 77–83. DOI: 10.1016/j.jpba.2013.05.046.
- Huang, X. W.; Li, Z. H.; Zou, X. B.; Shi, J. Y.; Mao, H. P.; Zha, J. W.; Hao, L. M.; Holmes, M. Detection of Meat-Borne Trimethylamine Based on Nanoporous Colorimetric Sensor Arrays. Food Chem.. 2016, 197, 930–936. DOI: 10.1016/j.foodchem.2015.11.041.
- Tahir, H. E.; Zou, X. B.; Huang, X. W.; Shi, J. Y.; Mariod, A. A. Discrimination of Honeys Using Colorimetric Sensor Arrays, Sensory Analysis and Gas Chromatography Techniques. Food Chem. 2016, 206, 37–43. DOI: 10.1016/j.foodchem.2016.03.032.
- Singh, H.; Raj, V. B.; Kumar, J.; Durani, F.; Mishra, M.; Nimal, A. T.; Sharma, M. U. Saw Mono Sensor for Identification of Harmful Vapors Using PCA and ANN. Process. Saf. Environ. Prot. 2016, 102, 577–588. DOI: 10.1016/j.psep.2016.05.014.
- Šnirc, M.; Kral, M.; Ošťádalová, M.; Golian, J.; Tremlová, B. Application of Principal Component Analysis Method for Characterization Chemical, Technological, and Textural Parameters of Farmed and Pastured Red Deer. Int. J. Food Properties. 2017, 20, 754–761. DOI: 10.1080/10942912.2016.1180532.
- Xia, Q.; Liu, C.; Liu, J.; Pan, W.; Lu, X.; Yang, J.; Chen, W.; Zheng, L. Rapid and Non-Destructive Determination of Rancidity Levels in Butter Cookies by Multi-Spectral Imaging. J. Sci. Food Agric. 2016, 96, 1821–1827. DOI: 10.1002/jsfa.2016.96.issue-5.
- Li, H.; Chen, Q.; Zhao, J.; Ouyang, Q. Non-Destructive Evaluation of Pork Freshness Using a Portable Electronic Nose (E-Nose) Based on a Colorimetric Sensor Array. Anal. Methods. 2014, 6, 6271–6277. DOI: 10.1039/C4AY00014E.
- Ho, C. T.; Zheng, X.; Li, S. Tea Aroma Formation. Food Sci. Hum. Wellness. 2015, 4, 9–27. DOI: 10.1016/j.fshw.2015.04.001.
- Liu, P.; Xu, Y.; Yin, J.; Chen, G.; Wang, F. Effect of Main Water Quality Factors on Volatile Components of Huangshan Maofeng Tea with Faint Scent. J. Chin. Inst. Food Sci. Technol. 2016, 16, 245–257.
- Kumazawa, K.; Masuda, H. Identification of Potent Odorants in Different Green Tea Varieties Using Flavor Dilution Technique. J. Agric. Food Chem. 2002, 50, 5660–5663. DOI: 10.1021/jf020498j.
- Baba, R.; Kumazawa, K. Characterization of the Potent Odorants Contributing to the Characteristic Aroma of Chinese Green Tea Infusions by Aroma Extract Dilution Analysis. J. Agric. Food Chem. 2014, 62, 8308–8313. DOI: 10.1021/jf502308a.