
ABSTRACT
The external appearance of an olive’s skin is the most decisive factor in determining its quality. In order to quantify the colour changes that occur during sweetening process, a computer vision systems based on Artificial Neural Networks (ANN) was developed to determine bitter and sweet olives. To this end, olives were treated in brine and water testing environments for nine days. During this process, digital colour image were taken every two days. Two colour spaces (RGB and L*a*b*) were used and six colour features corresponding to average of each colour channel were derived and used for ANN training. The overall accuracy of ANN classifier was of 93.38%. According to the results of the image analysis, the L*, R, G and B values showed a significant correlation with general acceptance for water curing treatment (p < 0.05). For brine curing treatment, results showed a significant correlation between L*, a*, b*, R and G with general acceptance (p < 0.05). Considering the results of sensory analysis the optimum time for both brine and distilled water were seven and three, respectively. Furthermore, brine curing had a greater impact on olive skin-colour changes.
Introduction
Olive fruit (Olea europaea L.), which belongs to the genus Olea of the family Oleaceae, is consumed freshly and its oil is used for cooking food and industrial purposes. [Citation1] Olives are distinguished from all other drupes by its chemical composition: a relatively low concentration of sugars, high oil content, and bitter taste qualities. [Citation2] Oleuropein is the main bitter component in the olive. In fact, these substances are important parameters in the sensory attributes of the fruit. [Citation3] These features are mainly related to the colour and the morphological appearance of their skin. Olives picked from the tree are generally purple, green or black (according to the ripening index) with smooth skinned. [Citation1]Colour characteristics of food can be measured by visual analysis or new instrumental methods. [Citation4] Visual assessment of the surface colour is one of the most important visual attributes in food and is usually the first characteristic evaluated by consumers in the acceptance or rejection of the product. [Citation5] One of these new methods is computer vision technique which provides a rapid and economical non-destructive alternative for the sensory inspection. In this technique, one or more images are taken for each individual object and processed to determine the quality of the object. Computer vision techniques are widely utilised to check the quality of products in the food industry. [Citation6] Different crops are graded and sorted according to quality detection based on colour change. Furthermore, there are many research works investigating other fruits. At present, colour spaces are used to create, represent and visualise colours in two and three dimensional space. [Citation7] Usually, the colour of food and fruits has been measured in L*a*b* and RGB colour space. Apart from this, [Citation8] used the histograms of the red and green channels to classify dates according to a maturity index.[Citation9] Developed a machine to automatically sort pomegranate arils. They used the information of red, green and blue channels and classified pomegranate arils using linear discriminating analysis.[Citation10] Employed neural networks for grading beans according to their colour, with a success of 90.6%.
Several works investigated automatic classification of olive fruits using artificial vision. [Citation11] [Citation11] Suggested an automatic inspection system for table olives based on computer vision. In this work, each sample was investigated for skin colour and the presence of defects on the surface of the olive. Three algorithms were tested: Bayesian, PLS multi-variant discriminant analysis and neural networks. The best result was obtained with the neural network, with an accuracy of over 90%. [Citation12] developed a method of grading olives for oil extraction based on an infrared (IR) vision system and segmentation algorithms using skin aspect in IR Image defects were detected using a digital monochrome camera with band-pass filters on the near-infrared (NIR) spectrum.
The aims of this study were to (1) implement a standard computer vision system to describe changes colour during the process of curing olives using L*a*b* colour space RGB and, (2) find correlations of colour parameters with the parameters of sensory evaluation to estimate the optimal time to cure olives for optimal sweetness.
Material and method
Sample preparation
Olives from the cultivar “KC” were obtained from an orchard (Ahwaz town, Khuzestan province, Iran). The olives were harvested at the green stage, and transported to laboratory located in the Ramin Agriculture and Natural Resources University of Khuzestan. In order to prevent colour changes during experimental process, samples were stored in refrigerator until analysis.
Material and method
The aim of an olive curing process is to remove all or part of the olive fruit bitter component Oleuropein. Two curing methods, water curing and brine curing were utilised in this study. In either method, the olives are first soaked in a 2–3% NaOH solution (termed a ‘lye’ solution) for 5 to 7 hours generally. This alkali degrades polyphenols, which increase the permeability of the cell wall. [Citation13] To increase the relative sweetness of the olive fruits (by removing bitterness), the lye solution must reach two-thirds to three-quarters the distance between the skin and the stone. This process is followed by several washings with water to completely remove excess alkali. The olives are then placed in either water or a solution of sodium chloride (brine) for 9 days.
Water curing
Water curing of olives, as the name suggests, involves submersion of the olives in water for a period of a week or longer. Water cured olives typically remain slightly bitter because water curing removes less oleuropein from the olives than other curing methods ()
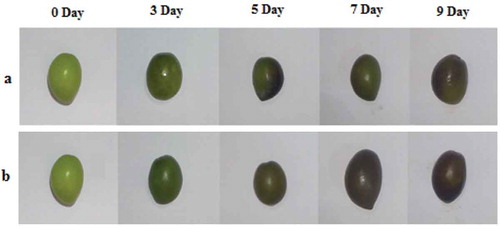
Figure 1. Image of the various stages in the two samples test environment (a. Water curing and b. Brine curing).
Brine curing
Brine curing involves the submersion of olives in a concentrated brine salt solution. Greek style olives in Brine and Sicilian style olives are examples of brine-cured olives. Brine-curing can take many months and olives often undergo fermentation during the brine curing process (Fermentation means that the sugars found in olives will often get broken down into lactic or acetic acid, and oleuropein will be freed to migrate into the brine). Many changes in flavour and phytonutrient composition can take place during the brine curing process ()
Image processing
The steps involved in image processing were image acquisition, feature extraction and data analysis. The development of algorithms was performed in the image processing toolbox of Matlab 2013b. For processing the images, the olive was separated from the background with an algorithm of. [Citation14] Two colour spaces, including RGB and L*a*b*, were applied in this study. The colour parameters (R, G, B, L*, a* and b*) were measured in olive samples every second day of the curing process for a period of two weeks. The first colour space, RGB, is red, green and blue. Although this colour space is capable of distinguishing between millions of colours, but it cannot represent how humans perceive colour. [Citation15,Citation16] The second colour readings were taken in the L*a*b* colour space. The L* parameter is luminosity, a characteristic by which a surface produces more or less light and can have values between 0 (black) to 100 (white). The parameter a* takes positive values for reddish colours and negative values for the greenish ones, whereas b* takes positive values for yellowish colours and negative values for the bluish ones. [Citation17]
Image acquisition
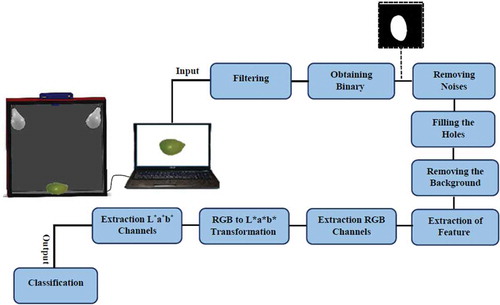
The lighting condition is very important for image acquisition. To get high quality images and determining the maturity of fruits and vegetables automatically image acquisition is of great importance. [Citation18] In this paper, the image acquisition system had a lighting box including two fluorescent lamps, which the lamps were attached at a 45° angle in the higher part of the box. Also the system had a camera CASIO (Model Exilim EX-ZR700; 16 MP, made Japan), which was located at a distance of 25cm. The images were acquired by the system and saved in a personal computer (). Furthermore, to calibrate the digital colour system, proposed method by [Citation15] using the colour values of 20 colour charts were used.
Figure 2. Schematic diagram of computer vision system for colour extraction and classification.
Derived feature from RGB images and calculations of l*a*b*
After image acquisition and segmentation by thresholding, the colour parameters L*, a* and b* were obtained from the RGB parameters using the following steps: (i) colour features were extracted from the R, G and B channels in the RGB colour space. The proportions of each of the three primary features in relation to the sum of R, G and B were obtained through the formula presented in 1, 2 and 3. [Citation19]
Subsequently, these values were changed from RGB values to XYZ using of the matrix for a D65-2° illuminant-observer (Eq. (4)). The D65-2° illuminant-observer is a standard recommended by the CIE 1931 and suitable to the lighting that was used. [Citation19]
Using the M matrix, values for X, Y and Z are obtained using (Eqs. (5) to (7)).
Next, var X, var Y and var Z were calculated with Eqs. (8) to (10);
Where Xn = 95.047, Yn = 100 and Zn = 108.883, are tri-stimulus values obtained by the weighted-ordinate method (∆λ = 1 nm), with the CIE 1964 standard observer (10°visual field) and the CIE standard illuminant D65, as white point reference. [Citation20] Subsequently, L*, a*, b* were calculated using Eqs, (11–13).
Classification and validation by ANN
Development of an ANN model usually consists of several basic steps: (1) the generation of data required for training, (2) the training of the ANN model using a data set of different inputs with corresponding outputs, (3) the evaluation of different ANN configurations and selection of the optimal configuration, and (4) testing the modelling performance of trained ANN models using a set of data independent of the training data set. Many theoretical works have shown that a single hidden layer is sufficient for ANN to approximate any complex nonlinear function. [Citation21] Therefore, in this research a one-hidden-layer feed-forward network based on the back propagation learning rule was used to differentiate sweet olives from bitter ones. The number of neurons within the hidden layer varied from 1 to 20. The hyperbolic tangent sigmoid was used as the transfer function both in the hidden layer and output layer. Minimization of error was achieved using the Levenberg-Marquardt algorithm. [Citation22] To carry out the aforementioned steps, the dataset (215 observations) was split into training (161 observations), validation (32 observations) and test (32 observations) data. Training sets used to develop models included colour parameters (R, G, B, L*, a* and b*) as inputs with associated 1 and −1 for sweet and bitter olives, respectively, as outputs. The aim of every training algorithm is to reduce this global error by adjusting the weights and biases.
Sensory evaluation
A trained panel of ten assessors carried out the sensory evaluation on the basis of nine-point hedonic scale. The grades of scale for evaluation of sensory attributes were: extremely dislike (1), very dislike (2), moderate dislike (3), slight dislike (4), not dislike not like (5), slight like (6), moderate like (7), very like (8) and extremely like (9). [Citation23] Judges were evaluated samples in colour and appearance, taste and aroma and texture overall acceptability.
Statistical analysis
The data were subjected to analysis of variance using the SAS statistical package. Differences among means were established using the Duncan’s multiple range test (p < 0.05). A Pearson’s correlation coefficient of colour indication (RGB and L*a*b*) and sensory test (colour, taste and aroma and texture) was calculated.
Results and discussion
Colour measurement
Olive colour changes during the process of removing bitterness were studied on two test environments of brine and water. Based on observations, RGB and L*a*b* colour spaces can be appropriate criterions for assessing the impact of testing environments on the quality of the olive fruit. Changes in the colour coordinates L*, a* and b* for both environments are presented in . The overall decline pattern in L*, for brine curing environment, showed that the samples were going to be darker with time throughout the measurement period. The average of L*, for aforementioned environment, decreased from 48.06 (day zero) to 25.72 (ninth day) as a result of reducing transparency and increasing the amount of brown colour level at the surface. Besides, the lowest L* (L* = 25.12) was observed at the seventh day of curing. While, for water curing environment in L* parameter decreased gradually until day three and showed a temporary increase until day 5 (L* = 31.69). The average of L*, for water curing environment, decreased from 48.06 (day zero) to 36.21 (ninth day). This indicated that the samples were tended to be darkened during sweetening process. The decrease in L* values can be attributed to brown pigment formation during the reducing olive bitterness processing which reducing olive bitterness taste. [Citation24–Citation26]
Figure 3. Changes in L*a*b* values using image analysis of olive during storage for nine day (a: L* Intensity, b: A* Intensity, c: b* Intensity).
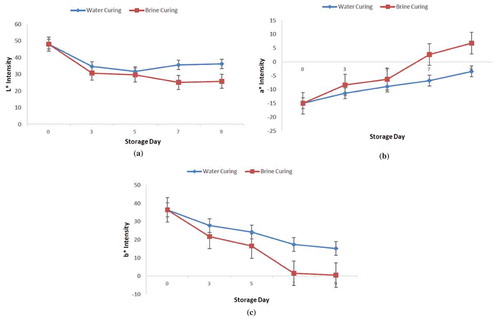
Since a* defines the red-green component, red for positive values and green for negative values and the b* parameter defines the yellow-blue component, yellow for positive values and blue for negative values [Citation12]; therefore, monitoring the variation of parameters a* and b* were also suitable for assessing the olive quality and removal of bitter taste from olive, simultaneously. The results of the analysis showed that the parameter a* was gradually increased from −14.98 (day zero) to 6.73 (ninth day) () for brine curing environment; −14.98 (day zero) to −4.09 (ninth day) for water curing environment ().This increasing of positive values for a* could be interpreted as a tendency of samples toward red colour. The highest value of this parameter for both environments was seen at day nine of curing. Moreover, a* values of brine curing was more than water curing which was the indication of a tendency of samples toward browning in brine curing environment. The b* parameter monotonously decreased from 36.37 to 0.51, for zero and ninth days, respectively (). Similar to those for olive in water curing samples is also shown in b* parameter changed from 36.37 (zero day) to 15.14 (ninth day). The decrease of the b* parameter in both testing environments reflects a trend toward blue.
and show the significance of the effects of storage time on colour parameters. Colour changes during sweetening process of olives verified that fruits with less bitter taste were darker (lower L* value), redder (higher a* value) and bluer (lower b* value).[Citation26] Measured parameter of colour on “yacon” slices using a computer vision system. According to their results, L* decreased from 65.9 to 60.8, with a tendency to a black colour; a* increased from 7.3 to 17.7, approaching a red colour; b* increased from 35.1 to 41.5, presenting a tendency to a yellow colour. These results are consistent with data obtained by. [Citation27,Citation28]
Table 1. Mean comparison of storage day and colour spaces RGB and L*a*b* (brine curing).
Table 2. Mean comparison of storage day and colour spaces RGB and L*a*b*(water curing).
The values of the RGB components in colour measurements during bitterness removal process with brine curing and water curing are presented in . According to the value of R colour parameters decreased from 108.79 to 71.25 and the least value of R (R = 64.62) has been occurred on the seventh day of curing. G parameter is also changed from 119.76 to 57.38 (); on the contrary, value of B increased from 49.78 to 60.31 during the sweetening process for brine curing environment ().
Figure 4. Changes in RGB values using image analysis of olive during storage for nine day (a: Red Intensity, b: Green Intensity, c: Blue Intensity).
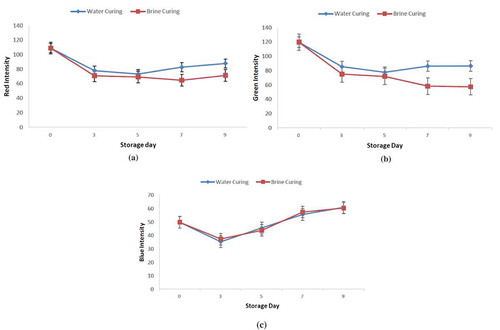
For water curing, the value of R colour parameters decreased from 108.79 (day zero) to 87.71 (ninth day) and the least value of R (R = 73.24) happened on the fifth day of storage (). G parameter is decreased from 119.76 to 86.44 (), however value of B increased from 49.78 to 60.76 (). and show the statistical analysis of the effects of processing treatments on colour changes during storage day. According to mean comparison, there was a significant difference between colour parameters R, G and B in the RGB colour space as well as between the three parameters L*, a* and b* for water and brine curing testing environments during days of storage ( and ). Furthermore, concord to and there are statistical differences between extracted colour parameters (L*, a*, b*, R, G and B) of the day zero of storage (p < 0.05) and other storage days. The statistical analysis showed that two testing environment were statistically separable (p > 0.05) for all variables (R, G, B, L*, a*, b*).
Sensory analysis
The data matrix used for statistical analyses was developed from the sensory scores awarded by each panelist. shows the time-course changes in the panel sensory test index of olive samples with respect to colour, taste, aroma and texture in a period of nine days. According to the sensory evaluation () the following tendencies can be deduced: (1) samples of day zero were less acceptable than other days for both water curing and brine curing, with green skin colour, hard tissue and very bitter taste; (2) during removing bitterness, the colour of the skin of olive changed from light green to dark green in brine curing environment, while the colour skin of olive remained light green in water curing environment but the aroma and texture parameters received the lowest score from the evaluators; (3) softness of skin increased gradually during the process of removing bitterness, while olive texture was softer in water curing environment and, these olives have attracted the attention of the individual; (4) taste and aroma parameters in brine curing received the higher score from the evaluators which means these parameters were better than water curing; (5) in the brine curing environment, olives of the seventh day of curing received the highest scores, while, for olives in water curing, the highest score from the evaluators was given to samples of the third day of curing. Therefore, optimal time to cure olives in the brine and water curing environment were the seventh and third day of curing, respectively.
Table 3. Mean comparison of storage day and sensory parameters (Water and brine curing).
Correlation of colour indication and sensory test
The correlation coefficients between the sensory test and the results obtained from computer vision system shown in and . According to , Pearson’s correlation for the water curing environment showed that there was a significant correlation (p < 0.05) between R with colour, test and aroma, texture and general acceptance parameters. Furthermore, L* and G were significantly (p < 0.05) correlated with test and aroma, texture and general acceptance parameters. Moreover, B had a significant relationship with all sensory parameters except texture. According to , Pearson’s correlation for the brine curing environment, there were a significant correlation between L*, a*, b*, R and G parameters with all sensory parameters and colour component B had only a significant correlation with the sensitivity parameter of colour at the 5% level of probability.
Table 4. Correlation between colour parameters and sensory test in water curing environment.
Table 5. Correlation between colour parameters and sensory test in brine curing environment.
Classification result
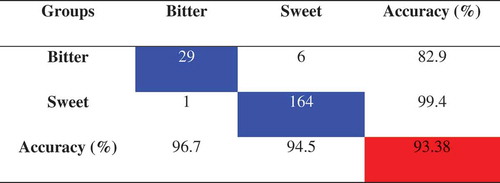
Classification of olive into two classes based on taste (bitterness and sweetness) was shown in . According to confusion matrix, bitter and sweet olives were classified with accuracy %96.7 and 94.5%, respectively (one bitter olive classified as sweet and six sweet ones classified as bitter olives). The overall accuracy of the classification was 93.38%. Similar accuracy (96.6%) was obtained by [Citation29] who used three layered 9-6-3 neural networks for the classification of apple. [Citation30] developed a grading system for fruit and vegetables using neural network technologies, obtaining a high level of accuracy for strawberry and green pepper (94–98% and 89%, respectively). [Citation31] Used image analysis to classify olives based on external damage. In this work seven commercial categories of olives, were used: undamaged olives, mussel-scale or ‘serpeta’, hail-damaged or ‘granizo’, mill or ‘rehús’, wrinkled olive or ‘agostado’, purple olive and undefined-damage or ‘molestado’. According to their results the correct classification percentages vary greatly depending on the categories, ranging 80–100% during calibration and 38–100% during validation. However, the classification accuracy of this work was much higher than that was reported by. [Citation31]
Figure 5. Classification results from the artificial neural network analysis of bitter and sweet olive groups.
Conclusion
In this study the effect of two curing environments on olive colour parameters was examined. To this end a computer vision system was developed to extract colour parameters of olive surface in two colour spaces RGB and L*a*b* during curing process. For colour space RGB, R and G values decrease while B value increases for both curing methods. For L*a*b* colour space, L* and b* values of samples reduce however the amount of a* increases. There were also significant relationship between colour features and sensory evaluation; the L*, R, G and B values showed a significant correlation with general acceptance results with correlation coefficient of −0.66, 0.73, −0.61 and −0.62, respectively, for water curing treatment. For brine curing treatment, results showed a significant correlation between L*, a*, b*, R and G with general acceptance with correlation coefficient of −0.95, 0.83, −0.89 and −0.96 at the level of 5%, respectively. Therefore, image analysis could be used to obtain the colour information of the entire surface of samples. Furthermore, it is possible to express various colour values and minimise errors by manual inspection.
Acknowledgments
The authors acknowledge the financial support provided by the Ramin Agriculture and Natural Resources University of Khuzestan.
References
- Azarmdel, H.; Amir-Hossein Afkari-Sayyah, A. H.; Ghaffari, H.; Alipasandi, A. Olive Classification According to RGB, HSV and L*A*B* Color Parameters Using Image Processing Technique. International Journal of Farming and Allied Sciences 2014, 3 (6), 653–658.
- Mafra, I.; Lanza, B.; Reis, A.; Marsilio, V.; Campestre, C.; De Angelis, M.; Coimbra, M. A. Effect of Ripening on Texture, Microstructure and Cell Wall Polysaccharide Composition of Olive Fruit (Olea Europaea). Physiol Plant 2001, 111, 439–447.
- Andrewes, P.; Busch, J. L. H. C.; De Joode, T.; Groenewegen, A.; Alexandre, H. Sensoryproperties of Virgin Olive Oilpolyphenols: Identification of Deacetoxy-Ligstrosideaglycon as a Keycontributor to Pungency. Journal of Agriculture Food Chemistry 2003, 51 (5), 1415–1420.
- Hunt, R. W. G.; Pointer, M. R. Measuring Colour; India: John Wiley & Sons, 2011.
- Pedreschi, F.; Leon, J.; Mery, D.; Moyano, P. Development of a Computer Vision System to Measure the Color of Potato Chips. Food Research International 2006, 39, 1092–1098.
- Azizi, A.; Abbaspour-Gilandeh, Y.; Nooshyar, M.; Afkari-Sayah, A. Identifying Potato Varieties Using Machine Vision and Artificial Neural Networks. International Journal of Food Properties 2016, 19 (3), 618–635.
- Trussell, H. J.; Saber, E.; Vrhel, M. Color Image Processing: Basics and Special Issue Overview. IEEE Signal Processing Magazine 2005, 22 (1), 14–22.
- Zhang, Y.; Wang, S.; Phillips, P.; Ji, G. Binary PSO with Mutation Operator for Feature Selection Using Decision Tree Applied to Spam Detection. Knowledge Based System 2014, 64, 22–31.
- Blasco, J.; Cubero-Garca, S.; Alegre-Sosa, S.; Gomez-Sanchs, J.; Lopez-Rubira, V.; Molt, E. Short Communication. Automatic Inspection of the Pomegranate (Punicagranatum L.) Arils Quality by Means of Computer Vision. Spanish Journal of Agricultural Engineering 2008, 6 (1), 12–16.
- Kılıç, K.;. Boyacı, ˙I.H; Köksel, H.; Küsmeno˘glu, ˙I.A. Classification System for Beans Using Computer Vision System and Artificial Neuronal Networks. Journal Food Engineering 2007, 78, 897–904.
- Díaz, R.; Gil, L.; Serrano, C.; Blasco, M.; Moltó, E.; Blasco, J. Comparison of Three Algorithms in the Classification of Table Olives by Means of Computer Vision. Journal Food Engineering 2004, 61, 101–107.
- Guzmán, E.; Baeten, V.; Fernández Pierna, J. A.; García-Mesa, J. A. Determination of the Olive Maturity Index of Intact Fruits Using Image Analysis. Journal Food Science Technology 2015, 52 (3), 1462–1470.
- Arroyo-López, F. N.; Querol, A.; Bautista-Gallego, J.; Garrido-Fernández, A. Role of Yeasts in Table Olive Production. International Journal of Food Microbiology 2008, 128 (2), 189–196.
- Otsu, N.;. A Threshold Selection Method from Gray-Level Histograms. IEEE Transactions Systems, Man, and Cybernetics Smc 1979, 9 (1), 62–66.
- Leon, K.; Mery, D.; Pedreschi, F.; Leon, J. Color Measurement in L* A* B* Units from RGB Digital Images. Food Research International 2006, 39 (10), 1084–1091.
- Zareifard, M. R.; Savard, T.; Marcotte, M.; Lecompte, J. Y.; Grabowski, S. Combined Effects of Mild Acidification and Thermal Treatment on Color and Texture of Green Beans. International Journal of Food Properties 2015, 18 (8), 1847–1862.
- Granato, D.; Masson, M. L. Instrumental Color and Sensory Acceptance of Soy-Based Emulsions: A Response Surface Approach. Science and Technology (Campinas) 2010, 30 (4), 1090–1096.
- Hosseinpour, S.; Rafiee, S.; Mohtasebi, S. S.; Aghbashlo, M. Application of Com-Puter Vision Technique for On-Line Monitoring of Shrimp Colour Changes during Drying. Journal Food Engineering 2012, 115, 99–114.
- Saldana, E.; Siche, R.; Castro, W.; Huamán, R.; Quevedo, R. Measurement Parameter of Color on Yacon (Smallanthus Sonchifolius) Slices Using a Computer Vision System. LWT - Food Science and Technology 2014, 59 (2), 1220–1226.
- CIE. Industrial Colour-Difference Evaluation (Technical Report). Publication CIE No. 116. Vienna: Central Bureau of the Commission International de L’Eclairage, 1995.
- Dogan, A.; Demirpence, H.; Cobaner, M. Prediction of Groundwater Levels from Lake Levels and Climate Data Using ANN Approach. Water SA 2008, 34 (2), 199–208.
- Cakmak, Y. S.; Boyaci, İ. H. Quality Evaluation of Chickpeas Using an Artificial Neural Network Integrated Computer Vision System. International Journal of Food Science & Technology 2011, 46 (1), 194–200.
- Goudarzi, M.; Madadlou, A.; Mousavi, M.; Emam-Djomeh, Z. Formulation of Apple Juice Beverages Containing Whey Protein Isolate or Whey Protein Hydrolysate Based on Sensory and Physicochemical Analysis. Society of Dairy Technology 2014, 67, 1–9.
- Arias, E.; López-Buesa, P.; Oria, R. Extension of Fresh-cut “Blanquilla” Pear (Pyruscommunis L.) Shelf-life by 1-MCP Treatment after Harvest. Postharvest Biology and Technology 2009, 54, 53–58.
- Cho, J. S.; Jeong, M. C.; Moon, K. D. Effects of Ultrasound and Ascorbic Acid Co Treatment on Browning of Fresh-Cut ‘Tsugaru’ Apples. Korean Korean Journal of Food Preservation 2012, 19 (3), 323–327.
- Chung, H. S.; Kim, H. S.; Lee, Y. G.; Seong, J. H. Effect of Deastringency Treatment of Intact Persimmon Fruits on the Quality of Fresh-cut Persimmons. Food Chemistry 2015, 166, 192–197.
- Segnini, S.; Dejmek, P.; Öste, R. A Low Cost Video Technique for Colour Measurement of Potato Chips. LWT - Food Science and Technology 1999, 32 (4), 216–222.
- Krokida, M. K.; Maroulis, Z. B.; Saravacos, G. D. The Effect of the Method of Drying on the Colour of Dehydrated Products. Food Science and Technology 2011, 36 (1), 53–59.
- Yang, Q. Classification of Apple Surface Features Using Machine and Neural Networks. Computers and Electronics in Agriculture 1993, 9, 1–12.
- Nagata, M.; Cao, Q.; Bato, P. M.; Shrestha, B. P.; Kinoshita, O. Basic Study on Strawberry Sorting System in Japan. In 1997 ASAE Annual International Meeting, Paper No. 973095. St. Joseph, Michigan, USA: ASAE, 1997.
- Riquelme, M. T.; Barreiro, P.; Ruiz-Altisent, M.; Valero, C. Olive Classification according to External Damage Using Image Analysis. Journal of Food Engineering 2008, 87 (3), 371–379.