
ABSTRACT
The substitution of rat meat (non-halal meat) in beef-based sausage products is illegal practice. This study was aimed to develop Fourier transform infrared (FTIR) spectroscopy in combination with chemometrics for analysis of rat meat in sausage employing three different lipid extraction techniques. Lipid was extracted from the sausages using Bligh and Dyer, Folch, and Soxhlet methods. The lipid extracted was then analyzed using FTIR spectroscopy combined with chemometrics of principal component analysis (PCA) and partial least square (PLS) calibration. The absorbance values at wavenumbers region of 750–1800 cm−1 were selected in PCA for classification and PLS modeling for quantification. PCA was successfully used to classify rat meat and beef lipids extracted by the three lipid extraction methods. The coefficient of determination (R2) and root mean square error of calibration (RMSEC) during PLS calibration modeling on lipid extracted from beef–rat meat sausages using Bligh and Dyer, Folch, and Soxhlet method were 0.945 and 2.73%; 0.991 and 1.73%; 0.992 and 1.69%, respectively. The validation study showed that R2 and root mean square error of prediction values for the correlation between actual value of rat meat and FTIR predicted value using lipids extracted by Folch and Soxhlet method were 0.458 and 18.90%, and 0.983 and 4.21%, respectively. Statistical analysis using independent t-test (p = 0.95) showed that there were significant differences on the content of some fatty acids of beef lipid and rat lipid as determined using gas chromatography. The contents of fatty acids of C12:0, C16:0, C16:1 cis 9, and C18:0 in rat lipid were higher than those in beef lipid, and the otherwise was observed for fatty acids of C14:1 cis 9, C15:0, C17:0, C17:1 cis 10, unsaturated C18, and C21:0. The difference in lipid composition, as indicated in FTIR spectra profiles and fatty acid composition, can be used as fingerprint technique for analysis of rat meat in beef sausage for halal authentication purpose.
Introduction
The substitution of high price meat such as beef with lower priced meat is one of the meat product adulteration practices. Considering rat meat is cheap and relatively easy to obtain, unethical producers to intentionally incorporate rat meat into beef-based products such as meatball and sausage to get economical profit. This practice was reported by Indonesian Drug and Control Agency (2014) in which rat meat was incorporated into beef meatball and other beef-based food products. In religious point of view, rat meat is forbidden to be consumed by Muslim community and categorized as non-halal meat.[Citation1] Rat meat is also a vector for some diseases namely leptospirosis, hantavirus pulmonary syndrome, salmonellosis, Lassa fever, and tularemia. While the consumer protection has become more significant issue, this adulteration practice need to be identified by development analytical method capable of detecting rat meat in food products.
Beef sausage is one of the popular meat products in Indonesia. In Indonesian market, beef sausage products sold without registration code and halal certificate are common. This product is more susceptible to be adulterated. Certification based on the laboratory analysis is taken into account as one effort to prevent adulteration of beef sausage with rat meat. There are some reported methods used to analyze meat product adulterations, namely Enzyme Linked Immunosorbent Assay (ELISA),[Citation2] capillary electrophoresis,[Citation3] electrochemical,[Citation4] Polymerase Chain Reaction method,[Citation5] electronic nose,[Citation6] and Raman spectroscopy.[Citation7] Each of the method has a drawback, for example ELISA approach might not suitable in heated food products,[Citation2] while electronic nose can only be applied in the analysis of volatile compounds.[Citation6] The other mentioned methods are more complex and expensive.[Citation3–Citation5,Citation7] Therefore, a simple method such as Fourier transform infrared (FTIR) spectroscopy, especially in combination with chemometrics techniques, has been developed, proposed, and used for identification of meat adulteration.
Due to its capability as fingerprint technique, FTIR spectroscopy is one of analytical methods used to identify the adulterated meat in food products. FTIR spectroscopy combined with some chemometric techniques can be used as a rapid method to find out meat composition as well as adulteration practice.[Citation8] FTIR spectroscopy combined with several chemometrics techniques has been reported for analysis of pork in beef meatball,[Citation9] analysis of lard in meatball broth,[Citation10] and analysis of rat meat in beef meatball.[Citation11] Analysis of meat in food products involved lipid extraction, FTIR spectra acquisition, and data analysis using chemometrics approach.
Different species will produce different lipid components.[Citation12] Triglycerides, as lipids major component,[Citation12] have different substitution patterns, length, and degree of unsaturation.[Citation13] As a consequence, lipid extracted from meat have specific FTIR spectra and fatty acid composition. Both FTIR spectra and fatty acid composition of lipids are fingerprint in nature. Lipid can be obtained by extraction using certain solvents or mixture of solvents. The commonly used methods for lipid extraction are Bligh and Dyer, Folch, and Soxhlet. The different lipid extraction methods would produce different total lipids[Citation14] and lipid contents,[Citation15] even if those methods were applied in the same samples. These differences can be observed from FTIR spectra, especially in combination of chemometrics. In this study, FTIR spectroscopy combined with chemometrics techniques using three different lipid extraction methods was used to determine the presence of rat meat in beef sausage. The fatty acid profiles of the triglyceride of the rat lipid and beef lipid were also studied by gas chromatography.
Materials and methods
Materials and instruments
Rat meat (Rattus argentiventer) was obtained from local farmer in Yogyakarta, Indonesia, while beef and three commercial beef sausage products were purchased from local market in the same area. All the samples were stored at −20°C before further processing. The fatty acid methyl ester (FAME Mix 37 Component) and individual standards of 10 methyl ester of C6:0, C8:0, C10:0, C12:0, C14:0, C16:0, C17:0, C18:0, C22:0, C24:0 were obtained from Sigma Aldrich (USA). The reagents and solvents used were of proanalytical grade.
Sample preparation
The reference of 100% beef sausage and adulterated beef sausage with rat meat was prepared in the laboratory. Minced beef and/or rat meat was mixed with tapioca flour, egg, and spices (garlic, pepper, salt, and sugar). The meat and other ingredients were transferred into sausage casings before being boiled in water for 15 min. The sausages were then stored at −20°C. Prior to the analysis, the sausages were thawed and then minced using commercial blender.
Preparation of calibration and validation standards
The calibration standards were prepared by spiking rat meat into beef sausages at concentrations of 10, 20, 30, 40, 50, 60, 70, 80, and 90% (). Sausages containing 100% of rat meat and 100% of beef were also made to observe the difference between the lipid spectra. For validation, another series of sausages containing rat meat and beef with known amount concentration were also prepared. The lipid was extracted from the sausages using three different lipid extraction methods, namely Bligh and Dyer, Folch, and Soxhlet method in duplicate (for 10–90%) and triplicate (for 0 & 100%).
Table 1. Formula of the beef–rat meat sausage.
Lipid extraction by Bligh and Dyer
Extraction of lipid using Bligh and Dyer was performed according to Pérez-Palacios et al.[Citation14] with slight modification. A-20.0 g of minced sausage was placed into two centrifuge tubes. Each of the tubes contained approximately 10 g of sample. A-30 mL of chloroform-methanol (1:2 v/v) was added into each of the tube. The mixture was vortexed for 15 min, centrifuged (10 min, 3000 rpm), and filtered by filter paper. The filtrate from each tube was collected together in a separating funnel. The residue remained in the tube was added with 10 mL chloroform, vortexed for 15 min, centrifuged (10 min, 1248 g), and filtered by filter paper. The filtrate was collected with the previous filtrate. The filtrate was mixed with 20 mL of distilled water and shaken vigorously. The mixture was allowed to stand until the biphasic system appeared. The upper aqueous phase was discarded. The lower phase (chloroform) was separated through anhydrous sodium sulfate. The chloroform was evaporated using vacuum rotary evaporator (Eyela, Tokyo Rikakikai Co., Ltd., Japan) at 40°C. The lipid extract was then transferred into vial and evaporated at 40°C using oven (Memmert GmbH + Co.KG, Germany) until the solvent was completely removed.
Lipid extraction by Folch
The Folch extraction method was carried out according to Pérez-Palacios et al.[Citation14] with slight modification. A-10.0 g of minced sausage was mixed with 200 mL of chloroform-methanol (2:1 v/v). The mixture was homogenized in a Turrax homogenizer (10 min, 13.500 rpm) and filtered by filter paper. The filtrate was placed in a separating funnel, mixed with 10 mL of distilled water, and shaken vigorously. The mixture was allowed to stand until the biphasic system was formed. The upper (aqueous) phase was discarded. Anhydrous sodium sulfate was added into the lower phase (chloroform), mixed, and filtered by filter paper. The chloroform was evaporated by rotary evaporator under vacuum at 40°C. Thick lipid extract was then transferred into the vial and evaporated at 40°C using oven until the solvent was completely removed.
Lipid extraction using Soxhlet method
Lipid extraction using Soxhlet method was performed according to Rahmania et al.[Citation12] A-20.0 g of minced sausage was wrapped with filter paper and placed into the Soxhlet apparatus. A-175 mL of n-hexane was used as extracting solvent. The extraction was performed for 8 h at 100°C (±50 cycles). The lipid extract was added with anhydrous sodium sulfate, mixed, filtered by filter paper, and then evaporated by vacuum rotary evaporator at 40°C. The lipid extract was then transferred into vial and evaporated at 40°C using oven until the solvent was completely removed.
FTIR spectra acquisition
The lipids obtained by three different lipid extraction methods were placed in attenuated total reflectance (ATR) crystal at ambient temperature (25°C). The spectrum was acquired in the wavenumbers region of 450–4000 cm−1 using ABB MB3000 FTIR spectrophotometer (Clairet Scientific, Northampton, UK). The instrument was equipped with a detector of deuterated triglycine sulfate (DTGS) and a beam splitter of KBr. The spectra were recorded as absorbance values with 32 scanning, at a resolution of 8 cm−1 against air spectra as the reference. The spectrum was processed using Horizon MB software version 3.0.13.1 (ABB, Canada).
Determination of fatty acid profiles
Analysis of fatty acid composition was carried out toward lipid extracted using three different lipid extraction methods from rat meat–beef sausage at concentration 0% (contained beef lipid only) and 100% (contained rat lipid only). Therefore, there were six samples analyzed. The lipids were dissolved in 1.0 mL of n-heptane and then added with 200 µL of NaOCH3 0.2 N. The solutions were heated at 70°C for 10 min and shaken every 2 min. The solutions were added with 1.5 mL of BF3 (~10% conc. in methanol), heated at 70°C for 10 min. The solutions were allowed to cool and then added with 1.5 mL of saturated NaCl solution. The supernatant containing fatty acid methyl ester (FAME) was then injected into gas chromatograph. As standard, FAME Mix 37 Component from Sigma, previously diluted 10 times, was used. Each single FAME standards was prepared at concentration stated in the certificate of analysis (CoA). Analysis was performed by gas chromatography-flame ionization detection (GC-FID) according to Kumar et al.[Citation16] GC-FID Agilent 7890B GC (Agilent Technologies, Germany) was equipped with HP-5 column (30 m × 0.32 mm × 0.25 µm). Helium ultrapure was used as the carrier gas and the flow rate was set at 2.99 mL/min. Injector port was set at 260°C. One µL of each of the standard and the sample was injected into the system with split ratio 15:1. Oven temperature was initially hold at 160°C for 2 min, then gradually increased into 270°C at 10°C/min rate and hold for 5 min. Flow rate of the air, hydrogen ultrapure, and make-up gas were set at 400 mL/min, 40 mL/min, and 30 mL/min, respectively. Temperature of the detector was set at 260°C. Elution order of the fatty acids in mixture standard was determined by considering retention time of the single standard peak and elution order of 37 FAME standard, previously defined by et al.[Citation16] The percentage of fatty acid was calculated as relative percentage (%) of the total area obtained in the chromatogram.
Statistical analysis
FTIR spectra of the lipid obtained from three different techniques were subjected to chemometrics of principal component analysis (PCA) and partial least square (PLS) model. PCA is the technique to reduce the amount of data when the correlation is present.[Citation17] PCA was used to classify if the samples were included as rat lipid group or beef lipid group. Accuracy of PLS calibration model for quantification of rat meat in sausage was evaluated using coefficient of determination, while the precision during calibration and validation models were evaluated using root mean square error of calibration (RMSEC) and root mean square error of prediction (RMSEP), respectively.
Yi and Ŷi represent actual and predicted value of the rat meat in beef sausage, while M and N are the number of data in calibration and validation set.[Citation11] The percentage (%) of predicted value was calculated using new regression equation generated by omitting one concentration level of the data set (leave one out method). High predictive power of the model is demonstrated by high coefficient determination value and low values of RMSEC and RMSEP. [Citation18] PCA and PLS regression were carried out using software Horizon MB version 3.0.13.1 (ABB, Canada).
Results and discussion
Among three different extraction systems used in this study, the Soxhlet method was the most simple and easiest compared to Bligh and Dyer and Folch. Both Bligh and Dyer and Folch methods produced lipids in the form of brown yellowish oil, while Soxhlet produced yellowish oil. The amount of the lipid produced using Folch was higher than that in Bligh and Dyer method due to the high ratio of solvent to sample.[Citation15]
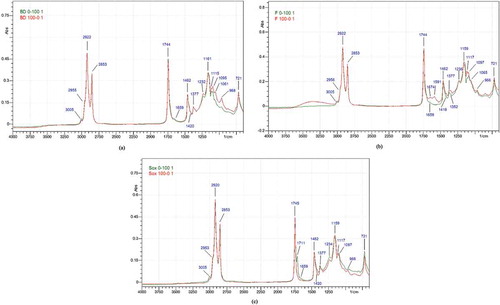
The FTIR spectra of lipid obtained from three different techniques have similar profiles. showed lipid spectra of beef lipid and rat lipid extracted using Bligh and Dyer, Folch, and Soxhlet methods. A peak at approximately 3005 cm−1 was due to the stretching vibration of C-H in = C-H cis. Asymmetrical stretching vibration of –CH3 was observed from the peak at 2953/2955/2956 cm−1. The functional group –CH2 is presented the peaks at 2920/2922 cm−1 and 2853 cm−1 consecutively as the results of asymmetrical and symmetrical vibration. The carbonyl (C = O) group of the triglyceride ester was shown by peak at 1744/1745 cm−1. [Citation13] Peak at 1711 cm−1 was assigned to C = O group of free fatty acid. Disubstituted trans and cis olefin absorbed near 1674 cm−1 and 1659 cm−1 as the result of C = C stretching vibration, respectively. Scissoring of –CH2 was identified by the peak at 1462 cm−1, while rocking of = C-H of cis disubstituted olefin was identified by the peak at 1418/1420 cm−1. Peak at 1377 cm−1 belongs to symmetrical bending of –CH3. The peaks at 1232/1234/1236 cm−1, 1159/1161 cm−1, 1115/1117 cm−1, and 1095/1097 cm−1 could be attributed to the stretching vibration of C-O from ester.[Citation19] Out of plane bending vibration of = C-H from trans disubstituted olefin was observed by the peak at 966 cm−1. The peak at 721 cm−1 was associated with rocking vibration of –CH2 and out of plane bending vibration of = C-H from cis disubstituted olefin.
Figure 1. FTIR spectra of the lipid extracted from beef–rat meat sausage at concentration 0% (beef lipid) and 100% (rat lipid) using Bligh and Dyer method (a), Folch method (b), and Soxhlet method (c). Rat lipid (green), beef lipid (red).
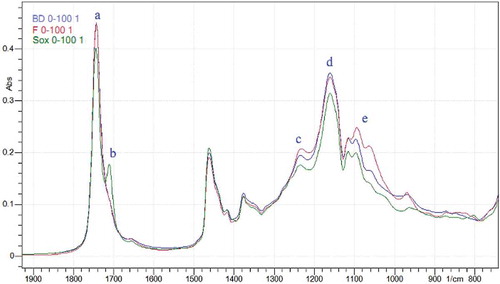
Due to its property as fingerprint spectra, rat lipids extracted from three different methods showed some differences as shown in . The intensity of peak (a) that was attributed to the C = O of fatty acid in triglyceride was lower in the lipid extracted with Soxhlet than that in the other two methods. Peak (b) assigned to C = O of free fatty acid was only observed in the spectra of rat lipid extracted with Soxhlet. The triglycerides might be hydrolyzed during extraction. The lowest intensity of the peaks (c, d, and e) in rat lipid spectra was belong to the lipid extracted with Soxhlet. These peaks were present as a result of stretching vibration of C-O in ester. Therefore, rat lipid extracted using Soxhlet revealed the lowest number of triglycerides. These peak differences are further used for classification and quantification of rat lipid in sausage using PCA and PLS calibration, respectively.
Figure 2. The overlay of FTIR spectra of the lipid extracted from beef–rat meat sausage at concentration 100% (rat lipid) using Bligh and Dyer (blue), Folch (red), and Soxhlet (green) method, (a) 1745 cm−1 (b) 1711 cm−1 (c) 1232 cm−1 (d) 1161 cm−1 (e) 1095 cm−1.
Principal component analysis
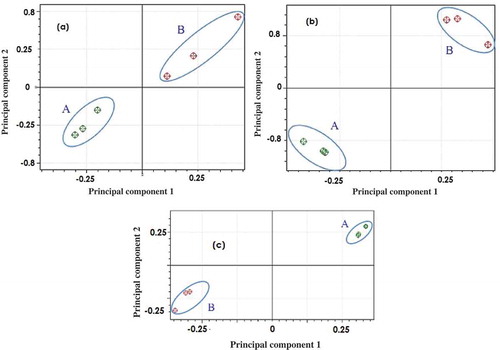
PCA was applied for classification of rat lipid and beef lipid using absorbances at 750–1800 cm−1 as variables. The selection of these wavenumbers is based on its capability to provide good classification among samples. demonstrated the score plots along the first principle component (PC1) and second principle component (PC2) which made good separation between the group of rat lipid and beef lipid for each extraction methods. The percentage (%) variability of PC1 and PC2 of Bligh and Dyer, Folch, and Soxhlet was 97.57% and 1.28%, 85.50% and 10.64%, as well as 97.86% and 2.02%, respectively. PC 1 comprised the most variation of the data. Based on the result, it was concluded that PCA can be accomplished to classify between rat lipid and beef lipid extracted with three different lipid extraction methods.
Figure 3. Score plot of PCA of the spectrum of the lipid extracted from beef–rat meat sausage (rat lipid 100% and beef lipid 100%) with Bligh and Dyer (a), Folch (b), and Soxhlet (c) using PC1 vs PC2. Rat lipid group (A), beef lipid group (B).
Quantification of rat lipid using PLS calibration
The lipids extracted from beef–rat meat sausages at 11 concentration levels (0–100%) were subjected to FTIR spectra measurement and the concentration of lipid was analyzed using PLS calibration at wavenumbers region of 750–1800 cm−1. The region was selected due to its power to give the best predictability model, tested by calculating the value of coefficient of determination (R2) to evaluate the accuracy, and the RMSEC to evaluate the precision. The accuracy and precision of model were represented by the high value of R2 and the low value of the RMSEC.
shows the summary results of PLS regression analysis during analysis of lipid extracted from beef–rat meat sausages at 11 concentration levels using three different lipid extraction methods. The R2 values for the relationship between actual value of lipid from rat meat and FTIR predicted value using Bligh and Dyer, Folch, and Soxhlet method were 0.945, 0.991, and 0.992, respectively. The RMSEC values were 2.73% for Bligh and Dyer, 1.73% for Folch, and 1.69% for Soxhlet method. The extraction using Folch and Soxhlet method produced high value of R2 and low value of RMSEC. The PLS calibration model generated using FTIR spectra of lipids extracted using Folch and Soxhlet method has better accuracy and precision than that using Bligh and Dyer. Thus, these two extraction methods were suitable as lipid extraction tools and were further used for quantification of lipid from rat meat.
The calibration model was then validated using external validation with new set of samples.[Citation20] Cross validation was run by extracting lipid from beef sausages containing rat meat at any concentration levels with Folch and Soxhlet method. The developed model was used to calculate the percentage (%) of predicted value in validation sample. The predicted value of the lipid extracted by Folch method did not reveal good correlation with the actual value. The R2 value was 0.458, while the RMSEP was 18.90%. Folch method produced low value of R2 and high value of RMSEP may be due to data over fitting caused by noise. If the data is over fitted, even if there is a good correlation between predictor and response variables, the model does not have adequate predictive power and model would be inaccurate. PLS regression of the lipid extracted by Soxhlet method resulted R2 and RMSEP values of 0.983 and 4.21%, respectively, indicating that model developed using Soxhlet method was the most appropriate for predicting rat lipid concentration in beef sausages. Therefore, Soxhlet method was preferred as extracting method.
Analysis of the market samples
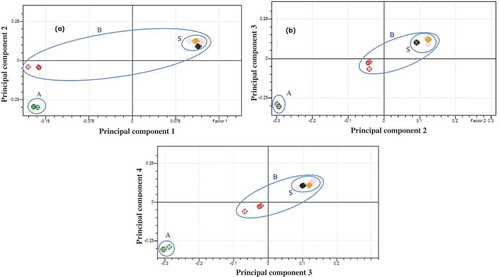
Soxhlet method was used to extract the lipid of the market samples. The studied samples consisted of samples 1 and 2 (branded without registration code and halal certificate) and samples 3 (branded, having registration code, and halal certificate). FTIR spectra of the lipid extracted from market sample were compared with those of rat lipid and beef lipid. Score plots from PCA analysis () showed that the spectra of the lipid extracted from market samples were similar. The plotted points (dots) representing the market samples were stand near the dots of the beef lipid group and far off from the rat lipid group. The closer the dots of the market samples to the beef lipid group, the bigger the possibility of the market samples to be beef sausages. Using four principal components (PC1-PC4), the dots of the market samples were separated from rat lipid group. The variability percentage of the PC1 to PC4 was 97.86%, 2.02%, 0.09%, and 0.03%, respectively. Therefore, it could be concluded that the evaluated samples probably do not contain rat meat.
Figure 4. Score plot of PCA of lipid extracted from beef–rat meat sausage (rat lipid 100% and beef lipid 100%) and the market samples with Soxhlet method using PC1 vs PC2 (a), PC2 vs PC3 (b), and PC3 vs PC4 (c). Rat lipid group (A), beef lipid group (B), and market sample group (S).
Fatty acid analysis
Every species has its own characteristic of fatty acid profiles, even in the same species, and any variation can be observed because of genetic effect, environment, interactions of genotype, and environment and diet.[Citation12] Therefore, to determine the difference of fatty acid profiles between two species and to find out the effect of the lipid extraction method to fatty acid profile of the extracted lipid, the rat lipid, and beef lipid was analyzed using gas chromatography. revealed the chromatogram obtained for the fatty acid methyl ester (FAME) analysis. The elution order of the peak was arranged according to the retention time of the individual standard peaks, main peaks obtained in the chromatogram of FAME mixture standard, and that obtained by Kumar et al.[Citation16] Internal normalization technique was applied to calculate relative percentage of each fatty acid. The results of fatty acid composition were summarized in .
Table 2. PLS regression analysis result of the spectra of rat lipid and beef lipid extracted using three different lipid extraction methods.
Table 3. Relative percentage of fatty acid compositions of rat lipid and beef lipid extracted using three different extraction methods.
Figure 5. Chromatogram of 37 Component FAME Mix mixture standard. Peak elution order: 1.C6:0, 2.C8:0, 3.C10:0, 4.C11:0, 5.C12:0, 6.C13:0, 7.C14:1 cis 9, 8.C14:0, 9.C15:1 cis 9, 10.C15:0, 11.C16:1 cis 9, 12.C16:0, 13.C17:1 cis 10, 14.C17:0, 15–18.Unsaturated C18, 19.C18:0, 20–24.Unsaturated C20, 25.C20:0, 26.C21:0, 27–29.Unsaturated C22, 30.C22:0, 31.C23:0, 32.C24:1 cis 15, 33.C24:0.
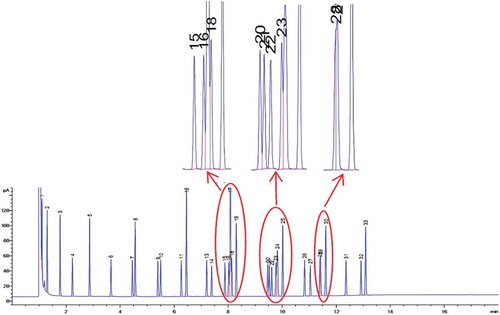
There were some overlapping peaks in the chromatogram of FAME mixture standard, especially in 8–12 min of elution, so that it was rather difficult to assign the corresponding peaks. Therefore, the peaks were considered to be the total of unsaturated C18, C20, and C22. The same trend of fatty acid profiles was observed in three lipid extraction methods. The lipid extracted by Folch contained highest triglyceride content due to the highest contents of total saturated and unsaturated fatty acid (). The statistical test using independent t-test (p = 0.95) was carried out to test the difference between rat lipid and beef lipid. The result showed that there were significant differences in the content of C12:0, C15:0, C16:0, C17:0, C18:0, C21:0, C14:1 cis 9, C16:1 cis 9, C17:1 cis 10, and unsaturated 18. The content of fatty acids of C12:0, C16:0, C16:1 cis 9, and C18:0 in rat lipid were higher than that in beef lipid, on the otherwise was observed for fatty acids of C14:1 cis 9, C15:0, C17:0, C17:1 cis 10, unsaturated C18, and C21:0. Saturated fatty acid content in rat lipid was higher than that in beef lipid, while the otherwise was observed for unsaturated fatty acid.
Conclusion
FTIR spectroscopy at wavenumbers region of 750–1800 cm−1 combined with chemometrics techniques can be used to analyze rat lipid in beef sausage. The lipid extracted using Bligh and Dyer, Folch, and Soxhlet methods in combination with PCA was successfully used for the identification of rat lipid in beef sausage. For quantification of rat lipid using PLS calibration, the Soxhlet method was preferred than other extraction methods due to its capability to provide accurate and precise method. The content of unsaturated fatty acids in rat lipid was lower than that in beef lipid, while the content of saturated fatty acid was inversely observed. The contents of C12:0, C16:0, C16:1 cis 9, and C18:0 in rat lipid were higher than those in beef lipid, on the otherwise was observed for fatty acids of C14:1 cis 9, C15:0, C17:0, C17:1 cis 10, unsaturated C18, and C21:0.
Acknowledgment
This research was financially supported by a grant from Directorate General of Research and Development Strengthening, Ministry of Research, Technology, and Higher Education Republic Indonesia (formerly Directorate General of Higher Education, Ministry of Education and Culture), through the project number of LPPM-UGM/346/LIT/2014.
References
- Nakyinsige, K.; Man, Y. B. C.; Sazili, A. Q. Halal Authenticity Issues in Meat and Meat Products. Meat Science 2012, 91, 207–214.
- Asensio, L.; González, I.; García, T.; Martín, R. Determination of Food Authenticity by Enzyme-Linked Immunosorbent Assay (ELISA). Food Control 2008, 19, 1–8.
- Vallejo-Cordoba, B.; Rodríguez-Ramírez, R.; González-Córdova, A. F. Capillary Electrophoresis for Bovine and Ostrich Meat Characterisation. Food Chemistry 2010, 120, 304–307.
- Hung, C.-J.; Ho, H.-P.; Chang, -C.-C.; Lee, M.-R.; Franje, C. A.; Kuo, S.-I.; Lee, R.-J.; Chou, C.-C. Electrochemical Profiling Using Copper Nanoparticle-Plated Electrode for Identification of Ostrich Meat and Evaluation of Meat Grades. Food Chemistry 2011, 126, 1417–1423.
- Kesmen, Z.; Celebi, Y.; Güllüce, A.; Yetim, H. Detection of Seagull Meat in Meat Mixtures Using Real-Time PCR Analysis. Food Control 2013, 34, 47–49.
- Tian, X.; Wang, J.; Cui, S. Analysis of Pork Adulteration in Minced Mutton Using Electronic Nose of Metal Oxide Sensors. Journal of Food Engineering 2013, 119, 744–749.
- Boyacı, İ. H.; Temiz, H. T.; Uysal, R. S.; Velioğlu, H. M.; Yadegari, R. J.; Rishkan, M. M. A Novel Method for Discrimination of Beef and Horsemeat Using Raman Spectroscopy. Food Chemistry 2014, 148, 37–41.
- Sentandreu, M. Á.; Sentandreu, E. Authenticity of Meat Products: Tools against Fraud. Food Research International 2014, 60, 19–29.
- Rohman, A.; Sismindari,; Erwanto, Y.; Che Man, Y. B. Analysis of Pork Adulteration in Beef Meatball Using Fourier Transform Infrared (FTIR) Spectroscopy. Meat Science 2011, 88, 91–95.
- Kurniawati, E.; Rohman, A.; Triyana, K. Analysis of Lard in Meatball Broth Using Fourier Transform Infrared Spectroscopy and Chemometrics. Meat Science 2014, 96, 94–98.
- Rahmania, H.; Sudjadi,; Rohman, A. The Employment of FTIR Spectroscopy in Combination with Chemometrics for Analysis of Rat Meat in Meatball Formulation. Meat Science 2015, 100, 301–305.
- Petrón, M. J.; Muriel, E.; Timón, M. L.; Martı́n, L.; Antequera, T. Fatty Acids and Triacylglycerols Profiles from Different Types of Iberian Dry-Cured Hams. Meat Science 2004, 68, 71–77.
- Guillén, M. D.; Cabo, N. Characterization of Edible Oils and Lard by Fourier Transform Infrared Spectroscopy. Relationships between Composition and Frequency of Concrete Bands in the Fingerprint Region. Journal of the American Oil Chemists Society 1997, 74, 1281–1286.
- Pérez-Palacios, T.; Ruiz, J.; Martín, D.; Muriel, E.; Antequera, T. Comparison of Different Methods for Total Lipid Quantification in Meat and Meat Products. Food Chemistry 2008, 110, 1025–1029.
- Pérez-Palacios, T.; Ruiz, J.; Ferreira, I. M. P. L. V. O.; Petisca, C.; Antequera, T. Effect of Solvent to Sample Ratio on Total Lipid Extracted and Fatty Acid Composition in Meat Products within Different Fat Content. Meat Science 2012, 91, 369–373.
- Kumar, A.; Lindley, M. R.; Mastana, S. S. A Time Efficient Adaptation of GC-FID Method for the Analysis of PBMC Lipid Composition. Journal of Biochemical Technology 2014, 5, 760–764.
- Miller, J. M.; Miller, J. C. Statistics and Chemometrics for Analytical Chemistry; Fifth, Pearson Education Limited: London, 2005; 213-219, 234-236.
- Gurdeniz, G.; Ozen, B. Detection of Adulteration of Extra-Virgin Olive Oil by Chemometric Analysis of Mid-Infrared Spectral Data. Food Chemistry 2009, 116, 519–525.
- Silverstein, R. M.; Webster, F. X.; Kiemle, D. J. Spectrometric Identification of Organic Compounds; Seventh, John Wiley & Sons, Inc: United States of America, 2005; Vol. 98.
- Broadhurst, D.; Goodacre, R.; Jones, A.; Rowland, J. J.; Kell, D. B. Genetic Algorithms as a Method for Variable Selection in Multiple Linear Regression and Partial Least Squares Regression, with Applications to Pyrolysis Mass Spectrometry. Analytica Chimica Acta 1997, 348, 71–86.