
ABSTRACT
In this study, the taste contribution of brown sugar in chicken seasoning was evaluated. Chicken seasonings containing brown sugar (AB), white sugar (AW), and liquid sugar (AL) were compared by the detection of taste compounds, sensory evaluation, and electronic tongue measurements. The correlation model of the three kinds of data was built by partial least squares regression (PLSR). The contents of the taste compounds in sample AB was higher than in sample AW and lower than in sample AL. Sample AB had the strongest “umami” and “full-body” taste and the highest response values for the UMS and GPS sensors. Combined with the PLSR results, brown sugar could be used to balance the taste of chicken seasoning. In conclusion, brown sugar had a positive effect on flavor quality and could help to improve chicken seasoning recipes.
Introduction
Sugars constitute a vital category of ingredients in the food industry and can be used as flavor enhancers.[Citation1] They play an important role in improving the sweetness and textural characteristics (e.g. Korean rice cake).[Citation2] They can also balance the spicy and salty tastes.[Citation3] Brown sugar, a sucrose sugar product with a distinctive brown color, is widely produced in many countries and regions, such as South America, South Asia, and Africa.[Citation4] It has a considerable place in the market.[Citation3] Its brown color is due to the presence of molasses. Molasses consists of sucrose, glucose, amino acids, vitamins, metal ions, and other components.[Citation5] Therefore, brown sugar contains some beneficial biofunctions, such as antioxidant, cytoprotective, and antiangiogenesis activities.[Citation4] In modern recipes, brown sugar is often used to create a richer flavor, such as in baked foods.[Citation6] Asikin et al.[Citation6] found many acids and heterocyclic compounds in brown sugar, which can provide sweet, burnt, pungent, and caramel-like aromas.
Chicken seasoning, which is a type of food condiment, is widely used in daily life because of its pleasant flavor. The market for chicken seasoning in China developed rapidly, with an annual increase of 20% to 35% from 2009 to 2012.[Citation7] Flavor is an important quality index of chicken seasoning. The flavor quality of chicken seasoning can be affected by its ingredients or processing technique, among other factors. As major constituents of chicken seasoning, sugars can affect the flavor quality. Refined white sugar is the most widely used sugar. However, limited information is available on the effect of brown sugar on the taste characteristics of chicken seasoning.
Sensory evaluation is often used to determine the flavor quality of food.[Citation8] For example, Feng et al.[Citation9] used sensory evaluation to study the quality of chicken breast muscle during the refrigerated storage. Sensory evaluation can provide integrated and direct information of the target attributes. It was used to describe the sensory properties of oyster sauce[Citation10], and evaluate the effects of sodium reduction and potassium chloride addition on chicken broth.[Citation11] To get more specific information, sensory evaluation is usually combined with instrumental analysis, such as high-performance liquid chromatography (HPLC) and an electronic tongue to evaluate the flavor quality of food. The HPLC method, which shows good repeatability and credibility, is widely used in food analysis. This method has been used to analyze the content of sugars, such as glucose, fructose, and sucrose.[Citation12] It has also been used to determine the taste compounds in seasoning[Citation13,Citation14] and chicken products.[Citation15,Citation16] The electronic tongue, which can simulate the human sense of taste, is a good tool for distinguishing the differences between samples.[Citation17] It has been used to discriminate the brands and categories of soy sauce[Citation18], compare the different recipes of flavor enhancers[Citation19], and optimize sweetener blends.[Citation20] Takahashi et al.[Citation21] used the taste sensor method to detect the sweetness, umami, saltiness, astringency, and mineral-based bitterness of brown sugar sourced from different parts of the sugarcane. The samples had similar taste profiles, except for subtle differences in saltiness and sweetness. To understand the relationship between the data obtained by different analysis methods, partial least squares regression (PLSR) was used to establish correlation models and a relationship between the electronic tongue data, physicochemical changes[Citation22], and sensory evaluation data.[Citation23] PLSR was also used to predict the physical properties of yogurt based on the response value of the electronic tongue sensor.[Citation24]
The current study evaluated the taste contribution of the brown sugar in chicken seasoning. Taste compounds analysis, sensory evaluation, and electronic tongue were used to compare the differences in flavor quality between the chicken seasoning with brown sugar (AB), white sugar (AW) and liquid sugar (AL). A PLSR model was used to study the correlation between the content of taste compounds, sensory attributes, and electronic tongue response data to further analyze the influence of brown sugar on chicken seasoning.
Materials and methods
Samples and reagents
Three chicken seasoning samples were used in the study. The major constituents of which were chicken meat, sodium glutamate (MSG), inosinic acid and guanylic acid (I + G), sodium chloride, and sugars. Their recipes were identical except for the type of sugar. The chicken seasoning was supplemented with white sugar, brown sugar, or liquid sugar with a content of 13.38%. The liquid sugar was a sweetener obtained from a caramelization reaction. All chicken seasoning samples were provided by the Nestlé R&D Center (Nestlé R&D Center Shanghai Ltd, Shanghai, China). The compositions of the white sugar, brown sugar, and liquid sugar added to the chicken seasoning are shown in . The sugars were analyzed by the Nestlé R&D Center using HPLC.
Table 1. Compositions of brown sugar, white sugar and liquid sugar added to the chicken seasoning, which were analyzed by Nestlé R&D Center using HPLC (g·kg−1).
Standard sugars (sucrose, fructose, and glucose), HPLC-grade acetonitrile and sodium hydroxide, hydrochloric acid, and analytical grade formaldehyde were obtained from Sinopharm Chemical Reagent Co., Ltd (Shanghai, China). The analytical-grade silver nitrate and potassium chromate were obtained from Shanghai Titan Science Co., Ltd (Shanghai, China).
Determination of the taste compounds
Saccharide content
The chicken seasoning samples were dissolved in distilled water to a mass concentration of 20%. All samples and standards were passed through 0.45 μm filters before sampling. An HPLC coupled to a refractive index detector (Agilent 1260, Palo Alto, CA, USA) was used to analyze the glucose, fructose, and sucrose content. The column was a 5 μm, 250 mm x 4.6 mm NH2 column (Agela Innoval, Tianjin, China). The mobile phase was acetonitrile and water (75:25). Isocratic elution was performed with a flow rate of 1.0 mL/min. The column temperature was 35°C. The injection volume was 10 μL. Each sample was run in triplicate. The chromatographic peaks were identified by using the retention times of the reference standards. The standard curves of sucrose, fructose, and glucose were used for quantification.
MSG, I + G and chloride content
The method used to determine MSG was in accordance with the National Standard of China GB/T 5009.39–2003. Chicken seasoning samples (3 g) were dissolved in 100 mL of distilled water. An aliquot of (10 mL) the solution was added to a 200 mL beaker containing 60 mL of distilled water. The pH of the solution was adjusted to 8.2 using 0.05 mol/L sodium hydroxide. Subsequently, 10 mL of formaldehyde were added to the solution, and 0.05 mol/L sodium hydroxide was used to titrate the pH to 9.6. Each milliliter of the 0.05 mol/L sodium hydroxide consumed after the formaldehyde addition was equivalent to 187 mg MSG.
The methods used to determine I + G and chloride content were in accordance with the National Standard of China GB/T 8967–2007. The I + G content was analyzed using an ultraviolet spectrophotometer (UV 6000, Shanghai Metash Instruments Co., Ltd, Shanghai, China). Chicken seasoning samples (3 g) were dissolved in 100 mL of 0.1 mol/L hydrochloric acid. The absorbance of the samples was determined at a wavelength of 250 nm.
Potassium chromate was used as the indicator because silver chloride was less soluble than silver chromate and the color of silver chromate was reddish brown. Chicken seasoning samples (5 g) were dissolved in 100 mL of distilled water. Briefly, 1 mL of the sample solution was diluted with 100 mL of distilled water, and 0.5 mL of potassium chromate (5%, w/w) was added as an indicator. The mixture was titrated with 0.1 mol/L silver nitrate solution until it became orange and the color persisted for more than 60 s. A blank was titrated before the titration of each sample. Each milliliter of the 0.1 mol/L silver nitrate was equivalent to 58.45 mg chloride. Each sample was tested in triplicate for MSG, I + G, and chloride content.
Metal ion content
The metal ion content in the chicken seasoning samples was analyzed using an inductively coupled plasma atomic emission spectrometer (iCAP6300, Thermo, Waltham, MA, USA). The metal ions were potassium, iron, calcium, and magnesium. The method was based on Cindrić et al.[Citation25] Each sample was run in triplicate.
Sensory evaluation
Twelve panelists (six females and six males, 20 to 30 years of age) who had the experience in food evaluation were selected and trained using the quantitative descriptive analysis method[Citation26] by an expert from the Nestlé R&D Center. Ten sensory attributes were developed in the training sessions to describe the chicken seasoning flavor: chicken, garlic, pepper, umami, MSG, sweet, salty, full-body, astringent, and retention. The umami attribute was used to show the natural umami taste, which differed from the MSG taste. The retention attribute was the flavor intensity to taste the chicken seasonings after 30 s.[Citation27] A structured, continuous 10-score scale was used to describe the sensory profile of the samples. The standard of the sensory score of the sensory attributes was as follows: 0 to 2, very weak; 3 to 4, weak; 5 to 6, neither weak nor strong; 7 to 8, strong; and 9 to 10, considerably strong.
When training was complete, the panelists were evaluated the chicken seasoning samples containing the different sugars. The experiment was conducted at room temperature (25°C) in the sensory evaluation laboratory. There were 12 cubicles with an 80 cm breadth in the laboratory. Four 25-watt color lights were located above each cubicle. To exclude the influence of color, only the red light was on when the experiment started.[Citation27] The chicken seasoning samples (10 g) were dissolved in 1000 mL of distilled water at 70°C to make them more palatable. Plastic cups (50 mL) were labeled with a random three-number code. The balanced-block design was used to evaluate the samples with the order of samples based on Stone et al.[Citation26] The panelists tasted and scored the samples. A 2 min break was needed between each sample. Unsalted soda crackers and distilled water were provided to cleanse the palate of the panelists.[Citation11] The experiment was conducted in triplicate.
Electronic tongue measurements
An α-Astree electronic tongue (Alpha MOS, Toulouse, France), which was equipped with one reference electrode and seven silicon-based potentiometric sensors as the working electrodes, was used for the taste evaluation of the sample solutions. The potentiometric sensors were labeled as SWS, STS, UMS, SRS, BRS, GPS and SPS.[Citation28] The potentiometric difference between working and reference electrodes was recorded as the E-tongue response. The electronic tongue sensor was preconditioned and calibrated using a 0.01 mol/L hydrochloric acid solution. The diagnostic started when the calibration passed. For the diagnostic, a 0.01 mol/L hydrochloric acid solution, MSG, and sodium chloride were used to judge the sensitivity and discernment of the electronic tongue sensors. The diagnostic passed if the principal component analysis (PCA) discrimination index was larger than 94. Chicken seasoning samples (1 g) were dissolved in 100 mL of distilled water. An aliquot of the solution (20 mL) was placed in the electronic tongue sample beaker. Nine replicate measurements were conducted for each sample, and four points after stabilization were used for further data processing. The sensors were rinsed with water to prevent cross-contamination.[Citation29] The signals of the seven potentiometric sensors were stable after the 100th second with a relative standard deviation response below 1%. The transient recording at the 120th second for the SRS, SWS, BRS, STS, UMS, GPS, and SPS sensors was used as the sensor response value.
Statistical analysis
The content of the taste compounds and sensory evaluation data were analyzed via analysis of variance (ANOVA) and Duncan’s multiple range tests using SPSS (version 19.0, IBM SPSS, Armonk, NY, USA). These data were used to identify the differences between the samples.[Citation30] For the response values of the electronic-tongue sensor, the data were analyzed by the multivariate statistical methods using the α-Astree software, which was provided by Alpha M.O.S. (version 12.0, Alpha M.O.S, Toulouse, France). Discriminant factor analysis (DFA) was used to analyze the electronic tongue response data. DFA is a technology used to combine the sensor data by re-differentiation.[Citation31] It can estimate the possibility of clustering the samples.[Citation32] The correlations between the taste compounds, electronic tongue, and the sensory evaluation were analyzed by PLSR using the Unscrambler (version 9.7 CAMO ASA, Oslo, Norway). PLS2, which can handle several responses simultaneously, was used[Citation33] to analyze the average data of taste compounds, electronic tongue, and sensory evaluation.
Results and discussion
Taste compounds analysis
The statistical results for the saccharide, MSG, I + G, chloride, and metal ion content are shown in .
Table 2. MSG, I + G, chloride and metal ion contents in the chicken seasoning samples with white sugar (AW), brown sugar (AB) and liquid sugar (AL).
Saccharides
Sugar has a significant influence on the flavor profile of food products.[Citation34] The fructose, glucose, and sucrose content in food were widely analyzed by HPLC.[Citation35] As shown in , the three samples had statistically significant differences (P < 0.05) in terms of sugar types and content. Sample AL had a lower sucrose content than sample AB. The sucrose content in sample AW was the highest. White sugar is a refined white product containing up to 99.9% sucrose. In contrast, brown sugar is a non-refined product from sugarcane.[Citation36] Sample AL contained 15.61 g.kg−1 glucose. Fructose was not detected in any of the samples.
MSG, I + G, and chloride
As shown in , the MSG, I + G, and chloride content were statistically significantly different (P < 0.05) between the three samples. There was 31% to 33% of MSG in the chicken seasoning samples, which conformed to the trade standard of China SB/T 10415–2007. MSG is a typical component that can provide the umami taste.[Citation37] It can also affect the astringent taste.[Citation23] The MSG content of sample AB was the highest. A low proportion of I + G (0.9% to 1.3%) can make the chicken seasoning more umami when it is combined with MSG.[Citation38,Citation39] The I + G content in sample AL was slightly higher than in sample AB. Almost 50% of all the samples is chloride, which is one of the major taste components of chicken seasonings. The significant differences between the samples might affect the salty taste differences. Sodium chloride is commonly used to offer a salty taste in chicken seasonings.
Metal ions
Metal ions, such as calcium (Ca2+), iron (Fe3+), and magnesium (Mg2+) have many nutritive values. Calcium can contribute to the development of bones and transmission of nerve impulses. Iron functions in hemoglobin for oxygen transport. Magnesium is an active component of several enzyme systems.[Citation40] These metal ions have salty, bitter, and astringent tastes that can affect the flavor.[Citation41] As shown in , there were significant differences in the metal ions across the samples (p < 0.05). Samples AB and AL had higher metal ion content than sample AW. Thus, samples AB and AL had more nutrients. These two samples might have a richer mouthfeel.
Sensory evaluation
The ANOVA results for the 10 sensory attributes of samples AW, AB, and AL are shown in . There was no significant difference between the samples for the sensory attributes “chicken”, “garlic”, “pepper”, “MSG”, and “retention”. Sample AL had the weakest “umami” and “full-body” tastes and the strongest “astringent” and “salty” tastes. Combined with the taste compounds results, sample AL had the highest chloride and metal ion content. In general, higher concentrations of Ca2+ and Mg2+ can cause a bitter and astringent taste for sample AL. Sample AW had a weak “umami” taste. Compared with samples AL and AW, sample AB had the strongest “umami” and “full-body” tastes and the weakest “astringent” taste. The results showed that sample AB had a more harmonious taste and a more natural and stronger umami taste.
Table 3. ANOVA (Average± Standard Deviation) results of the chicken seasoning samples supplemented with white sugar (AW), brown sugar (AB) and liquid sugar (AL) for ten sensory attributes.
Electronic tongue analysis
Response of the sensor SWS to the taste sensation of sweet
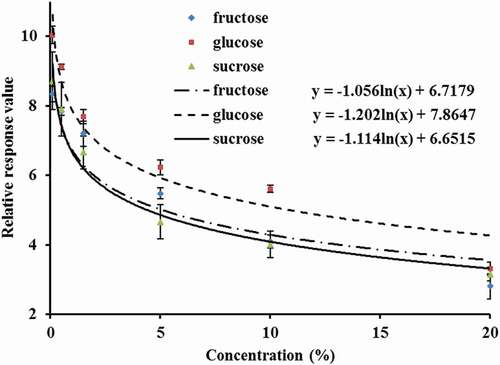
To evaluate the response of the sweet sensor SWS to the taste sensation of sweet, different concentrations of glucose, fructose, and sucrose were analyzed using the electronic tongue. The mass concentrations of the glucose, fructose, and sucrose solutions were 0.1%, 0.5%, 1.5%, 5%, 10%, and 20%.
As shown in , the glucose, fructose, and sucrose concentrations and their electronic tongue response values for SWS had a logarithmic decreasing equation relationship in the range of 0.1% to 20%. This result indicated a negative correlation between the response value and the concentration of the three types of saccharides, which was consistent with a previous study.[Citation42] The correlation coefficients (R2) of the fitted curves were 0.8998, 0.9381, and 0.9700 for fructose, glucose, and sucrose, respectively. The three logarithmic functions were well fitted. Therefore, the sweet sensor SWS could sense the difference between the glucose, fructose, and sucrose solutions of different concentration gradients.
Figure 1. Relationship of the relative response value of the electronic tongue and the fructose, glucose, and sucrose concentrations.
Electronic tongue comparison results for the AW, AB, and AL samples
A radar map, which can show the relative intensity of different tastes of the samples[Citation43], was drawn according to the relative response value of the electronic tongue sensors to show the differences between the three chicken seasoning samples. As shown in , the radar maps of the three samples were different. The response values of sensors UMS and GPS for sample AB were higher than those for the other two samples. The response values of sensors STS, BRS, SRS, and SPS of were the highest for sample AL. Sample AW had the lowest response value for sensor SWS. The negative correlation between the response value and the sucrose concentration in indicated that sample AW had the highest sucrose content, which is consistent with the taste compounds results. Takahashi et al.[Citation21] used the radar map to compare the taste characteristics of two types of brown sugars, which showed the subtle differences between the samples.
Figure 2. Electronic tongue radar map of the chicken seasoning samples with white sugar (AW), brown sugar (AB), and liquid sugar (AL).
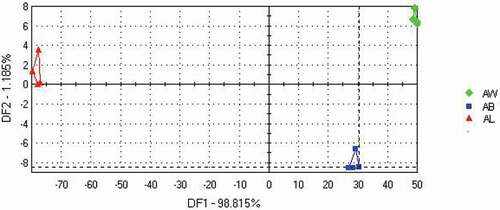
DFA was used to further analyze the electronic tongue response data of the chicken seasoning samples. As shown in , the three samples could be discriminated based on the DFA method. A 98.815% data variance value was captured by the X function, and a 1.185% data variance value was captured by the Y function. Sample AB was clearly separated from samples AW and AL, perhaps because sample AB had the strongest “umami” and “full-body” tastes and that sample AL had the strongest “salty” and “astringent” tastes. Hence, chicken seasoning samples supplemented with different sugars can be classified based on their taste profiles.
Figure 3. DFA results of the chicken seasoning samples with white sugar (AW), brown sugar (AB), and liquid sugar (AL) according to the electronic tongue data.
Correlation between the taste compounds, electronic tongue, and the sensory evaluation
A PLSR2 model was used to determine the correlation between the taste compounds, electronic tongue, and the sensory evaluation (). The X-axis represents the sensory evaluation data, and the Y-axis shows the electronic-tongue response data and taste compound content. The first two PCs (principal components) derived a PLSR2 model that explained 42% of the cross-validated variance. The taste compounds, sensory attributes, and electronic tongue sensors, except for the Ca2+, potassium ion (K+), BRS, “full-body”, “garlic”, and “retention” attributes, were located between the inner (R2 = 0.5) and outer ellipses (R2 = 1.0). Thus, they were well explained by the PLSR2 model. The Fe3+, Mg2+, and I + G content were correlated with the “astringent” and “salty” attributes, which was consistent with the results of the taste compounds and sensory evaluation. Sample AL had the highest Fe3+, Mg2+, and I + G content and the strongest “astringent” and “salty” taste. The “sweet” attribute showed a correlation with the sucrose and MSG content. Sample AW had a higher sucrose content and a stronger “sweet” taste than the other two samples.
Figure 4. Correlation loading plot of the PLSR2 analysis for the taste compounds, electronic tongue, and the sensory evaluation of chicken seasonings.
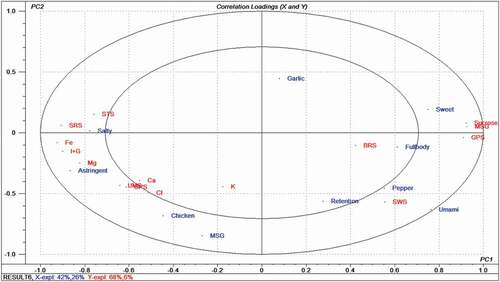
The response value of sensor STS was positively associated with the “salty” attribute, and the response values of sensors SWS and GPS were correlated with the “sweet”, “pepper”, and “umami” attributes. Sample AL had the highest response value for the sensor STS and a higher “salty” taste than the other two samples, perhaps indicating a correlation between the salty sense of the STS electronic-tongue sensor and the natural sense. Sample AW had a lower SWS response value than the other two samples. However, the “sweet” taste of sample AW was the strongest, perhaps due to the negative correlation between the SWS response value and saccharide concentration presented in .
The influence of sugar on flavor intensity is complex and nonlinear.[Citation4] Moreover, different types of sugar will add their own flavor and function to the product. Especially when a kind of sugar is added to “not-sweet” products, such as seasonings, it can balance the flavor and improve the mouthfeel.[Citation34] In this study, chicken seasonings with different types of sugar were evaluated, and the effects of brown sugar on the taste of the samples were observed. For example, a correlation was built between the Fe3+, Mg2+, and I + G content and the “astringent” and “salty” attributes was established. Sample AB had a higher content of these compounds than sample AW and a lower content than sample AL. The appropriate content of these taste compounds in sample AB demonstrated that the brown sugar balanced the astringent and salty taste of the chicken seasoning. For the correlation between sensory attributes and electronic tongue response data, the response values of the sensors SWS and GPS were correlated with the “sweet”, “pepper”, and “umami” attributes, and the response value of sensor STS was positively associated with the “salty” attribute. The differences between the electronic tongue profiles of the three samples showed that brown sugar could affect the attributes “sweet”, “salty”, “pepper”, and “umami” tastes of chicken seasonings. Sample AB had the highest response value for the GPS sensor and the strongest “umami” taste. Some clues could also be found in the composition of brown sugar (). The brown sugar had the highest content of aspartic acid and glutamic acid, and both of these amino acids have an umami taste.[Citation44] Based on these results, different types of sugar can influence the flavor profile of chicken seasoning. The sample with brown sugar had a more harmonious taste and had a richer mouthfeel. Thus, brown sugar can be used in a chicken seasoning recipe to improve its flavor and make it taste better.
Conclusion
The taste compounds, sensory evaluation and electronic tongue were used to study the effect of brown sugar on the taste of chicken seasoning. Sample AB has appropriate content of taste compounds and the strongest “umami” taste attributes. It had a significantly different electronic tongue profile than samples AW and AL. Brown sugar has a good effect on the taste characteristics of chicken seasoning and can be used to improve the chicken seasoning recipes.
Additional information
Funding
Related Research Data
References
- Galant, A. L.; Kaufman, R. C.; Wilson, J. D. Glucose: Detection and Analysis. Food Chemistry 2015, 188, 149–160. DOI: 10.1016/j.foodchem.2015.04.071.
- Cho, S.; Yoon, S. H.; Min, J.; Lee, S.; Tokar, T.; Lee, S. O.; Seo, H. S. Sensory Characteristics of Seolgitteok (Korean Rice Cake) in Relation to the Added Levels of Brown Rice Flour and Sugar. Journal of Sensory Studies 2014, 29, 371–383. DOI: 10.1111/joss.12118.
- Clemens, R. A.; Jones, J. M.; Kern, M.; Lee, S. Y.; Mayhew, E. J.; Slavin, J. L.; Zivanovic, S. Functionality of Sugars in Foods and Health. Comprehensive Reviews in Food Science and Food Safety 2016, 15, 433–470. DOI: 10.1111/1541-4337.12194.
- Asikin, Y.; Hirose, N.; Tamaki, H.; Ito, S.; Oku, H.; Wada, K. Effects of Different Drying–Solidification Processes on Physical Properties, Volatile Fraction, and Antioxidant Activity of Non-Centrifugal Cane Brown Sugar. LWT-Food Science and Technology 2016, 66, 340–347. DOI: 10.1016/j.lwt.2015.10.039.
- Ducat, G.; Felsner, M. L.; Da Costa Neto, P. R.; Quináia, S. P. Development and in House Validation of a New Thermogravimetric Method for Water Content Analysis in Soft Brown Sugar. Food Chemistry 2015, 177, 158–164. DOI: 10.1016/j.foodchem.2015.01.030.
- Asikin, Y.; Kamiya, A.; Mizu, M.; Takara, K.; Tamaki, H.; Wada, K. Changes in the Physicochemical Characteristics, Including Flavour Components and Maillard Reaction Products of Non-Centrifugal Cane Brown Sugar during Storage. Food Chemistry 2014, 149, 170–177. DOI: 10.1016/j.foodchem.2013.10.089.
- Ruidi Flavoring Industry Co. Ltd, Anshun Economic Technical Development Area, Guizhou, China. The Industry Present Situation and Market Analysis of the Chicken Seasoning. http://www.zgrdwy.com/trends/2015/1031/15.html. [26 December 2016].
- Arana, I.; Ibañez, F. C.; Torre, P. Monitoring the Sensory Quality of Canned White Asparagus through Cluster Analysis. Journal of the Science of Food and Agriculture 2015, 96, 2391–2399. DOI: 10.1002/jsfa.7355.
- Feng, L. F.; Shi, C. W.; Bei, Z. Y.; Li, Y. Y.; Yuan, D. X.; Gong, Y. C.; Han, J. Z. Rosemary Extract in Combination with Ɛ-Polylysine Enhance the Quality of Chicken Breast Muscle during Refrigerated Storage. International Journal of Food Properties 2016, 19, 2338–2348. DOI: 10.1080/10942912.2015.1130053.
- Nguyen, T. H. D.; Wang, X. C. Volatile, Taste Components, and Sensory Characteristics of Commercial Brand Oyster Sauces: Comparisons and Relationships. International Journal of Food Properties 2012, 15, 518–535. DOI: 10.1080/10942912.2010.492542.
- Hooge, S.; Chambers, D. A Comparison of Basic Taste Modalities, Using A Descriptive Analysis Technique, for Varying Levels of Sodium and KCl in Two Model Soup Systems. Journal of Sensory Studies 2010, 25, 521–535.
- Liu, Y. D.; Ying, Y. B.; Yu, H. Y.; Fu, X. P. Comparison of the HPLC Method and FT-NIR Analysis for Quantification of Glucose, Fructose, and Sucrose in Intact Apple Fruits. Journal of Agricultural and Food Chemistry 2006, 54, 2810–2815. DOI: 10.1021/jf052889e.
- Vallverdú-Queralt, A.; Martínez-Huélamo, M.; Arranz-Martinez, S.; Miralles, E.; Lamuela-Raventós, R. M. Differences in the Carotenoid Content of Ketchups and Gazpachos through HPLC/ESI(Li+)-MS/MS Correlated with Their Antioxidant Capacity. Journal of the Science of Food and Agriculture 2012, 92, 2043–2049. DOI: 10.1002/jsfa.v92.10.
- Qi, W.; Guo, H. L.; Wang, C. L.; Hou, L. H.; Cao, X. H.; Liu, J. F.; Lu, F. P. Comparative Study on Fermentation Performance in the Genome Shuffled Candida Versatilis, and Wil-Type Salt Tolerant Yeast Strain. Journal of the Science of Food and Agriculture 2016, 97, 284–290. DOI: 10.1002/jsfa.7728.
- Timofeeva, I.; Timofeev, S.; Moskvin, L.; Bulatov, A. A Dispersive Liquid-Liquid Microextraction Using A Switchable Polarity Dispersive Solvent. Automated HPLC-FLD Determination of Ofloxacin in Chicken Meat. Analytica Chimica Acta 2017, 949, 35–42. DOI: 10.1016/j.aca.2016.11.018.
- Mariutti, L. R. B.; Nogueira, G. C.; Bragagnolo, N. Optimization and Validation of Analytical Conditions for Cholesterol and Cholesterol Oxides Extraction in Chicken Meat Using Response Surface Methodology. Journal of Agricultural and Food Chemistry 2008, 56, 2913–2918. DOI: 10.1021/jf0735432.
- Ha, D.; Sun, Q. Y.; Su, K. Q.; Wan, H.; Li, H. B.; Xu, N.; Sun, F.; Zhuang, L. J.; Hu, N.; Wang, P. Recent Achievements in Electronic Tongue and Bioelectronic Tongue as Taste Sensors. Sensors and Actuators B- Chemical 2015, 207, 1136–1146. DOI: 10.1016/j.snb.2014.09.077.
- Ou-Yang, Q.; Zhao, J. W.; Chen, Q. S.; Lin, H.; Huang, X. Y. Study on Classification of Soy Sauce by Electronic Tongue Technique Combined with Artificial Neural Network. Journal of Food Science 2011, 76, S523–S527. DOI: 10.1111/j.1750-3841.2011.02382.x.
- Yang, Y.; Chen, Q. Q.; Shen, C.; Zhang, S. M.; Gan, Z. L.; Hu, R.; Zhao, J. H.; Ni, Y. Y. Evaluation of Monosodium Glutamate, Disodium Inosinate and Guanylate Umami Taste by an Electronic Tongue. Journal of Food Engineering 2013, 116, 627–632. DOI: 10.1016/j.jfoodeng.2012.12.042.
- Waldrop, M. E.; Ross, C. F. Sweetener Blend Optimization by Using Mixture Design Methodology and the Electronic Tongue. Journal of Food Science 2014, 79, S1782–S1794. DOI: 10.1111/jfds.2014.79.issue-9.
- Takahashi, M.; Ishmael, M.; Asikin, Y.; Hirose, N.; Mizu, M.; Shikanai, T.; Tamaki, H.; Wada, K. Composition, Taste, Aroma, and Antioxidant Activity of Solidified Noncentrifugal Brown Sugars Prepared from Whole Stalk and Separated Pith of Sugarcane (Saccharum Officinarum L.). Journal of Food Science 2016, 81, C2647–C2655. DOI: 10.1111/jfds.2016.81.issue-11.
- Gil, L.; Barat, J. M.; Baigts, D.; Martínez-Máñez, R.; Soto, J.; Garcia-Breijo, E.; Aristoy, M. C.; Toldrá, F.; Llobet, E. Monitoring of Physical-Chemical and Microbiological Changes in Fresh Pork Meat under Cold Storage by Means of a Potentiometric Electronic Tongue. Food Chemistry 2011, 126, 1261–1268. DOI: 10.1016/j.foodchem.2010.11.054.
- Jo, M. N.; Lee, Y. M. Analyzing the Sensory Characteristics and Taste-Sensor Ions of MSG Substitutes. Journal of Food Science 2008, 73, S191–S198. DOI: 10.1111/j.1750-3841.2008.00769.x.
- Wei, Z. B.; Wang, J.; Jin, W. F. Evaluation of Varieties of Set Yogurts and Their Physical Properties Using a Voltammetric Electronic Tongue Based on Various Potential Waveforms. Sensors and Actuators B- Chemical 2013, 177, 684–694. DOI: 10.1016/j.snb.2012.11.056.
- Cindrić, I. J.; Krizman, I.; Zeiner, M.; Kampić, Š.; Medunić, G.; Stingeder, G. ICP-AES Determination of Minor- and Major Elements in Apples after Microwave Assisted Digestion. Food Chemistry 2012, 135, 2675–2680. DOI: 10.1016/j.foodchem.2012.07.051.
- Stone, H.; Sidel, J. L. Sensory Evaluation Practices. Elsevier/Academic. Press: San Diego, California. America 2012, 157-159, 233–237.
- Tian, H. X.; Li, F. H.; Qin, L.; Yu, H. Y.; Ma, X. Discrimination of Chicken Seasonings and Beef Seasonings Using Electronic Nose and Sensory Evaluation. Journal of Food Science 2014, 79, S2346–S2353. DOI: 10.1111/1750-3841.12675.
- Pein, M.; Eckert, C.; Preis, M.; Breitkreutz, J. New Protocol for αAstree Electronic Tongue Enabling Full Performance Qualification according to ICH Q2. Journal of Pharmaceutical and Biomedical Analysis 2013, 83, 157–163. DOI: 10.1016/j.jpba.2013.05.005.
- Ito, M.; Ikehama, K.; Yoshida, K.; Haraguchi, T.; Yoshida, M.; Wada, K.; Uchida, T. Bitterness Prediction of H1-Antihistamines and Prediction of Masking Effects of Artificial Sweeteners Using an Electronic Tongue. International Journal of Pharmaceutics 2013, 441, 121–127. DOI: 10.1016/j.ijpharm.2012.11.047.
- Spínola, V.; Mendes, B.; Câmara, J. S.; Castilho, P. C. Effect of Time and Temperature on Vitamin C Stability in Horticultural Extracts. UHPLC-PDA Vs Iodometric Titration as Analytical Methods. LWT-Food Science and Technology 2013, 50, 489–495. DOI: 10.1016/j.lwt.2012.08.020.
- Wang, Y. J.; Feng, Y.; Wu, Y.; Liang, S.; Xu, D. S. Sensory Evaluation of the Taste of Berberine Hydrochloride Using an Electronic Tongue. Fitoterapia 2013, 86, 137–143. DOI: 10.1016/j.fitote.2013.02.010.
- Feng, T.; Bing, F. L.; Yang, Y.; Zhuang, H. N.; Ye, R.; Li, X. B.; Xu, Z. M.; Wang, K. Discrimination of Edible Fungi Varieties and Evaluation of Their Umami Intensities by Using an Electronic Tongue Method. International Journal of Food Science and Technology 2016, 51, 1393–1400. DOI: 10.1111/ijfs.13096.
- Song, S. Q.; Yuan, L.; Zhang, X. M.; Hayat, K.; Chen, H. N.; Liu, F.; Xiao, Z. B.; Niu, Y. W. Rapid Measuring and Modelling Flavour Quality Changes of Oxidised Chicken Fat by Electronic Nose Profiles through the Partial Least Squares Regression Analysis. Food Chemistry 2013, 141, 4278–4288. DOI: 10.1016/j.foodchem.2013.07.009.
- Goldfein, K. R.; Slavin, J. L. Why Sugar Is Added to Food: Food Science 101. Comprehensive Reviews in Food Science and Food Safety 2015, 14, 644–656. DOI: 10.1111/1541-4337.12151.
- Choi, S. H.; Kozukue, N.; Kim, H. J.; Friedman, M. Analysis of Protein Amino Acids, Non-Protein Amino Acids and Metabolites, Dietary Protein, Glucose, Fructose, Sucrose, Phenolic, and Flavonoid Content and Antioxidative Properties of Potato Tubers, Peels, and Cortexes (Pulps). Journal of Food Composition and Analysis 2016, 50, 77–87. DOI: 10.1016/j.jfca.2016.05.011.
- Seguí, L.; Calabuig-Jiménez, L.; Betoret, N.; Fito, P. Physicochemical and Antioxidant Properties of Non-Refined Sugarcane Alternatives to White Sugar. International Journal of Food Science and Technology 2015, 50, 2579–2588. DOI: 10.1111/ijfs.12926.
- Phat, C.; Moon, B.; Lee, C. Evaluation of Umami Taste in Mushroom Extracts by Chemical Analysis, Sensory Evaluation, and an Electronic Tongue System. Food Chemistry 2016, 192, 1068–1077. DOI: 10.1016/j.foodchem.2015.07.113.
- Zhang, Y.; Venkitasamy, C.; Pan, Z. L.; Liu, W. L.; Zhao, L. M. Novel Umami Ingredients: Umami Peptides and Their Taste. Journal of Food Science 2017, 82, 16–23. DOI: 10.1111/jfds.2017.82.issue-1.
- Myrdal, M. A.; Mills, K.; Wong, T.; Drescher, G.; Lee, S. M.; Sirimuangmoon, C.; Schaefer, S.; Langstaff, S.; Minor, B.; Guinard, J. X. Flavor-Enhancing Properties of Mushrooms in Meat-Based Dishes in Which Sodium Has Been Reduced and Meat Has Been Partially Substituted with Mushrooms. Journal of Food Science 2014, 79, S1795–S1804. DOI: 10.1111/1750-3841.12549.
- Maru, M.; Birhanu, T.; Tessema, D. A. Calcium, Magnesium, Iron, Zinc and Copper, Compositions of Human Milk from Populations with Cereal and ‘Enset’ Based Diets. Ethiopian Journal of Health Science 2013, 23, 90–97.
- Marcussen, H.; Holm, P. E.; Hansen, H. C. B. Composition, Flavor, Chemical Foodsafety, and Consumer Preferences of Bottled Water. Comprehensive Reviews in Food Science and Food Safety 2013, 12, 333–352. DOI: 10.1111/1541-4337.12015.
- Tian, H. X.; Feng, T.; Xiao, Z. B.; Song, S. Q.; Li, Z. Y.; Liu, Q.; Mao, D. S.; Li, F. H. Comparison of Intensities and Binary Interactions of Four Basic Tastes between an Electronic Tongue and a Human Tongue. Food Science and Biotechnology 2015, 24, 1711–1715. DOI: 10.1007/s10068-015-0222-9.
- Zeng, X. F.; Bai, W. D.; Zhu, X. W.; Dong, H. Browning Intensity and Taste Change Analysis of Chicken Protein-Sugar Maillard Reaction System with Antioxidants and Different Drying Processes. J. Food Process. Preservation 2016. DOI: 10.1111/jfpp.13117.
- Zhuang, K. J.; Wu, N.; Wang, X. C.; Wu, X. G.; Wang, S.; Long, X. W.; Wei, X. Effects of 3 Feeding Modes on the Volatile and Nonvolatile Compounds in the Edible Tissues of Female Chinese Mitten Crab (Eriocheir Sinensis). Journal of Food Science 2016, 81, S968–S981. DOI: 10.1111/1750-3841.13229.