
 ?Mathematical formulae have been encoded as MathML and are displayed in this HTML version using MathJax in order to improve their display. Uncheck the box to turn MathJax off. This feature requires Javascript. Click on a formula to zoom.
ABSTRACT
Palm stearin (PS) is an extensively used trans-free hardstock. Depending on process parameters, fractions with unique compositions, hardness, and solid fat content can be tailored toward specific applications. In this work, the composition and crystallization of PS fractionated with acetone at 30°C, 35°C, or 40°C into various liquid (LF) and solid (SF) fractions were investigated. After fractionation, iodine value (IV) of PS changed from 37 to values ranging from 24 to 51. The IV of the LF increased with a decrease in fractionation temperature whereas that of the SF (~24) was unaffected. The main fatty acids of all PS fractions were palmitic and oleic acids, with the LF having a lower palmitic acid but higher oleic acid content than the SF. LF and SF obtained at higher fractionation temperatures showed more rapid crystallization rates. Under the microscope, the LF fractionated at 30°C and 35°C consisted of spherulites whereas those fractionated at 40°C exhibited dendritic crystals. All SF consisted of spherulites comprised of large rod-like crystals. All samples existed as mixtures of β’ and β crystals. This study serves as the basis for the development of baking margarines and pastry shortenings using fractionated PS.
Introduction
Palm oil (PO) is a commonly used hardstock in margarines and shortenings because it imparts desirable plasticity, body, and mouthfeel.[Citation1,Citation2] As with all natural fats, it contains a mixture of higher- and lower-melting triacylglycerols (TAG). Fractionation is a process that can separate fats into different fractions based on differences in the solubility of higher-melting TAG in the liquid phase.[Citation3] It is the dominant modification process used for PO.[Citation4] Dry fractionation is the simplest fractionation process. It is environmental-friendly and cost-effective, however, its crystallization operates in the bulk resulting in limitation of the degree of fat crystallization because of viscosity problems. Given its process efficiency, solvent fractionation is still used to produce specialty fats such as cocoa butter replacers. The main advantage of solvent fractionation is the great separation efficiency and the enhanced yield of the targeted phase compared to the other methods.[Citation5] It is possible to achieve separation efficiency of > 90% relatively easily compared to typically 60–70% for dry fractionation. This will give product (e.g., chocolate compound coating) with a much sharper melting point and a better functionality.[Citation6,Citation7] At ambient temperature, higher-melting PO TAG will crystallize into the SF (the stearin) whereas the lower melting TAG will remain in a liquid form (the olein).[Citation8,Citation9] In a typical palm stearin (PS) [iodine value (IV) of ~34 g I2/100 g], where IV is used to determine the amount of unsaturation in fats, the key TAG will be dipalmitoyloleoylglycerol (POP; ~27.5%), tripalmitoylglycerol (PPP; 26.5%), and dioleoylpalmitoylglycerol (POO; 12.9%).[Citation7] PS can be readily fractionated into harder PS (IV 17–21 g I2/100 g) and softer PS (IV 40–42 g I2/100 g).[Citation2] Various fractions of PS can be alternative materials for different food formulations, which can provide the required solid fat functionality.[Citation10]
The use of high-performance palm fractions is becoming increasingly important given the advent of a new generation of multi-component foods that may simultaneously co-exist as liquids, solids, and gels. As with all fats, however, an understanding of how TAG crystallization and polymorphism affect key attributes such as hardness, texture, rheology, and spreadability of lipid-based products is necessary.[Citation11] For example, β’ crystals, which are identified via powder X-ray diffraction based on key d-spacings of 3.8 and 4.2 Å, are desirable in margarines and shortenings. These small crystals, typically < 5 μm in length, contribute to a shiny surface, smooth mouthfeel, and spreadability in tablespreads. By contrast, β crystals, with their typical d-spacing at 3.7, 3.9, and 4.6 Å, are not desirable given their larger crystal size (up to 30 μm in length), which imparts a coarse, grainy texture.[Citation12,Citation13] Though the β’ polymorph is dominant in PO, super stearins with high-melting points can be β-tending, given the presence of trisaturated TAG such as PPP.[Citation14] In certain applications, β crystals are desirable as they confer flakiness, e.g., in pie crusts[Citation15,Citation16] and in cocoa butter equivalents.[Citation17] As an alternative to partial hydrogenation, PS can be added to interesterified fats to improve meltability and product stability to produce low-trans hard fats suitable for shortenings, stick or tub-type margarines, and confectionery fat products.[Citation18,Citation19]
The main objective of this work was to study the composition, physicochemical, and crystallization properties of PS fractions obtained from the single-stage solvent fractionation of PS at different crystallization temperatures to maximize the potential of different PS fractions for industrial applications such as bakery margarines and shortenings.
Materials and methods
Materials
Commercial refined, bleached, and deodorized PS was provided by Lamsoon PCL (Samutprakarn, Thailand) and used without further treatment. Its fatty acid and TAG compositions and physicochemical properties are given in –. Fatty acid methyl esters (FAME) as standards for gas chromatography (GC) were purchased from AccuStandard Inc. (USA). OOO and POP as standards for TAG analysis using high-performance liquid chromatography (HPLC) were purchased from Sigma Chemical Co. (St. Louis, MO, USA). Acetone and acetonitrile were of HPLC grade from Burdick and Jackson (Muskegon, MI, USA). All other chemicals were of analytical and HPLC grades.
Table 1. Fatty acid composition of palm stearin (PS) and its fractions.
Table 2. Triacylglycerol composition of palm stearin and its fractions.
Table 3. Iodine value (IV) and slip melting point (SMP) of PS and its fractions.
Fractionation of PS
A mass of 100 g of PS was melted at 80°C for 10 min and cooled to 50°C before being mixed with acetone (100 ml) and transferred to a temperature-controlled double jacket crystallizer. Fractionation was carried out at three crystallization temperatures (30°C, 35°C, or 40°C) for 1 h at 25 rpm to obtain various PS fractions with different compositions, physicochemical properties, and crystallization behavior from those of the original fat. After fractionation, samples were separated by vacuum filtration using a Whatman No.1 filter paper to obtain the liquid (LF) and solid (SF) fractions of PS. Acetone was removed from each fraction using a rotary vacuum evaporator with moderate heating. The remaining solvent was further removed using dry nitrogen gas flushing. All samples were kept at 4°C prior to analysis. The fractions obtained at fractionation temperatures of 30°C, 35°C, and 40°C were designated SF30, SF35, and SF40 (SFs with yields of 42%, 35%, and 19%) and LF30, LF35, and LF40 (LFs with yields of 58%, 65%, and 81%), respectively.
Solid fat content
Solid fat content (SFC) was determined using a pulsed nuclear magnetic resonance (p-NMR) spectrometer (Minispec-mq20, Bruker, Karlsruhe, Germany) using AOCS official method Cd 16–81.[Citation20] The equipment was calibrated with three SFC standards (0%, 31.4%, and 75.6%). Samples were pipetted into 10-mm-O.D. p-NMR tubes to a height of ~4 cm. Each sample was melted at 80°C for 15 min, then placed at 60°C for 10 min followed by 60 min at 0°C, and finally at 30 min at each measuring temperature prior to analysis. The SFC was measured at 5°C intervals from 10°C to 40°C.
Chemical characterization
For fatty acid profile analysis, the fat samples were converted to FAME according to AOAC official method 969.33.[Citation21] The FAME were analyzed by GC using a Shimadzu unit equipped with flame ionization detector and a VertiBondTM wax capillary column (L = 50 m long, ID = 0.25 mm and 0.20 μm film thickness). The injection and detector temperatures were 210°C and 280°C, respectively. The oven temperature program was: i) hold at 120°C for 3 min; ii) increase to 220°C at 10°C/min and hold 30 min, and iii) increase to 240°C and hold 30 min. Helium was used as the carrier gas with a flow rate of 1 ml/min. The injection volume was 1 μl with a split ratio of 100:1. FAME were identified by comparing their retention times with external standards, and the content of each fatty acid was calculated as a percentage of peak area.
The TAG profile was determined using Waters HPLC e2695 (Milford, MA, USA) with evaporative light scattering detector. The stationary phase was a pre-coated silica reversed phase C18 HPLC column [Purospher® Star RP-18e column (5 μm, 250 mm × 4 mm, Merck, Germany)]. A gradient mobile phase of acetone (A) and acetonitrile (B) was used to elute the sample at a flow rate of 1 ml/min with a total run time of 60 min. The gradient phase was as follows: 0–5 min (50% A + 50% B), 5–15 min (55% A + 45% B), 15–30 min (60% A + 40% B), 30–47 min (65% A + 35% B), and 47–60 min (50% A + 50% B). The column temperature was set at 35°C. For analysis, 0.5 g of sample was dissolved in 10 ml of acetone:chloroform (1:1) and 10 μl aliquots were injected for TAG analysis. The drift tube temperature, nebulizer power, and gas pressure of the ELS detector were set at 45°C, 60% (heating), and 35 psi, respectively. TAG peaks were identified based on the retention time of TAG standards and the results of Haryati et al.[Citation22] All TAG proportions are given in percentage area. The IV of PS and all fractions was analyzed using Wijs solution according to AOCS official method Cd 1–25.[Citation20] The slip melting point (SMP) was determined using AOCS official method Cc 3–25.[Citation20]
Isothermal crystallization
The SFC of PS and fractionated PS as a function of time during isothermal crystallization at 24°C and 29°C (PS and LF) and at 40°C (PS and SF) was determined using the p-NMR mentioned above. Samples were placed in 10 mm O.D. NMR tubes to a height of ~4 cm, melted at 80°C for 10 min in a water bath, and then transferred to a cooling bath set at the desired crystallization temperature. Samples cooled to 0.5°C above this temperature were removed from the cooling bath, rapidly wiped dry, and put into the p-NMR set at 24°C, 29°C, or 40°C. SFC values were captured every 60 s until reaching an SFC plateau (20 h for PS and LF at 24°C and 29°C, 4 h for PS and SF at 40°C). The SFC data vs. time were fitted using the Gompertz equation (Equation 1) to obtain the crystallization kinetic parameters[Citation23]:
whereis the percent SF crystallized at time t, A is the maximum percent of SF when t approaches infinity, μ is the maximum crystallization rate (%/min), and λ is a measure of the crystallization induction time (min). Estimation of the parameters was performed on the basis of experimental data by non-linear regression.
Crystal morphology
Samples were melted at 80°C for 10 min and then 15 μl of molten sample was deposited on a preheated glass slide and covered with a preheated coverslip. All LF samples were kept in a temperature-controlled cabinet at 24°C or 29°C for 20 h whereas the SFs were kept at 40°C for 4 h prior to observation. The holding times were chosen from the time where the crystallization of the samples already reached equilibrium at each crystallization temperature. PS was examined at all temperatures. Fat crystal morphology was observed with a light microscope in polarized mode (Axiovert 200M, Zeiss Inc., Toronto, ON, Canada) equipped with a CCD camera (QImaging, Inc., RETIGA 4000R, Surrey, BC, Canada) and QImaging Q-Capture Pro 7 software (v 7.0.5 Build 4325, QImaging, Inc., Surrey, BC, Canada). A magnification of 200× was used.
Thermal analysis
Crystallization and melting thermograms were analyzed by differential scanning calorimetry (DSC; PerkinElmer DSC 8000, PerkinElmer Co., Norwalk, CT, USA). The DSC was calibrated with indium (m.p. 156.6°C) as a reference standard. Samples (3–5 mg) were placed in an aluminum pan, with an empty sealed pan used as reference. Samples were heated from room temperature to 80°C at 30°C/min and held for 10 min followed by cooling to −60°C at 5°C/min to obtain the crystallization thermograms. After holding at −60°C for 30 min, samples were re-heated to 80°C at 5°C/min to obtain the melting thermograms.
Polymorphism
Temperature/time-dependent small and wide-angle X-ray diffraction (SAXD and WAXD) of the PS and fractions was investigated using a Hecus S3-MICRO high flux system (Hecus, Graz, Austria). The unit uses a 50 W, high brilliance GeniX microfocus source and customized FOX-3D multi-layer point focusing optics (Xenocs SA, Grenoble, France). The X-ray beam was generated by a 50 kV, 1 mA Cu Kα anode. Spectra were captured with dedicated Hecus 1-D position-sensitive detectors (model PSD-50M). X-ray ranges were 120 Å > d > 11 Å and 4.7 > d > 3.3 Å for the SAXD and WAXD regions. For sample preparation, ~20 µL of melted sample were placed in 1.5 mm O.D. quartz capillaries (Charles Supper Company, Inc., Natick, MA, USA) using a long needle and syringe. The sample was then transferred to the unit’s sample port and kept at 80°C for 10 min and then cooled from 80°C to 60°C at 5°C/min followed by cooling from 60°C to 10°C at 1°C/min. The temperature was held at 10°C for 1 h. Calibration was performed using silver behenate for the SAXD region and bromobenzoic acid and β-tripalmitin for the WAXD region.
Statistical analysis
All experiments were performed in triplicate, and the results were analyzed by analysis of variance with least significant difference at a 95% confidence interval (p < 0.05).
Results and discussion
Solid fat content
The SFC profiles of PS and all fractions as a function of temperature (10–40°C) are shown in . The three SF exhibited similar SFCs at all temperatures (p > 0.05), with values greater than PS (p < 0.05). At 10°C, they all showed SFCs of 85–90% which decreased to ~52% by 40°C, indicating lack of melting at body temperature (37°C), which is unsuitable for direct use as a margarine or confectionery hardstock. However, these SFs can be used as natural sources of solid fat to provide stability in various types of foods which require solid fat functionality.[Citation10]
Figure 1. Solid fat content vs. temperature profile of palm stearin (PS) and all fractions following fractionation at 30°C, 35°C, or 40°C (n = 3).
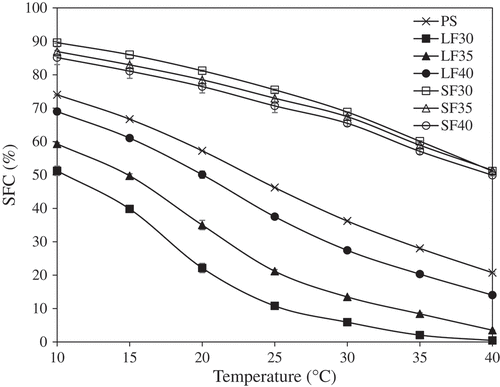
Amongst the LF samples, LF40 had the highest SFCs at 10–40°C followed by LF35 and LF30, respectively (p < 0.05). All LF samples had SFCs > 10% at 20°C, which is necessary to minimize oiling off in tablespreads and shortening products.[Citation24] These samples also exhibited relatively steep SFC curves between 15°C and 25°C, which would help to confer a desirable cooling effect in margarine.[Citation25] To prevent a waxy mouthfeel, a margarine fat should have SFC < 3.5% above 33°C.[Citation26] From , only LF30 showed this property. The SFC of LF35 at 37°C was ~4%; hence, this fraction may be blended with a lower melting fat for possible margarine and/or shortening applications. As LF40 had an SFC of ~17% at body temperature, it could potentially be mixed with a lower melting fat to manufacture heat-resistant confectionery products for distribution in countries with tropical climates.
Chemical characterization
The main fatty acids in PS were palmitic (~53%), oleic (~28%), and linoleic acids (~6%; ). These values were within the ranges of PS fatty acids in previous report.[Citation2] After fractionation, the palmitic acid content of the SF increased whereas oleic and linoleic acids decreased compared to PS (p < 0.05). Conversely, in the LFs, the content of palmitic acid decreased whereas that of oleic and linoleic acid increased compared to PS (p < 0.05). The increase in palmitic acid and the decrease in oleic and linoleic acids in all SFs with respect to the original fat were observed during dry fractionation of PO.[Citation9] As the fractionation temperature increased from 30°C to 40°C, the palmitic acid content of the SFs did not change but did increase from ~46 to ~53% in all LFs (p < 0.05). This coincided with a decrease in oleic acid from ~39% in LF30 to ~33% in LF40. The increase in palmitic acid with temperature in LF was also seen during PO dry fractionation.[Citation9] The proportion of all other fatty acids in both SF and LF was not greatly affected by fractionation temperature. Fatty acid composition of LF35 was similar to that of soft PS (IV = 47).[Citation2]
The main TAGs in PS were PPP (~51%), POP (~31%), and POO (~9%; ). These results differed from PS TAG compositions reported elsewhere,[Citation7,Citation27,Citation28] and this could be due to the difference in the fractionation conditions (temperature and duration) used. The content of many TAGs, namely POL, PLP, POO, POP, and PPP, greatly evolved upon fractionation. The content of POO and POP in LF30 and LF35 increased significantly vs. the original composition in PS (p < 0.05) but decreased substantially in LF40 and all SF (p < 0.05). POL, PLP, and OOO content was higher in LF30 vs. the original PS, but was lower in the other LFs and in all SFs. SOO content did not experience any change (p > 0.05) whereas POS content increased in all LFs but decreased in all SFs (p < 0.05). The PPP content increased significantly in all SFs vs. PS (p < 0.05) due to PPP’s high-melting point (45°C, 56°C, and 66°C for α, β′, and β forms, respectively).[Citation29], This led to the crystallization of PPP at all three temperatures during fractionation. The increase in trisaturated TAGs with long-chain fatty acids in SF from that of the original fat after fractionation has been observed in previous reports on PS[Citation5] and coconut fat.[Citation30,Citation31] In the LFs, PPP content decreased in LF30 and LF35 but increased in LF40 (p < 0.05). These observations on PPP content are important as it has been shown that trisaturated TAG content greatly influences SFC melting profile.[Citation32,Citation33] The fact that only certain fatty acids and TAG were affected by the fractionation temperature was likely due to differences in their melting point as well as TAG demixing behavior in the liquid and solid states. [Citation34]
The LFs showed IV values of ~42–50 g I2/100 g which was higher than in PS (~37 g I2/100 g) and the SFs (~24–25 g I2/100 g; ; p < 0.05). There occurred a decrease in the IV of the LFs as fractionation temperature increased (p < 0.05), indicating a decrease in the degree of unsaturation in the samples resulting from an increase in saturated fatty acid and TAG content ( and ). The SMP of PS (~51°C) decreased to 32°C, 38°C, and 44°C for LF30, LF35, and LF40 fractions (; p < 0.05). By contrast, the SMP of all SFs increased to ~56°C (p > 0.05). The decrease in IVs and the increase in SMPs of all SFs from those of PS were related to their higher palmitic acid and PPP contents.
Isothermal crystallization
The isothermal crystallization curves of PS and fractionated PS at 24°C, 29°C (for PS and LFs), and 40°C (for PS and SFs) and the associated Gompertz kinetic parameters are shown in and , respectively. PS started to crystallize during cooling prior to reaching the crystallization temperatures of 24°C and 29°C (), with initial SFCs of ~17% and ~8%, respectively. At these temperatures, the crystallization curves of PS were all situated above the LF curves due to its significantly higher content of saturated fatty acids (palmitic and stearic acids) than LFs (). At 40°C, PS exhibited a sigmoidal SFC curve ()), and because of its lower content of palmitic acid and higher content of unsaturated fatty acids (oleic and linoleic acids) than SFs (), the curve was located far below those of the SFs. Its crystallization induction time (λ) was long (~123 min), this being followed by a rapid crystallization rate (μ ~ 1.7%/min) before reaching an SFC plateau of 21% (). The sigmoidal curves indicated that no TAG crystallized until a sufficient number of stable nuclei were formed, followed by a period of rapid crystallization initiated by high-melting TAG such as PPP and PPS.[Citation35] The latter portion of the curve was characterized by a slower increase in SFC due to the crystallization of lower-melting TAG and perhaps polymorphic transitions. [Citation36]
Table 4. Kinetic parameters associated with the isothermal crystallization of PS and all fractions using the Gompertz equation.
Figure 2. Putative crystallization curves for PS and all fractions during isothermal crystallization at (a) 24°C, (b) 29°C, and (c) at 40°C.
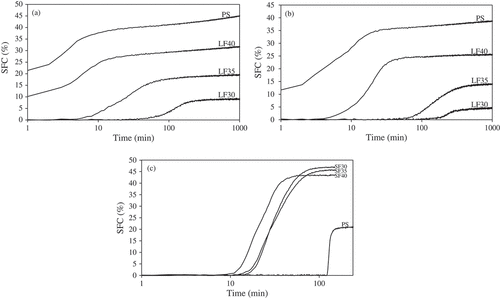
At 24°C, the LF40 started to solidify prior to reaching the crystallization temperature whereas LF35 and LF30 showed induction times of 3 and 53 min, respectively () and ). The A value was highest for LF40 followed by LF35 and LF30. The μ value was higher for LF35 than LF30, which was attributable to its higher trisaturated TAG content ().
At 29°C, LF40 started to crystallize first with the lowest λ and highest A values (~6 min and ~25%), followed by LF35 (~53 min and ~13%) and LF30 (~140 min and ~4%; ). The lowest λ and highest A values of LF40 were related to its highest content of saturated fatty acids and TAGs ( and ), which was confirmed by IV (). Compared with the crystallization temperature of 24°C, the LF30 and LF35 showed longer induction times and lower crystallization rates at 29°C probably due to the lower degree of supersaturation in the system at 29°C. At higher crystallization temperature (low supersaturation), stable nuclei with a larger radius were formed resulting in the extension of the lag period prior to detectable crystallization.[Citation36,Citation37]
All SF exhibited sigmoidal-shaped crystallization curves at 40°C ()). SF40 began to crystallize first and showed the lowest λ (~12 min) and A (44%) values followed by SF35 and SF30 (). The faster crystallization of SF40 than SF30 and SF35 was induced by its higher content of trisaturated TAGs (PPP and PPS; ). All SF displayed lower λ value and higher A value than PS. Similar to our results, Basso et al.[Citation32] reported that addition of PPP to PO significantly increased crystallization rate and final SFC while reducing induction time.
Microstructure
PS showed granular crystal at 24°C ( and 29°C ()) but aggregates consisting of small plate-like crystals at 40°C ()). The LF obtained at the different fractionation temperatures showed remarkably distinct crystal morphologies. At 24°C, LF30 showed spherulites which consisted of needle-like crystals radiating from central nuclei ()), similar to when a hard fat is added to PO.[Citation38] The average size of the crystals was 45 ± 7 μm. At 24°C, LF35 exhibited spherulitic crystalline assemblies with distinct dendritic crystalline cores ()). Chen et al.[Citation1] also observed spherulitic crystalline assemblies in PO during isothermal crystallization, where spherical crystals based on the α polymorph initially formed followed by needle-like β’ crystals growing from their surface. The average size of the LF35 crystals (48 ± 8 μm) was similar to that of the LF30 (p > 0.05) but with a higher crystal number density possibly due to its higher PPP content ().[Citation32,Citation39] LF40 showed a different crystal morphology than the other LFs at 24°C, with large, densely packed dendrites impinging upon one another ()).
Figure 3. Crystal morphology of PS and all fractions (LF: liquid fraction; SF: solid fraction) obtained after quiescent crystallization at 24°C (top row) and 29°C (middle row) for 20 h or at 40°C (bottom row) for 4 h. PS: (a), (e), (i); LF30: (b), (f); LF35: (c), (g); LF40: (d), (h); SF30 (j); SF35 (k), and SF40 (l).
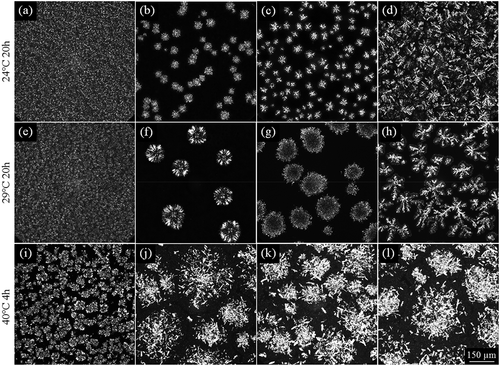
At 29°C, LF30 showed larger spherulites (119 ± 16 μm) than at 24°C (). If we presume that the observed crystal growth was diffusion-controlled, it would be expected to result in smaller crystals with decreasing temperature. Conversely, given the lower degree of supersaturation at 29°C, there was a lower rate of nucleation but higher growth rate, resulting in fewer, larger crystalline assemblies with a “coarser” microstructure.[Citation36] LF35 revealed large spherulites (141 ± 13 μm) with cores consisting of small platelet crystals () whereas LF40 manifested itself as large, loosely packed dendrites (). The different fatty acid and TAG compositions of LF30, LF35, and LF40 clearly impacted crystal morphology. As LF40 contained the highest content of palmitic acid and PPP but lowest content of oleic and linoleic acids, it exhibited the highest degree of crystallinity (,b)) and SFC ().[Citation32] Given the higher trisaturated TAG content in LF40, there was an increase in effective supersaturation compared to LF30 and LF35. This resulted in a branched crystalline pattern with an overall circular shape. The mode of crystallization involved radially elongated grain structures with their fast growth in specific directions. Compared to LF30 and LF35, these crystalline assemblies formed upon a higher driving force and demonstrated reduced “orientational mobility” resulting in the branching observed at LF40.
The crystal morphology of all SF crystallized at 40°C was substantially different from PS and the LF but not from one another (,k,l)). These samples exhibited large, disorganized agglomerates comprising amassed rod-like crystals. Their high degree of crystallinity concurred with their high SFCs (43–47%) during isothermal crystallization at 40°C ().
Crystallization and melting
The DSC crystallization and melting thermograms of PS and all fractions are given in . The parameters obtained from the thermograms consisted of the peak temperatures for each crystallization and melting thermal event as well as crystallization enthalpy (). PS exhibited two crystallization peaks, with the first at ~28°C (TC1) associated with higher-melting TAG such as POP, PPP, and PPS ())[Citation40] and the second at ~4°C (TC2) related to lower-melting, more unsaturated TAG such as POO and PLO. [Citation28]
Table 5. Crystallization and melting transition temperatures and enthalpies for PS and all fractions.
Figure 4. Differential scanning calorimetry thermograms for the (a) crystallization and (b) melting of PS and all fractions.
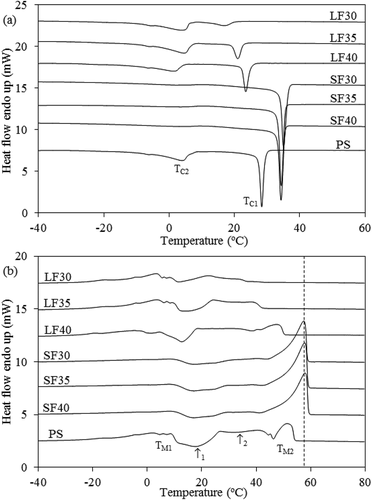
The crystallization thermograms of the LFs also showed two exothermic peaks (). As the temperature fractionation was reduced from 40°C to 30°C, peak TC1 decreased from ~25°C to 17°C with peak TC2 only slightly changing (p > 0.05). Similarly, the crystallization enthalpy of the LF high-melting peak () decreased from 26 J/g to 9 J/g whereas that of the low-melting peak (
) increased from 34 J/g to 42 J/g (). This may be explained by the enrichment of lower-melting TAG and depletion of their higher-melting counterparts at lower fractionation temperature. [Citation41]
All SFs exhibited a single sharp crystallization peak at temperatures higher than the high-melting peaks of PS and the LFs (). The fractionation temperature had no effect on Tc and (p > 0.05; ). The higher
of all SFs (74–75 J/g) resulted from the presence of high levels of saturated TAGs (PPP),[Citation27,Citation39] which induced the co-crystallization of lower-melting TAG, based on the absence of a lower-melting peak.
It was expected that a higher fractionation temperature would result in a higher SF crystallization temperature, given the isolation of fewer, higher-melting TAG into SF, e.g., in SF40 vs. SF30. However, this was not the case as evidenced by the lack of change in IV and saturated TAG (PPS, PPP, and POP; ~95–98% of total TAG; and ).
The melting thermograms of PS and all LFs were complex, consisting of multiple thermal events that limited effective interpretation. The PS thermogram exhibited two major broad endotherm regions ()), corresponding to the endothermic transitions of higher (TM2) and lower-melting TAG (TM1) of PS as well as an exothermic peak at ~18°C (arrow 1) likely associated with the polymorphic transition of the lower-melting fraction.[Citation9,Citation28] The higher-temperature region was composed of a plateau (arrow 2) and higher-melting peak at 51°C. It was not possible to clearly measure the associated with these thermal events.
The melting thermograms of all LFs and SFs also exhibited two endothermic regions ()). For the LFs, the lower-temperature endotherm area was not very different from PS. The higher-temperature endotherm region, however, became less pronounced as the fractionation temperature decreased from 40°C to 30°C. For the SF, a high temperature peak at 57–58°C () dashed line) dominated the thermograms with a weak transition at ~ 8°C also visible. Fractionation temperature did not significantly affect the melting thermograms of the SFs.
Polymorphism
Upon cooling from 60°C to 10°C, PS began to crystallize at 31°C with SAXD peaks appearing at 46.3, 49.1, and 51.3 Å ()). The long spacing associated with the α polymorph of high-melting PS has been previously reported at 46 Å, with those of PPP, PPS/PSP, PSS/SPS, and SSS α crystals at 46.8, 47.6/46.7, 48.5/49.2, and 50.6 Å, respectively.[Citation42,Citation43] At the same temperature, a PS WAXD diffraction peak appeared at 4.18 Å ()), corresponding to the formation of α crystals in PO and its fractions.[Citation44] Once the temperature reached 26°C, additional WAXD peaks appeared at 3.87 and 4.36 Å. Along with the peak at 4.18 Å slightly shifting to 4.2 Å, the dominant SAXD peak shifted to 42.6 Å, demonstrating the transition from α to β’ crystals.[Citation42,Citation44] At about the same temperature, a weak β polymorph peak emerged at 4.6 Å, which was associated with the presence of tripalmitin.[Citation42] These results suggested that there was a polymorphic transition from the α form toward a mixture of β’ and β crystals as the temperature was lowered.[Citation45] No change in diffraction patterns occurred during the ensuing isothermal crystallization at 10°C.
Figure 5. Time-dependent small- (top row) and wide-angle (bottom row) X-ray diffraction patterns of PS (a & d), LF (b & e), and SF (c & f) of PS (obtained from fractionation temperature of 35°C) when cooled from 60°C to 10°C followed by isothermal crystallization at 10°C for 1 h.
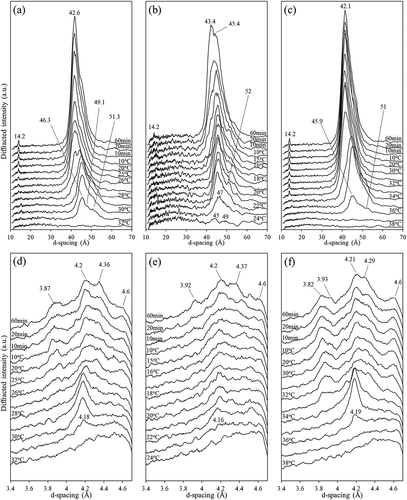
All LF and SF showed similar SAXD and WAXD patterns, therefore only the X-ray diffractograms of LF35 and SF35 are shown. LF30, LF35, and LF40 began to crystallize at different temperatures: 19°C, 24°C, and 27°C, respectively, indicating a strong effect of fractionation temperature on crystallization. All LF first crystallized with weak SAXD peaks at ~46 and ~49 Å and a WAXD peak at 4.16 Å, corresponding to the α polymorph mentioned above (). An additional peak appeared at 43.4 Å, which was related to the α-to-β′ transition.[Citation42] Both LF35 and LF40 showed a faster transition from the α to β′ form, presumably due to the higher content of high-melting TAGs. The final SAXD and WAXD peaks showed β′ crystals (3.9, 4.2, 4.4, and 43.4 Å) and β (4.6 Å) forms, with the β′ form being dominant.
All SF first crystallized at ~36–37°C, with one SAXD peak at ~46 Å, a shoulder at ~51 Å and one WAXD peak at 4.19 Å associated with the α polymorph (,f)). At ~33°C, the SAXD diffraction shifted from ~46 to ~42 Å and there appeared a number of additional WAXD peaks between 3.82 Å and 4.29 Å as well as the characteristic β form spacing at 4.6 Å. The shift of the main SAXD peak toward ~42 Å occurred more quickly in SF than in PS and LF, implying a faster transition into the β polymorph.[Citation26] Such an increase in β crystal content with PPP content is supported by Timms,[Citation46] who stated that the formation of β crystals was linked with fatty acid symmetry within TAGs.
Conclusion
The innate physical and chemical characteristics of PS can be exploited to generate fractions with different compositions and crystallization behaviors. The LF fractions obtained from separation at 30°C, 35°C, and 40°C for 1 h showed SFC profiles more appropriate for margarines than the SF. LF exhibited spherulite-type crystals and crystallized predominantly into the β’ polymorph and therefore could be used in margarine production. The SFs showed very high SFC values and consisted of densely packed, overlapping crystals in both the β’ and β polymorphs. The SF fractions may be used in the confectionery industry given their β-tending crystals as long as they can effectively mix with other fats. With a proper understanding of the crystallization processes occurring in PS, fractionation process conditions may be optimally controlled to produce fractions with well-defined physical properties optimal for specific processed food applications.
Additional information
Funding
Related Research Data
References
- Chen, C. W.; Lai, O. M.; Ghazali, H. M.; Chong, C. L. Isothermal Crystallization Kinetics of Refined Palm Oil. Journal of the American Oil Chemists’ Society 2002, 79(4), 403–410. DOI: 10.1007/s11746-002-0496-4.
- Lin, S. W.;. Palm Oil. In Vegetable Oils in Food Technology, Gunstone, F. D., Ed.; CRC Press: Boca Raton, FL, USA, 2002; pp 59–93.
- Gibon, V.;. Fractionation of Lipids for Use in Food. In Modifying Lipids for Use in Food, Gunstone, F. D., Ed.; Woodhead Publishing Limited: Cambridge, UK, 2006; pp 201–233.
- Timms, R. E.;. Fractional Crystallisation - the Fat Modification Process for the 21st Century. European Journal of Lipid Science and Technology 2005, 107(1), 48–57. DOI: 10.1002/(ISSN)1438-9312.
- Kang, K. K.; Kim, S.; Kim, I. H.; Lee, C.; Kim, B. H. Selective Enrichment of Symmetric Monounsaturated Triacylglycerols from Palm Stearin by Double Solvent Fractionation. LWT - Food Science and Technology 2013, 51(1), 242–252. DOI: 10.1016/j.lwt.2012.08.009.
- Gibon, V.;. Palm Oil and Palm Kernel Oil Refining and Fractionation Technology. In Palm Oil: Production, Processing, Characterization, and Uses, Lai, O. M., Tan, C. P., Akor, C. C., Eds.; AOCS Press: Urbana, IL, USA, 2012; pp 329–372.
- Kellens, M.; Gibon, V.; Hendrix, M.; de Greyt, W. Palm Oil Fractionation. European Journal of Lipid Science and Technology 2007, 109(4), 336–349. DOI: 10.1002/(ISSN)1438-9312.
- Son, J. M.; Lee, K. T.; Akoh, C. C.; Kim, M. R.; Kim, M. J.; Lee, J. H. Optimisation of Tripalmitin-Rich Fractionation from Palm Stearin by Response Surface Methodology. Journal of the Science of Food and Agriculture 2010, 90(9), 1520–1526. DOI: 10.1002/jsfa.3978.
- Zaliha, O.; Chong, C. L.; Cheow, C. S.; Norizzah, A. R.; Kellens, M. J. Crystallization Properties of Palm Oil by Dry Fractionation. Food Chemistry 2004, 86(2), 245–250. DOI: 10.1016/j.foodchem.2003.09.032.
- Pande, G.; Akoh, C. C.; Lai, O.-M. Food Uses of Palm Oil and Its Components. In Palm Oil: Production, Processing, Characterization, and Uses, Lai, O. M., Tan, C. P., Akor, C. C., Eds.; AOCS Press: Urbana, IL, USA, 2012; pp 561–586.
- Sato, K.; Bayés-García, L.; Calvet, T.; Cuevas-Diarte, M. À.; Ueno, S. External Factors Affecting Polymorphic Crystallization of Lipids. European Journal of Lipid Science and Technology 2013, 115(11), 1224–1238. DOI: 10.1002/ejlt.201300049.
- Miskandar, M. S.; Che Man, Y. B.; Yusoff, M. S. A.; Abdul Rahman, R. Effect of Emulsion Temperature on Physical Properties of Palm Oil-Based Margarine. Journal of the American Oil Chemists’ Society 2002, 79(12), 1163–1168. DOI: 10.1007/s11746-002-0621-4.
- Nor Aini, I.; deMan, L.; Tang, T. S.; Chong, C. L. Chemical Composition and Physical Properties of Soft (Tub) Margarines Sold in Malaysia. Journal of the American Oil Chemists’ Society 1996, 73(8), 995–1001. DOI: 10.1007/BF02523407.
- Timms, R. E.;, Polymorphism of Triglycerides and Fats. Seminar Paper at PORIM (Malaysia), 1994.
- Calliauw, G.; Fredrick, E.; Gibon, V.; Greyt, W. D.; Wouters, J.; Foubert, I.; Dewettinck, K. On the Fractional Crystallization of Palm Olein: Solid Solutions and Eutectic Solidification. Food Research International 2010, 43(4), 972–981. DOI: 10.1016/j.foodres.2010.01.002.
- Nor Aini, I.; Miskandar, M. S. Utilization of Palm Oil and Palm Products in Shortenings and Margarines. European Journal of Lipid Science and Technology 2007, 109(4), 422–432. DOI: 10.1002/(ISSN)1438-9312.
- Norberg, S.;. Chocolate and Confectionery Fats. In Modifying Lipids for Use in Food, Gunstone, F., Ed.; Woodhead Publishing Limited: Cambridge, UK, 2006; pp 488–516.
- Costales-Rodríguez, R.; Gibon, V.; Verhé, R.; De Greyt, W. Chemical and Enzymatic Interesterification of a Blend of Palm Stearin: Soybean Oil for Low Trans-Margarine Formulation. Journal of the American Chemical Society 2009, 86(7), 681–697.
- Petrauskaite, V.; De Greyt, W.; Kellens, M.; Huyghebaert, A. Physical and Chemical Properties of Trans-Free Fats Produced by Chemical Interesterification of Vegetable Oil Blends. Journal of the American Oil Chemists’ Society 1998, 75(4), 489–493. DOI: 10.1007/s11746-998-0252-z.
- AOCS. Official Methods and Recommended Practices of the American Oil Chemists’ Society (AOCS). AOCS Press: Champaign, IL, USA, 2003.
- AOAC. Official Methods of Analysis of the Association of Official Analytical Chemists (AOAC). AOAC, Inc: Arlington, VA, USA, 2000.
- Haryati, T.; Che Man, Y. B.; Ghazali, H. M.; Asbi, B. A.; Buana, L. Determination of Iodine Value of Palm Oil Based on Triglyceride Composition. Journal of the American Oil Chemists’ Society 1998, 75(7), 789–792. DOI: 10.1007/s11746-998-0227-0.
- Zwietering, M. H.; Jongenburger, I.; Rombouts, F. M.; Van’t Riet, K. Modeling of the Bacterial Growth Curve. Applied and Environmental Microbiology 1990, 56(6), 1875–1881.
- Laia, O. M.; Ghazalia, H. M.; Cho, F.; Chong, C. L. Physical and Textural Properties of an Experimental Table Margarine Prepared from Lipase-Catalysed Transesteri®Ed Palm Stearin: Palm Kernel Olein Mixture during Storage. Food Chemistry 2000, 71(2), 173–179. DOI: 10.1016/S0308-8146(00)00084-4.
- Hoffmann, G.;. Production of Edible-Fat Products of High Fat Content. In The Chemistry and Technology of Edible Oils and Fats and Their High Fat Products, Hoffmann, G., Taylor, S. L., Eds.; Academic Press: London, UK, 1989; pp 279–338.
- Chrysan, M. M.;. Margarines and Spreads. In Bailey’s Industrial Oil and Fat Products, 6th ed. Shahidi, F., Ed.; John Wiley & Sons, Inc: Hoboken, NJ, USA, 2005; Vol. 4, pp 33–82.
- Saadi, S.; Ariffin, A. A.; Ghazali, H. M.; Miskandar, M. S.; Boo, H. C.; Abdulkarim, S. M. Application of Differential Scanning Calorimetry (DSC), HPLC and pNMR for Interpretation Primary Crystallisation Caused by Combined Low and High Melting TAGs. Food Chemistry 2012, 132(1), 603–612. DOI: 10.1016/j.foodchem.2011.10.095.
- Tan, C. P.; Che Man, Y. B. Differential Scanning Calorimetric Analysis of Edible Oils: Comparison of Thermal Properties and Chemical Composition. Journal of the American Oil Chemists’ Society 2000, 77(2), 143–155. DOI: 10.1007/s11746-000-0024-6.
- Kellens, M.; Meeussen, W.; Riekel, C.; Reynaers, H. Time Resolved X-Ray Diffraction Studies of the Polymorphic Behaviour of Tripalmitin Using Synchrotron Radiation. Chemistry and Physics of Lipid 1990, 52(2), 79–98. DOI: 10.1016/0009-3084(90)90153-I.
- Marikkar, J. M. N.; Saraf, D.; Dzulkifly, M. H. Effect of Fractional Crystallyzation on Composition and Thermal Behavior of Coconut Oil. International Journal of Food Properties 2013, 16(6), 1284–1292. DOI: 10.1080/10942912.2011.585728.
- Sonwai, S.; Rungprasertphol, P.; Nantipipat, N.; Tungvongcharoan, S.; Laiyangkoon, N. Characterization of Coconut Oil Fractions Obtained from Solvent Fractionation Using Acetone. Journal of Oleo Science 2017, 66(9), 951–961. DOI: 10.5650/jos.ess16224.
- Basso, R. C.; Ribeiro, A. P. B.; Masuchi, M. H.; Gioielli, L. A.; Gonçalves, L. A.; Dos Santos, A. O.; Cardoso, L. P.; Grimaldi, R. Tripalmitin and Monoacylglycerols as Modifiers in the Crystallisation of Palm Oil. Food Chemistry 2010, 122(4), 1185–1192. DOI: 10.1016/j.foodchem.2010.03.113.
- Nusantoro, B. P.;. Physicochemical Properties of Palm Stearin and Palm Mid Fraction Obtained by Dry Fractionation. Agritech 2009, 29(3), 154–158.
- Bockisch, M.;. Fats and Oils Handbook. AOCS Press: Champaign, IL, USA, 1998.
- Herrera, M. L.; De León Gatti, M.; Hartel, R. W. A Kinetic Analysis of Crystallization of A Milk Fat Model System. Food Research International 1999, 32(4), 289–298. DOI: 10.1016/S0963-9969(99)00083-6.
- Campbell, S. D.; Goff, H. D.; Rousseau, D. Comparison of Crystallization Properties of a Palm Stearin/Canola Oil Blend and Lard in Bulk and Emulsified Form. Food Research International 2002, 35(10), 935–944. DOI: 10.1016/S0963-9969(02)00156-4.
- Lawler, P. J.; Dimick, P. S. Crystallization and Polymorphism of Fats. In Food Lipids: Chemistry, Nutrition, and Biotechnology, 3rd ed. Akoh, C. C., Min, D. B., Eds.; CRC Press LLC: Boca Raton, FL, USA, 2008; pp 245–266.
- de Oliveira, G. M.; Ribeiro, A. P. B.; Kieckbusch, T. G. Hard Fats Improve Technological Properties of Palm Oil for Applications in Fat-Based Products. LWT - Food Science and Technology 2015, 63(2), 1155–1162. DOI: 10.1016/j.lwt.2015.04.040.
- Tanaka, L.; Isogai, T.; Miura, S.; Murakami, M. Effect of Triacylglycerol Species on the Crystallizing Behavior of a Model Water/Oil Emulsion. European Journal of Lipid Science and Technology 2010, 112(3), 304–309.
- Saadi, S.; Ariffin, A. A.; Ghazali, H. M.; Miskandar, M. S.; Abdulkarim, S. M.; Boo, H. C. Effect of Blending and Emulsification on Thermal Behavior, Solid Fat Content, and Microstructure Properties of Palm Oil-Based Margarine Fats. Journal of Food Science 2011, 76(1), C21–30. DOI: 10.1111/j.1750-3841.2010.01922.x.
- Rizzo, G.; Norton, J. E.; Norton, I. T. Emulsifier Effects on Fat Crystallisation. Food Structure 2015, 4, 27–33. DOI: 10.1016/j.foostr.2014.11.002.
- Ishikawa, H.; Shiota, M.; Murakami, M.; Nakajima, I. Polymorphic Behavior of Palm Oil and Modified Palm Oils. Food Science and Technology International, Tokyo 1997, 3(1), 77–81. DOI: 10.3136/fsti9596t9798.3.77.
- Lutton, E. S.;. Review of the Polymorphism of Saturated Even Glycerides. Journal of the American Chemical Society 1950, 27(7), 276–281.
- Braipson-Danthine, S.; Gibon, V. Comparative Analysis of Triacylglycerol Composition, Melting Properties and Polymorphic Behavior of Palm Oil and Fractions. European Journal of Lipid Science and Technology 2007, 109(4), 359–372. DOI: 10.1002/(ISSN)1438-9312.
- Chong, C. L.; Kamarudin, Z.; Lesieur, P.; Marangoni, A.; Bourgaux, C.; Ollivon, M. Thermal and Structural Behaviour of Crude Palm Oil: Crystallisation at Very Slow Cooling Rate. European Journal of Lipid Science and Technology 2007, 109(4), 410–421. DOI: 10.1002/(ISSN)1438-9312.
- Timms, R. E.;. Phase Behaviour of Fats and Their Mixtures. Progress in Lipid Research. 1984, 23(1), 1–38. DOI: 10.1016/0163-7827(84)90004-3.