
 ?Mathematical formulae have been encoded as MathML and are displayed in this HTML version using MathJax in order to improve their display. Uncheck the box to turn MathJax off. This feature requires Javascript. Click on a formula to zoom.
ABSTRACT
It is useful to carefully observe the evolution of foam structures to elucidate the factors affecting cream during whipping. In this study, confocal laser scanning microscopy and a double dyeing technology were used to investigate the microstructural evolution of a rigid foam structure in whipped cream. The location of fat and proteins were determined according to the signals they produce at different characteristic wavelengths. Protein membranes on the surface of air bubbles were clearly observed. A simple yet comprehensive characterization of the whipping process was established according to the micrographs and supported by relevant theories. The formation of a rigid foam structure depends on foaming of the protein in the plasma phase and partial coalescence of fat globules. The formation of protein foam in the cream, creation of net structure, and system breakage and collapse phenomena occurring throughout the whole whipping evolution process was depicted and distinguished visually by different colors.
Introduction
Like all food products, whipped cream must be acceptable to the consumer both physically and organoleptically. High-quality whipped cream generally has fat content around 30–40% and is easy to whip into rigid foam with high overrun value (over 80–90%).[Citation1] Accurately and comprehensively assessing the factors that affect the foam structure is necessary to improve the stability and whipping characteristics of whipped cream. It is useful to observe the structure evolution of whipped cream for this purpose – especially the locations of fat globules and proteins and the air bubble microstructures.
Factors at work during the whipping process and interfacial changes occurring in cream during whipping have been observed by previous researchers via light microscopy, scanning electron microscopy, and transmission electron microscopy, among other microscopy techniques.[Citation2–Citation7] The whipping process is often described as having three stages.[Citation1,Citation8,Citation9] At the first stage, the overrun increases rapidly and large air bubbles are introduced. This initial foam is stabilized by protein. At the second stage, air bubbles gradually decrease in diameter and the extent of fat globule aggregation increases. In the third stage, a thin protein membrane on the surface of air bubbles is penetrated by fat globules and sparsely distributed fat crystals which settle in the plane of the air–plasma interface.[Citation10] A partially coalesced framework of fat globules is built up at this point that gives stiffness to the whipped cream structure.
Previously published descriptions of the whipping process were dependent on electron microscopy observation and theoretical considerations, and lacked detailed analysis of the changes occurring throughout the whole process.[Citation8,Citation9,Citation11] Large magnification is also typically used, and the micrographs used to analyze the aggregation and distribution of fat globules at the interface show only a bubble surface or connected area among several bubbles. Changes in the fat globules in the plasma phase at the primary stage are rarely investigated, and previous researchers have been unable to identify the location of proteins (especially in regards to the protein membrane on the surface of air bubbles).
We applied confocal laser scanning microscopy (CLSM) in this study, which has multiple channels available for detecting the fluorescence signals of a given sample. We also used a dual staining technique to make accurate distinctions between fat and proteins in whipped cream samples. Nile red (NR) has been extensively used for staining the fat phase in bulk palm oil systems and cream.[Citation12,Citation13] Fluorescein isothiocyanate (FITC) can also be applied to label proteins non-covalently.[Citation14] Protein and fat produce signals at different wavelengths, which can be marked in different colors.
The purpose of this article was to provide micrographs detailing the complete whipping process with different magnifications and to provide morphological evidence supporting theoretical considerations of the whipping process. We gathered detailed data by measuring the overrun, firmness, and particle size distribution of whipped cream during the whole whipping process. The mechanisms at work behind changes in foam structure were analyzed to provide a simple, yet comprehensive characterization of the whipping process. Protein membranes on the surface of air bubbles were clearly observed in the micrographs, which supports our theoretical analysis that the surface consists of a protein membrane encompassing fat globules.
Materials and methods
Microstructure
Sample preparation: Commercially available UHT whipped cream (Anchor, New Zealand) with a composition of 35% milk fat was purchased from a local supermarket. Its ingredients include cream, milk solid (skimmed milk), emulsifiers (Glycerin Monostearate and Tween 80), and stabilizer (guar gum, xanthan gum and carrageenan). After storage at 4°C for 24 h, 200 g of whipped cream sample was poured into a beaker. Before whipping, 2.0 mL of 0.02% (w/t) NR (Solarbio, China) and FITC (Solarbio, China) were added to the samples to stain the fat and proteins, respectively.[Citation12,Citation15] Whipping was performed at 4°Cwith a kitchen mixer (AHM-P125A ACA, China) at two speed levels. Low speed (950 rpm) applied for 30 s allow for maximum air inclusion, then the mixer was switched to high speed (1100 rpm); the cream was whipped for varying durations (0, 15, 30, 60, 90, 120, 130, 160, 200, and 320 s) for comparison. After whipping, the stained samples were immediately placed on a slide for observation.
CLSM: A Leica inverted microscope (TCS SP2 CLSM, Leica Microsystems, Heidelberg, Germany) equipped with a 10× objective and 64 × 1.4 or 100 × 1.4 oil-immersion objective was applied to acquire images. The fluorescence in samples was excited by the 488 nm (20 mV) line of an Argon laser. The fluorescence light emitted by NR and FITC was detected at 595–648 nm and 500–536 nm, respectively.[Citation12]
Particle size distribution observation
After being stored at 4°C for 24 h, the cream was whipped at 4°C for various durations (0, 15, 30, 60, 90, 120, 130, 160, and 200 s). The size distribution of the fat clumps was determined on a Malvern MasterSizer 3000 (Malvern Instruments Co., Ltd., Worcestershire, UK). The refractive index, dispersed phase adsorption, and continuous phase refractive index were set to 1.52, 0.1, and 1.33, respectively.[Citation16,Citation17]
Overrun measurement
After being stored at 4°C for 24 h, the cream was whipped at 4°C for various durations (0, 15, 30, 60, 90, 120, 130, 160, and 200 s). Overrun is a common indicator that represents the amount of air introduced in cream and can be determined by using the following equation[Citation18–Citation21]:
where Munwhipped and Mwhipped are the mass of unwhipped and whipped cream with the same volume, respectively. Each sample was measured in triplicate.
Determination of firmness
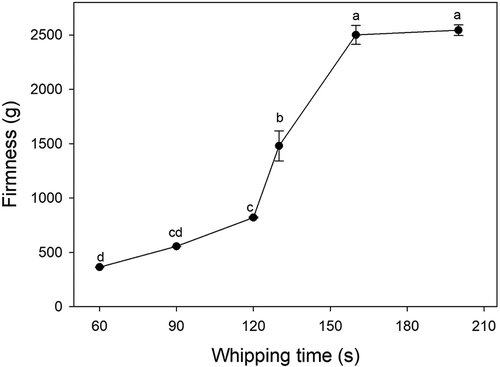
After being stored at 4°C for 24 h, the cream was whipped at 4°C for various durations (60, 90, 120, 130, 160, and 200 s). The 15 and 30 s durations were left out of this test as the fluidity of samples was too large to determine the firmness. Firmness was determined using a Texture Analyzer (TA-XT2i, Lloyd Instruments, UK) equipped with an acrylic probe (HDP/FE3).[Citation19,Citation20,Citation22] Measurement was performed at the rate of 1 mm s−1 over a distance of 30 mm in the sample. The trigger value for the start of the measurement was set to 5 g. Tests were carried out in triplicate.
Statistical analysis
Statistical analysis (one-way analysis of variance) was conducted in SPSS 23. The difference between means was determined by Bonferroni’s test and significance was defined at P < 0.05.
Results and discussion
Protein foam formation
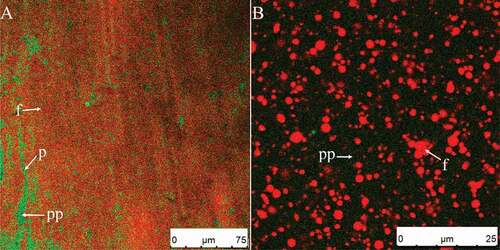
shows the original whipped cream and cream diluted by five times using distilled water (). The plasma phase is highly stained, indicating that its protein content is very high (); fat globules are well dispersed throughout the plasma phase (). Originally, the cream is just an oil in water emulsion without air bubbles. Proteins and emulsifiers act as stabilizer for oil droplets owing to their amphipathicity. Theoretically, there is a protein and/or emulsifier layer around the fat globules after homogenization that prevents the flocculation of fat globules or phase separation of cream during quiescence.[Citation21,Citation23] In addition, according to previous studies, surfactants can displace proteins from the oil surface to form a thin fat globule membrane.[Citation17,Citation24,Citation25] The competitive adsorption between protein and emulsifiers on the oil surface can affect the stability of fat globules, which is related to the types of protein and emulsifiers.[Citation26–Citation31] However, the distribution of protein adsorbed on the surface of fat globules is not visible in because the protein layer is so thin. In other words, the proteins were mainly displaced by emulsifiers in cream sample; the emulsifier layer surrounded the oil globules nor the protein layer. During subsequent whipping, the air bubbles, proteins, and oil droplets altogether experienced serious changes.
Figure 1. CSLM-micrographs of original cream (A) and diluted cream (five times using distilled water) (B). Red and green signals in plasma phase (pp) represent fat (f) and protein (p), respectively.
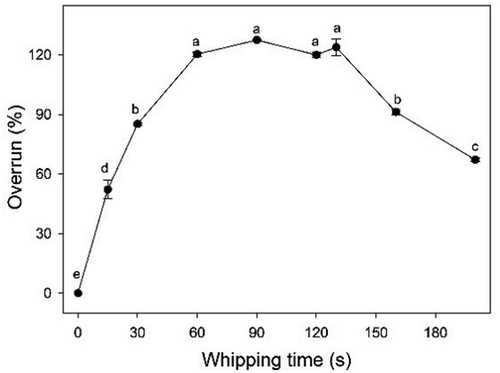
We first determined the overrun of the cream at different whipping time points (). During the first 15 s at low speed (950 rpm), the overrun of the system quickly increased () due to the foaming of protein and emulsifiers in the plasma phase resulting in a large amount of air filling the emulsions in the form of large bubbles. However, these bubbles were unstable – if whipping was stopped, they rose quickly to the surface of the cream and disappeared that coincides with findings made previously by Aken.[Citation9]
Figure 2. The overrun of the whipped cream at different whipping time.
shows micrographs of cream whipped for 15 s at low speed (950 rpm). The image shown in was taken 80 s later than of the same air bubble. Air bubbles were introduced into the emulsion once the mechanical agitation started. As opposed to the situation shown in , proteins not only existed in the plasma phase but also were absorbed on the air–water interface. The diameter of these bubbles gradually decreased during observation (–), because the framework structure had not yet formed and there were no sufficient fat globules adsorbed on the surface of the bubbles. The firmness of the foam could not be determined because the emulsion was in liquid form. At the same time, fat globules tended to aggregate into a sheet-like structure in the plasma phase () as-evidenced by the right peak (starting at 7 μm) in (15 s). The aggregated fat globules clumped together through partial coalescence. Almost all partial coalescence in the plasma phase during whipping was shear-induced. These shear forces increased the likelihood of collision between fat globules, but did not disturb or deform the droplets if the majority of the fat was solid.[Citation32]
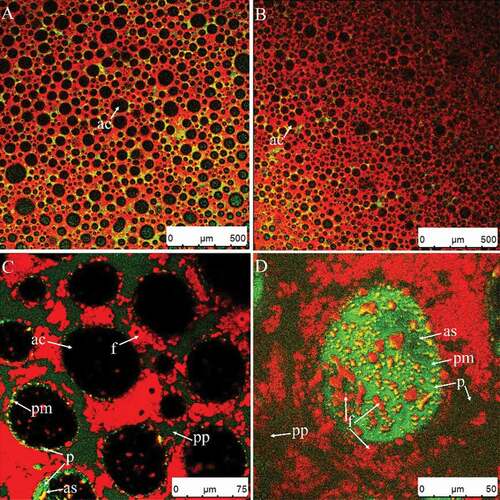
Figure 3. CSLM-micrographs of cream whipped for 15 s at low speed (950 rpm) (A). Image shown in Fig. 3C was taken 80 s later than Fig. 3B of the same air bubble. Red and green signals in plasma phase (pp) represent fat (f) and protein (p), respectively. Black circled areas are air bubble centers (ac); green circles are protein membranes on air bubble surfaces (pm).
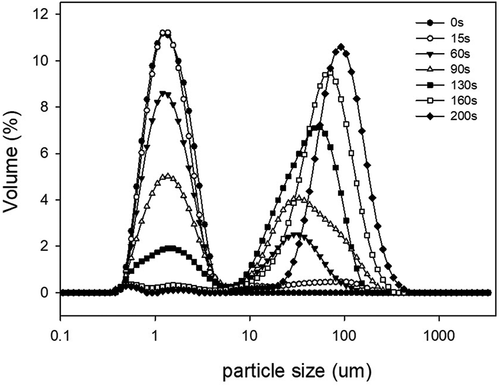
Figure 4. The particle size distribution of various whipped cream produced with a series of whipping durations.
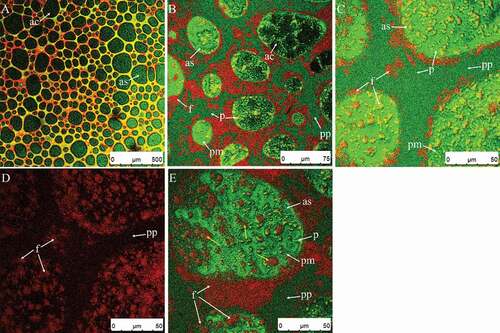
shows micrographs of cream whipped for 30 s at low speed (950 rpm). After whipping for 15 s, the overrun of the system still increased quickly () and the firmness remained unmeasured. A large amount of air was introduced as large bubbles, a few of which were broken into smaller bubbles during whipping (). There were several bubbles of varying diameter (). Based on the microscope images (–), the surface of air bubbles consisted of a protein membrane (bright green circled areas marked with arrows, pp) and some fat globules that had penetrated into the membrane (red arrows). In the first stage, the foam system was mainly protein stabilized.[Citation8] The fat clumps existed mainly in the plasma phase and did not combine with air bubbles () but instead increased steadily (– compared to , curves of 15 and 30 s in ).
Figure 5. (A–E) CSLM-micrographs of cream whipped for 30 s at low speed (950 rpm). Red and green signals in plasma phase (pp) represent fat (f) and protein (p), respectively. Black or green circled areas are the center (ac) or surface (as) of air bubbles, respectively; green circles and area signals indicate protein membranes (pm).
Dynamic changes in bubble diameter with network formation
In the subsequent whipping process, the emulsion experienced some structural changes and the physical properties, such as overrun and firmness showed some differences from the samples discussed above.
shows micrographs of cream whipped for 60 s. The overrun increased at a lower rate compared to that during 0–60 s (). As whipping continued, primary large air bubbles () broke apart into much smaller ones () and free fat globules or small clumps in the plasma phase were attracted to the surface of new air bubbles. Emulsifiers may have competed with the adsorbed protein on the surface of air bubbles, leading to electrostatic effects and decreased stabilization of the film interface. As a result, the firmness was slightly increased in this stage ().
Figure 6. CSLM-micrographs of cream whipped for 30 s at low speed (950 rpm) then for 30 s at high speed (1100 rpm) (A–F). Red and green signals in plasma phase (pp) represent fat (f) and protein (p), respectively. Black or green circled areas are the center (ac) or surface (as) of air bubbles, respectively; green circles and area signals indicate protein membranes (pm).
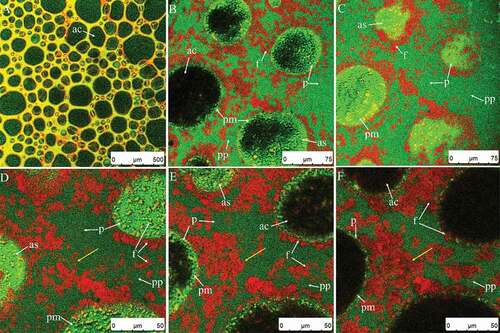
Figure 7. The firmness of the whipped cream at different whipping time.
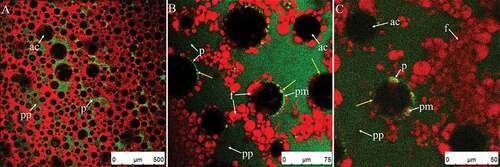
A dynamic process of bubble break-up and coalescence regulated the average diameter of air bubbles in the material, which explains the increased similarity in bubble diameters compared to . A number of clumps with sheet- or thread-like structures in the plasma phase did not combine with air bubbles (–). As shown in –, some parts of the air bubbles were not covered by fat; the accumulation of fat globules at the surface of air bubbles depends on the given time for absorption and balance. The quantity of fat globules connected to the fat absorbed on the air bubble surfaces (–) was increased significantly (compared to –) as whipping time increased. The coalesced fat in the serum phase was gradually connected to the fat adsorbed on the surface and the framework started to form. However, fat globules and some clumps in the serum phase (–, same bubbles) moved independently of each other due to Brownian motion (marked with yellow arrows), i.e., were not part of a network – the network had not yet formed at this point.
As whipping continued ( and ), the diameters of air bubbles decreased but the shape of air bubbles was not completely circular (–). Further uptake of gas was inhibited at this point (), for two reasons[Citation9]: A reduction in density and increase in compressibility of the cream caused by the aeration. The overrun of the foam system appeared to be dependent on the effectiveness of the introduction of air at the first stage, which is related to the foaming of the protein.
Figure 8. CSLM-micrographs of cream whipped for 30 s at low speed (950 rpm) then for 60 s at high speed (1100 rpm) (A–E). Red and green signals in plasma phase (pp) represent fat (f) and protein (p), respectively. Black or green circled areas are the center (ac) or surface (as) of air bubbles, respectively; green circles and area signals indicate protein membranes (pm).
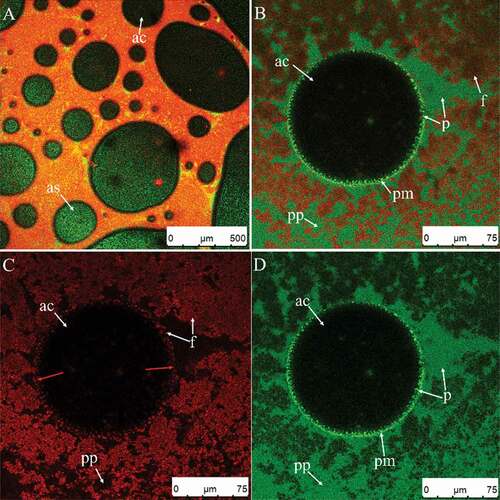
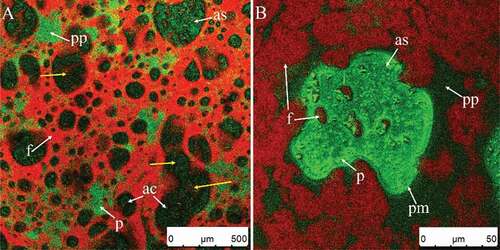
Clumps in the plasma phase were scarce at this point ( compared to ) also shows where the maximum of the right peak increased gradually (curves of 90 s compared to 60 s). The firmness continued to increase during this stage (), because more fat globules or clumps were adsorbed on the air bubble surfaces () and the foam network structure had partially formed (,)). Fat globules and clumps accumulated at the air bubble surfaces (, yellow arrows) due to surface-mediated partial coalescence affected by the presence of air. Surface-mediated partial coalescence occurred in addition to shear-induced partial coalescence (Section 3.2.1). A portion of the fat globules entered the air bubbles through the protein membrane, then released liquid oil. The liquid oil spread across the bubble surface, creating interfacial fat globules, or falling between neighboring adhered droplets through flocculation and aggregation.[Citation8] Some of the air bubbles were connected by partially coalesced fat globules (), but some were not (), suggesting that the cream needed further whipping.
shows a micrograph of the sample whipped before the endpoint, and shows the microstructures of the rigid foam at the endpoint. The diameters of air bubbles quickly decreased at this point ( and ) and grew uniform in size (). There are no significant changes in air bubble diameters visible in () and the overrun did not change within 60 s and 130 s (P > 0.05) (), because there were not enough free fat globules and clumps in the plasma phase () to adsorb on the surfaces of newly formed air bubbles. The air bubbles shown in were small and stable enough to avoid rapid loss of air. There was a densely packed system of bubbles that were coated by fat globules () and the interfacial fat of adjacent bubbles in the sample was connected by chains or aggregates of coalesced globules (). Moens[Citation33] made similar observations using cryo-scanning electron microscopy, where there were fat connections clearly visible between air bubble surfaces. However, at the endpoint, the details of the distribution of fat on the air bubble surfaces varied between studies. The difference may have been caused by various factors, such as storage temperature conditions, type of cream (natural whipped cream or recombined whipped cream), as well as tempering which can affect the susceptibility of fat droplets to partial coalescence by influencing the crystal growth, size, polymorphic form, and the internal arrangement of the fat droplets.[Citation33,Citation34] We found that partial coalescence is the basic mechanism occurring during whipping. The combination of both shear-induced and surface-mediated partially coalesced fat globules formed a network acting as a binder and providing the necessary mechanical strength during whipping. As a result, the firmness of the cream in this stage increased rapidly ().
Figure 9. CSLM-micrographs of cream whipped for 30 s at low speed (950 rpm) then for 90 s (A) or 100 s (B–D) at high speed (1100 rpm). Red and green signals in plasma phase (pp) represent fat (f) and protein (p), respectively. Black or green circled areas are the center (ac) or surface (as) of air bubbles, respectively; green circles and area signals indicate protein membranes (pm).
Fat globules rapidly coalesce and foam structure collapses
After the endpoint, further whipping caused the air bubbles to coalesce () while the diameters of some bubbles significantly increased (compared to ). At the same time, the overrun decreased rapidly () that means the endpoint was passed. Whipping for 110 s may be the endpoint, because even the overrun in 110 s was as large that at 60 s, but the firmness in 110 s was larger than at 60 s, which is beneficial for the hold of foams after whipping. As shown in , the signals of fat on part of the surface grew weaker (yellow arrows), indicating that some clumps or fat globules adsorbed on the surface were released into the continuous phase. The shear force caused smaller clumps to merge into larger clumps by partial coalescence (, ), indicating that the agglomeration of fat globules occurred rapidly at this stage. As a result, the firmness of the sample in this stage increased rapidly (). The rate of partial coalescence should be controlled to prevent the cream from reaching this stage too quickly and to ensure a desirable product.
Figure 10. CSLM-micrographs of cream whipped for 30 s at low speed (950 rpm) then for 130 s at high speed (1100 rpm) (A–C). Red and green signals in plasma phase (pp) represent fat (f) and protein (p), respectively. Black or green circled areas are the center (ac) or surface (as) of air bubbles, respectively; green circles and area signals indicate protein membranes (pm).
The foam system was destroyed as whipping continued, as the texture of the foam was macroscopically deteriorated. shows where a portion of the air bubbles fused together (yellow arrows) and the diameters significantly increased, though some small air bubbles remained. According to Jackubczyk and Niranjan[Citation1], the diameter of the bubbles at this point was either particularly large or particularly small () and bubble size distribution changed from log-normal to a bimodal population. The firmness of the cream was large at this stage (). also shows that the maximum value of left peak dropped to 0.27% (whipped 160 s) and 0.07% (whipped 200 s), because large clumps had gradually formed due to aggregation (). These large clumps then formed extended structures. As shown in , the fat globules adsorbed on the surface of air bubbles drastically decreased (compared to the bubble shown in ), resulting in lost rigidity and destabilization of air bubbles. The bubbles were not circular at this point, but were squeezed into different shapes by the external clumps (). If whipping continued, the large clumps pierced the bubble interfaces and the foam collapsed; this resulted in a reduction in overrun and rapid loss of air () due to the damage inflicted upon membrane proteins and the fat–water interface.[Citation1]
Figure 11. CSLM-micrographs of cream whipped for 70 s at high speed (1100 rpm) after sample reaches the endpoint (A–B). Red and green signals in plasma phase (pp) represent fat (f) and protein (p), respectively. Black or green circled areas are the center (ac) or surface (as) of air bubbles, respectively; green circles and area signals indicate protein membranes (pm).
We found that protein membranes on the surface of air bubbles were visible during the whole whipping process (–). Brooker et al.[Citation5] similarly observed interfacial material from milk plasma foams via polyacrylamide gel electrophoresis to find that it contains mostly β-casein and whey proteins. Modifying the protein composition may impact the composition of the air–water interface and thus the likelihood that fat globules adsorb on the air bubble surfaces during whipping.
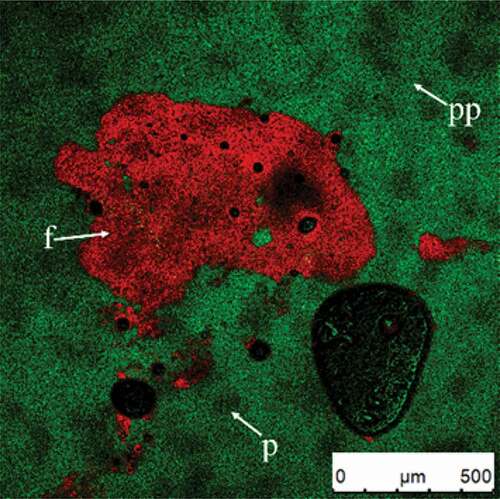
After further whipping, demulsification occurred and all of the air in the material was released. The extended structures became butter granules () through an irreversible, partial-coalescence–driven process.
Figure 12. CSLM-micrograph of butter granule after whipping. Red or green signals in plasma phase (pp) represent fat (f) or protein(p), respectively.
Conclusion
As a notable departure from the literature, we employed CLSM in the present study to observe the foam microstructure of whipped cream for the first time and gained new insight into the fundamental foaming mechanism. We also adopted a double dyeing technology to clearly distinguish fat and protein. We explored changes in foam microstructures during the cream whipping process based on relevant theories and a series of micrographs. Before whipping, proteins in the plasma phase acted as emulsifiers. In subsequent whipping, protein membranes on the surfaces of air bubbles were clearly observed; air bubbles were introduced into the cream though they were not stable and disappeared at the beginning of this process. Fat crystallization trended toward coalescence as a net structure was formed, which was quite relevant with physical properties, such as overrun and firmness. Fat crystallization coalescence was enhanced further as whipping continued. There were no sufficient solid fat containing the net structure at a certain point, so air bubbles could not be fixed and then transformed. Consequently, overrun decreased and firmness increased. The endpoint was passed once the overrun started to decrease.
Additional information
Funding
References
- Jakubczyk, E.; Niranjan, K. Transient Development of Whipped Cream Properties. Journal of Food Engineering 2006, 77(1), 79–83. DOI: 10.1016/j.jfoodeng.2005.06.046.
- Noda, M.; Shiinoki, Y. Microstruture and Rheological Behavior of Whipping Cream. Journal of Texture Studies 1986, 17(2), 189–204. DOI: 10.1111/j.1745-4603.1986.tb00404.x.
- Chang, Y.; Hartel, R. W. Measurement of Air Cell Distributions in Dairy Foams. International Dairy Journal 2002, 12(5), 463–472. DOI: 10.1016/S0958-6946(01)00171-6.
- Caldwell, K. B.; Goff, H. D.; Stanley, D. W. A Low-Temperature Scanning Electron Microscopy Study of Ice Cream. I Techniques and General Microstructure. Food Structure 1992;11(1):1–9.
- Brooker, B. E.; Anderson, M.; Andrews, A. T. The Development of Structure in Whipped Cream. Food Microstructure 1986;5(2):277–285.
- Smith, A. K.; Kakuda, Y.; Goff, H. D. Changes in Protein and Fat Structure in Whipped Cream Caused by Heat Treatment and Addition of Stabilizer to the Cream. Food Research International 2000, 33(8), 697–706. DOI: 10.1016/S0963-9969(00)00115-0.
- Brooker, B. E.;. The Adsorption of Crystalline Fat to the Air-Water Interface of Whipped Cream. Food Structure 1990;9(3):223–229.
- Hotrum, N. E.; Cohen Stuart, M. A.; van Vliet, T.; Avino, S. F.; van Aken, G. A. Elucidating the Relationship between the Spreading Coefficient, Surface-Mediated Partial Coalescence and the Whipping Time of Artificial Cream. Colloids and Surfaces a-Physicochemical and Engineering Aspects 2005;260(1–3):71–78.
- van Aken, G. A.;. Aeration of Emulsions by Whipping. Colloids and Surfaces a-Physicochemical and Engineering Aspects 2001;190(3):333–354.
- Goff, H. D.;. Interactions and Contributions of Stabilizers and Emulsifiers to Development of Structure in Ice-Cream. In Food Colloids and Polymers: Stability and Mechanical Properties; Dickinson, E., Walstra, P., Eds. Chapman and Hall: Chambage, 1993, pp 71–74.
- Needs, E. C.; Huitson, A. The Contribution of Milk Serum Proteins to the Development of Whipped Cream Structure. Food Structure 1991;10(4):353–360.
- Fredrick, E.; Heyman, B.; Moens, K.; Fischer, S.; Verwijlen, T.; Moldenaers, P.; Meeren, P. V.; Dewettinck, K. Monoacylglycerols in Dairy Recombined Cream: II. The Effect on Partial Coalescence and Whipping Properties. Food Research International 2013, 51(2), 936–945. DOI: 10.1016/j.foodres.2013.02.006.
- Graef, V. D.; Microstructural Properties of Isothermal Palm Oil Crystallization; Ghent, Belgium: Ghent University: 2009.
- Maeda, H.; Ishida, N.; Kawauchi, K.; Tuzimura, K. Reaction of Fluorescein-Isothiocyanate with Proteins and Amino Acids. I. Covalent and Noncovalent Binding of Fluorescein-Isothiocyanate and Fluorescein to Proteins. Journal of Biochemistry 1969, 65(5), 777. DOI: 10.1093/oxfordjournals.jbchem.a129077.
- Long, Z.; Zhao, M.; Sun-Waterhouse, D.; Lin, Q.; Zhao, Q. Effects of Sterilization Conditions and Milk Protein Composition on the Rheological and Whipping Properties of Whipping Cream. Food Hydrocolloids 2016, 52, 11–18. DOI: 10.1016/j.foodhyd.2015.06.015.
- Fredrick, E.; van de Walle, D.; Walstra, P.; Zijtveld, J. H.; Fisher, S.; van der Meeren, P.; Dewettinck, K. Isothermal Crystallization Behaviour of Milk Fat in Bulk and Emulsified State. International Dairy Journal 2011, 21(9), 685–695. DOI: 10.1016/j.idairyj.2010.11.007.
- Garcia-Moreno, P. J.; Horn, A. F.; Jacobsen, C. Influence of Casein-Phospholipid Combinations as Emulsifier on the Physical and Oxidative Stability of Fish Oil-in-Water Emulsions. Journal of Agricultural and Food Chemistry 2014, 62(5), 1142–1152. DOI: 10.1021/jf405073x.
- Smith, A. K.; Goff, H. D.; Kakuda, Y. Microstructure and Rheological Properties of Whipped Cream as Affected by Heat Treatment and Addition of Stabilizer. International Dairy Journal 2000, 10(4), 295–301. DOI: 10.1016/S0958-6946(00)00043-1.
- Nguyen, V.; Duong, C. T. M.; Vu, V. Effect of Thermal Treatment on Physical Properties and Stability of Whipping and Whipped Cream. Journal of Food Engineering 2015, 163, 32–36. DOI: 10.1016/j.jfoodeng.2015.04.026.
- Sajedi, M.; Nasirpour, A.; Keramat, J.; Desobry, S. Effect of Modified Whey Protein Concentrate on Physical Properties and Stability of Whipped Cream. Food Hydrocolloids 2014, 36, 93–101. DOI: 10.1016/j.foodhyd.2013.09.007.
- Allen, K. E.; Dickinson, E.; Murray, B. Acidified Sodium Caseinate Emulsion Foams Containing Liquid Fat: A Comparison with Whipped Cream. Lwt-Food Science and Technology 2006, 39(3), 225–234. DOI: 10.1016/j.lwt.2005.02.004.
- Zhao, Q.; Zhao, M.; Yang, B.; Cui, C. Effect of Xanthan Gum on the Physical Properties and Textural Characteristics of Whipped Cream. Food Chemistry 2009, 116(3), 624–628. DOI: 10.1016/j.foodchem.2009.02.079.
- Goff, H. D.;. Instability and Partial Coalescence in Whippable Dairy Emulsions. Journal of Dairy Science 1997, 80(10), 2620–2630. DOI: 10.3168/jds.S0022-0302(97)76219-2.
- Zhou, X.; Chen, L.; Han, J.; Shi, M.; Wang, Y.; Zhang, L.; Li, Y.; Wu, W. Stability and Physical Properties of Recombined Dairy Cream: Effects of Soybean Lecithin. International Journal of Food Properties 2017, 20(10), 2223–2233.
- Fang, Y.; Dalgleish, D. G. Casein Adsorption on the Surfaces of Oil-In-Water Emulsions Modified by Lecithin. Colloids and Surfaces B: Biointerfaces 1993, 1(6), 357–364. DOI: 10.1016/0927-7765(93)80030-3.
- Murray, B. S.; Cros, L. Adsorption of β-lactoglobulin and β-casein to Metal Surfaces and Their Removal by a Non-Ionic Surfactant, as Monitored via a Quartz Crystal Microbalance. Colloids & Surfaces B Biointerfaces 1998, 10(4), 227–241. DOI: 10.1016/S0927-7765(97)00066-0.
- Dickinson, E.; Rolfe, S. E.; Dalgleish, D. G. Competitive Adsorption in Oil-In-Water Emulsions Containing α-lactalbumin and β-lactoglobulin. Food Hydrocolloids 1989, 3(3), 193–203. DOI: 10.1016/S0268-005X(89)80003-7.
- Brown, E. M.; Carroll, R. J.; Pfeffer, P. E.; Sampugna, J. Complex Formation in Sonicated Mixtures of β-Lactoglobulin and Phosphatidylcholine. Lipids 1983, 18(2), 111–118. DOI: 10.1007/BF02536104.
- Arboleya, J. C.; Sutcliffe, L. H.; Wilde, P. J. Density and Microviscosity Studies of Palm Oil/Water Emulsions. Journal of Agricultural and Food Chemistry 2005, 53(11), 4448–4453. DOI: 10.1021/jf050129y.
- Wilde, P.; Mackie, A.; Husband, F.; Gunning, P.; Morris, V. Proteins and Emulsifiers at Liquid Interfaces. Advances in Colloid and Interface Science 2004, 108–109, 63–71. DOI: 10.1016/j.cis.2003.10.011.
- Dalgleish, D. G.; Srinivasan, M.; Singh, H. Surface Properties of Oil-In-Water Emulsion Droplets Containing Casein and Tween 60. Journal of Agricultural and Food Chemistry 1995, 43(9), 2351–2355. DOI: 10.1021/jf00057a007.
- Arboleya, J. C.; Ridout, M. J.; Wilde, P. J. Rheological Behaviour of Aerated Palm Kernel Oil/Water Emulsions. Food Hydrocolloids 2009, 23(5), 1358–1365. DOI: 10.1016/j.foodhyd.2008.10.007.
- Moens, K.; Masum, A. K. M.; Dewettinck, K. Tempering of Dairy Emulsions: Partial Coalescence and Whipping Properties. International Dairy Journal 2016, 56, 92–100. DOI: 10.1016/j.idairyj.2016.01.007.
- Moens, K.; Clercq, N. D.; Verstringe, S.; Dewettinck, K. Revealing the Influence of Tempering on Polymorphism and Crystal Arrangement in Semi-Crystalline Oil-In-Water Emulsions. Crystal Growth & Design 2015, 15(12), 5693–5704. DOI: 10.1021/acs.cgd.5b00665.