
ABSTRACT
In this study, the individual and data fusion of Fourier transform infrared (FT-IR) spectroscopy and inductively coupled plasma atomic emission spectrometry (ICP–AES) were used for the discrimination of five species of Boletaceae mushrooms with the aid of support vector machine (SVM). First, the original FT-IR spectra of 230 samples with different species were preprocessed and optimized by second derivative (2D), Savitzky–Golay filter (15:1) and standardized normal variate. Second, the datasets of FT-IR spectra and ICP–AES were integrated, and the low-level data fusion strategy was used to classify different species mushrooms. Third, the latent variables of elements concentration and FT-IR spectra were extracted by partial least square discriminant analysis and two datasets were fused into a new matrix. Finally, the classification models were established by SVM. Compared with single spectroscopic technique, the mid-level data fusion strategy can provide better result. Especially, the accuracy of correct classification of samples in calibration and test sets were 100.00% and 98.68%, respectively. The results demonstrated that the mid-level data fusion of FT-IR and ICP–AES can provide higher synergic effect for the discrimination of different species Boletaceae mushrooms, which could be benefited for the further authentication and quality control of edible mushrooms.
Introduction
In China, mushrooms have been used for hundreds years as edible and medicinal resources, and the rate of mushroom consumption is relatively high.[Citation1,Citation2] Apart from characteristic taste, the fruiting bodies of mushrooms are considered as sources of organic nutrients including digestible proteins, carbohydrates, fibre, and certain vitamins, as well as minerals and antioxidants.[Citation3–Citation6] Yunnan Province is known as its abundant wild edible mushrooms resources. There are more than 880 species of edible mushrooms that have been identified in Yunnan Province, which occupied the 40% of the total number of edible species in the world.[Citation7] However, it is difficult to distinguish wild-grown edible mushrooms due to their various species and high similarities. In the marketplace, adulteration in slices of edible mushrooms has become a common phenomenon. Li et al.[Citation8] established a standard DNA barcode for edible boletes; samples of common boletes in the markets regarded as four “species” by merchants were collected. The results showed that these 4 “species” in fact represented 12 distinct species. Dentinger et al.[Citation9] used DNA sequencing to identify mushrooms within a commercial packet of dried Chinese boletes purchased in London. Surprisingly, they found three new species of boletes. Especially, some edible mushrooms are easy to confuse with toxic ones;[Citation10] so, an effective method for the discrimination of wild-grown edible mushrooms is quite necessary.
Except the traditional method of morphological observation, many techniques including Fourier transform infrared (FT-IR) spectroscopy,[Citation11] ultraviolet (UV) spectroscopy,[Citation12] near-infrared (NIR) spectroscopy,[Citation13] liquid chromatography–mass spectrometry,[Citation14] high performance liquid chromatography[Citation15], and inductively coupled plasma–mass spectrometry[Citation16] have been applied widely for qualitative and quantitative analysis of edible mushrooms. Comparatively, FT-IR can give a systematic description of the chemical components of specimens with simple, rapid, and cost-effective characteristics, and it is widely used in edible mushrooms analysis.[Citation17] Inductively coupled plasma atomic emission spectrometry (ICP–AES) is a sensitive and rapid technique for measuring multiple elements simultaneously which has been used in researching elements of fungi and food assessment.[Citation18]
The analysis of a dataset obtained from a single instrument may have some limitation to provide a comprehensive analysis. For instance, the results of previous researches showed that FT-IR has some limitation, such as it fails to confirm the major constituents and their contents.[Citation19] Data fusion based on complementary techniques is one of the most reliable, effective, and steadiest methods which can provide more accurate information about samples and obtain better results (classifications with less error rate and predictions with less uncertainty) than a single instrument,[Citation20] and it has been widely used in previous study. For example, Wang et al.[Citation21] used an approach based on NIR spectroscopy, ultraviolet–visible spectroscopy, and chemometric algorithms to discriminate five varieties of green tea successfully. Márquez et al.[Citation22] fused the synergistic effect of the information which obtained from Fourier transform Raman and NIR spectroscopy to solve the problem of hazelnut adulteration. Based on the fused data of different techniques with the aid of multivariate statistical analysis, these examples showed a great convenience and capability for the quality control of food. Therefore, the method of data fusion is a powerful tool for effectively improving the classification performance.
There are various strategies for data fusion: low-, mid-, and high-level data fusion. Low-level data fusion and mid-level data fusion were used frequently, in which mid-level data fusion is one of the most popular methods at present.[Citation20] In the previous study, low-level and mid-level data fusion have been used frequently in distinguishing and assessing the quality of food. For example, Silvestri et al.[Citation23] used low-level data fusion strategy for the sake of presenting the geographical variability of wines and obtained a good result. Dankowska[Citation24] gave a synergistic effect for the detection of cocoa butter adulteration with cocoa butter equivalents by using mid-level data fusion of fluorescence and UV spectroscopies. Sun et al.[Citation25] established a method by data fusion of NIR and mid-infrared spectra to distinguish unofficial rhubarbs, and the result indicated that the data fusion strategies could improve the classification accuracy.
In this work, the main goal is to establish an effective classification model for the discrimination of five species of Boletaceae mushrooms which are collected from Yunnan Province in China based on data fusion. FTIR spectroscopy and ICP–AES were used and these two techniques can provide different chemical information of samples which FTIR and ICP–AES were focused on functional groups and mineral element, respectively. Therefore, the data fusion of these two techniques will optimize the obtained information and exploit the synergies of individual information.
Materials and methods
Sample collection and initial preparation
A total of 230 fresh fruiting bodies of wild-grown Boletaceae mushrooms (Boletus speciosus, Leccinum rugosiceps, Boletus umbriniporus, Boletus tomentipes, Boletus edulis) were collected from Yunnan Province in southwestern China. The sample details are exhibited in . All of them have been authenticated by Dr. Honggao Liu from the College of Agronomy and Biotechnology, Yunnan Agricultural University, Kunming in China. Initially, the fresh samples were rinsed by soft brush and dried in a drying oven at 55°C for 24 h to constant weight and crushed with a high-speed blender (FW-100, Shanghai China) in the laboratory. Then, the sample powder was sifted through an 80-mesh stainless steel sieve. Finally, the powder of samples was preserved in Ziploc bags at dry and room temperature conditions for further analysis.
Table 1. Information of the mushroom samples.
Spectra acquisition and spectral data processing
To get FT-IR spectral data, the powder of each sample (1.0 ± 0.2 mg) was blended uniformly with potassium bromide (KBr) powder (100.0 ± 20.0 mg) and then milled in an agate mortar and pressed into a tablet for testing. After preheated for 30 min, every mushroom spectrum was performed by a FT-IR spectrometer (Perkin Elmer, USA) equipped with a deuterated triglycine sulfate detector. The scanning range was 4000–400 cm−1, and 16 scans per sample with resolution of 4 cm−1 were performed. Before the spectra data acquisition, the background spectrum was recorded, and CO2 and H2O in the atmosphere were subtracted automatically to eliminate interfering through scanning pure dried KBr tablet. During the whole experiment, the temperature of 25°C and relative humidity of 30% were constant. The samples were determined in triplicate and the results were expressed as mean values for further analysis.
As far as we know, FT-IR not only provide the useful chemical information but also contain a lot of interference information because of external factors, such as light scattering, background disturbance, and so on.[Citation26] Therefore, in order to reduce interference information, different preprocessing methods were used, such as second derivative (2D), Savitzky–Golay (SG) filter (15:1), and standardized normal variate (SNV). 2D is always applied to remove the overlap peaks and baseline shifts.[Citation27] SG filter is used to smooth the acquired data and helpful for a precise peak extraction.[Citation28] SNV can eliminate the noise signal which caused by light scattering effect of particles between different shapes and sizes.[Citation29] Then, the data of FT-IR spectra were used to establish discrimination model.
ICP–AES analysis
The mineral elements in Boletaceae mushroom samples were determined using ICP–AES (ICPE-9000, Shimadzu, Japan). First, 300 mg of each dried sample power was accurately weighed and put into the polytetrafluoroethylene (PTFE) pressure vessels which comprised 6 mL nitric acid solution (65% HNO3) and 2 mL deionized water. And then, the PTFE vessels were closed and the mixture was digested in an automatic microwave digestion system. Ethos One (Milestone, Italy) microwave closed system was used for digestion of samples. Finally, the digestion was filtrated and diluted to 25 mL using deionized water and subjected to instrumental analysis. Standard reference material (GBW07605, Tea leaves were produced by the Institute of Geophysical and Geochemical Exploration in Beijing, China) was used to verify precision and accuracy. During the experiment, ultrapure water was used for the preparation of solutions, and all test tubes and equipment were cleaned by soaking in HNO3 (10%) and then rinsed with H2O2 to prevent contamination. The content of mineral elements was used for the establishment of the classification model.
Data fusion and statistical analysis
In this paper, the main aim of data fusion is to find out if there are any potentiality in the existing data that could be useful for classification. The low-level and mid-level data fusion were used to build an effective discrimination model and then compare the classifying capacity of the two model. Low-level data fusion from different instruments was simply concatenated into a new matrix that contains a lot of variables.[Citation30] Mid-level data fusion also called feature level data fusion, it selected relevant variables that represented the information of samples from different data sources separately to constitute a new matrix.[Citation31] And then, the new matrix was used for further study.
For the low-level fusion data matrix, the preprocessed FT-IR data and mineral element content were simply concatenated. Before multivariate statistical analysis, the low-level fusion data matrix of FT-IR and ICP–AES was normalized. As far as we know, the problem of low-level data fusion is that the number of variables is much more than that of samples. Thereby, in order to finish the mid-level fusion data, the optimal latent variables which obtained from the information of each instrument were extracted. The most common approach to reduce data and select the most value latent variables is partial least square discriminant analysis (PLS-DA), because of its simplicity to use, speed, and relative good performance.[Citation31]
To establish the mathematical model, the fusion data matrices and individual instrument data matrices were integrated and inputted into the appropriate software for multivariate statistical analysis. Support vector machine (SVM) was a supervised pattern recognition method which can identify of unknown samples, and it has the ability to analyze highly collinear and noisy data.[Citation32] Recently, several researchers put emphasis on the classification of food and medicine by SVM. Such as, Bougrini et al.[Citation33] showed that an electronic nose and a voltammetric electronic tongue combined with SVM could be used as an effective method to detect adulteration in argan oil. Devos et al.[Citation34] used SVM method which based on spectral data to discriminate the olive oil from different regions, and the proposed method can be easily used. In this paper, a growing popularity method of SVM combined with data matrix of individual instrument and data fusion was applied for discrimination of five species of Boletaceae mushrooms. Compared the identification results, the best classification strategy was established.
The software were listed as follows: OMNIC (Version 8.2, Thermo Fisher Scientific Inc., USA) was used to analyze FT-IR spectra. SIMCA-P+ (Version 13.0, Umetrics, Umeå, Sweden) was used to extract latent variables by PLS-DA and calculated the preprocessing of FT-IR data, while SVM was carried out using MATLAB (version R2014a, MathWorks, USA).
Results and discussion
Chemical assignments of absorption bands in FT-IR spectra of Boletaceae mushrooms samples
The raw and preprocessed FT-IR spectra of different species wild-grown Boletaceae mushrooms are presented in . As a rapid and simple analytical technique, infrared spectroscopy has been used widely in mushrooms over the past years[Citation35], and chemical assignments of characteristic infrared absorption bands were described.[Citation36,Citation37] Remarkably, these spectra are similar in appearance and several spectral characteristics are observed. As we can see from , the peak at 3390 cm−1 is mainly attributed to the stretching vibration of O–H, which may be caused by water, triterpene, polysaccharide, and sterol. The peak at 2934 cm−1 shows a stretching vibration of the –CH3 group. Peaks at 1641 and 1554 cm−1 present C=O, C=N, and N–H, respectively, which may be the result of proteins. The O–H bending is presented at 1464 cm−1, and it belongs to polysaccharides. The absorption around 1082 and 1037 cm−1 are caused by stretches of C–O and C–C groups. Peaks in the region of 900–400 cm−1 mainly belong to polysaccharides, such as beta-d-glucan, the pyranose form of glucose, and so on. For the above reason, the characteristic absorption peaks belong to proteins, polysaccharides, and amino acids.
Figure 1. Raw FT-IR spectrum (a) and spectrum preprocessed by 2D + SNV + SG (15:1) (b) of different species wild-grown Boletaceae mushrooms.
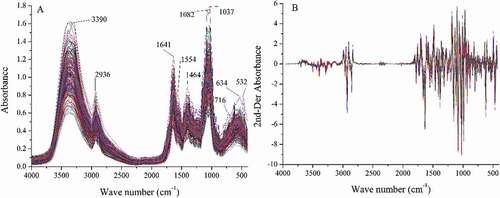
In this paper, various preprocessing methods were tried to optimize the data of FT-IR. Finally, 2D + SNV + SG (15:1) were used and the raw and preprocessed FT-IR spectra are shown in and , respectively. After preprocessed, it is obvious that the resolution of spectra have been promoted dramatically and the noise of spectra have been efficiently reduced. Therefore, 2D + SNV + SG (15:1) have attenuated the noise of spectra and increased the classification effect.
Elemental analysis by ICP–AES
As shown in , the content of 18 elements (Ba, Ca, Cd, Co, Cr, Cu, Fe, K, Li, Mg, Mn, Na, Ni, P, Rb, Sr, V, Zn) was determined by ICP–AES. The results have shown that K, P, and Mg are abundant element in all fruiting bodies. Especially, the average content of K is more than 5000 mg kg−1 and followed by P and Mg. The nutritional values of K, P, and Fe play an important role in human healthy, and their content can provide human daily requirement. However, when excess intake of heavy metals, potential hazards will be caused to human health.[Citation38] For example, high concentrations of the toxic Cd will lead to diseases on renal, pulmonary, hepatic, skeletal, and reproductive.[Citation39] Thereby, the element concentration is the gist of quality assessment for edible mushrooms.
Table 2. The results of mineral concentrations determined in five species mushrooms (mean ± SD, mg kg−1).
Feature extraction
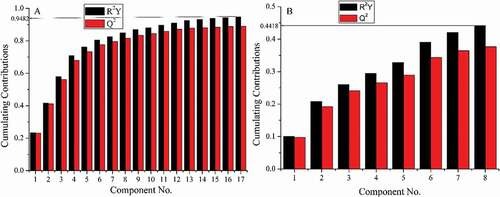
The feature extraction process is useful to reduce dimensionality and keep the relevant information when there are a lot of data volumes. In order to extract feature information for classification, PLS-DA was used to select the latent variables of FT-IR spectra and element concentration. The parameters R2Y and Q2 were used to evaluate the efficiency. The value of R2Y is higher which means the cumulating contributions are more. Meanwhile, it indicated that the cumulating contributions can represent the whole information of the samples. And, it suggested a good performance for predicting class membership when the value of Q2 reaches a maximum.[Citation40] As shown in , when the value of Q2 of FT-IR spectra and element concentration reach the maximum, the value of R2Y was 0.9482 and 0.4418, respectively. It could represent the best effect for predicting species of mushroom samples. Therefore, the first 17 latent variables of FT-IR spectra and the first 8 latent variables of element concentration were selected to establish the mid-level fusion data matrix.
Figure 2. Latent variables number and R2Y, Q2 values.
Classification results by SVM
In this study, data matrices of FT-IR spectra, element concentration, the low-level, and the mid-level data fusion strategies were applied to establish classification models. All of 230 samples were divided into 154 samples (two thirds of samples) as calibration set and 76 samples (one thirds of samples) as test set by Kennard–Stone algorithm.[Citation41] The accuracy of the calibration and test sets were calculated by SVM. And, the accuracy much closer to 100.00%, the performance of classification model will be more excellent. Finally, the best classification method was selected by comparing the results of individual technique and data fusion.
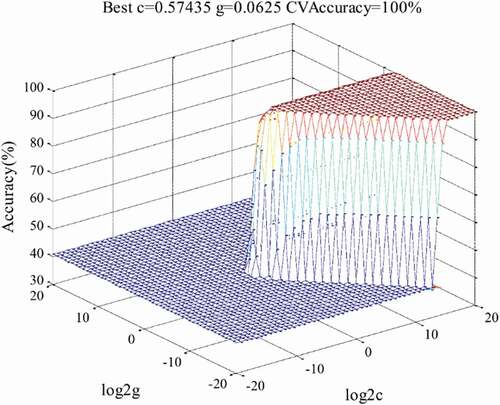
In order to constructs an optimal separating hyperplane, the original data were mapped into a higher dimensional feature space nonlinearly, which is important to choose SVM parameter.[Citation42] For grid-search method is easy to be understood, it’s widely used in optimization problems. In this paper, this method was used to select kernel parameter (g) and penalty parameter (c). The kernel parameter is closely related to the classification accuracy, and penalty parameter is the error term.[Citation43,Citation44] FT-IR spectra, element concentration, low-level fusion data, and mid-level fusion data matrices were calculated for the optimal SVM parameter by gird-search, respectively. As shown in , the result of the penalty parameter by mid-level data fusion strategy is 0.57435 which is much lower than other methods; it shows that mid-level data fusion strategy is suitable for SVM analysis. Moreover, the sevenfold cross-validation accuracy represents the performances of the established model and the accuracy of the calibration set. The cross-validation accuracy of four data matrices was 96.75%, 88.96%, 95.45%, and 100.00%, respectively. It shows that the stability of classification models by different techniques was good. Particularly, the mid-level data fusion strategy model is the most robust with the highest accuracy of cross-validation (100.00%). As can be seen in , it intuitively shows that the cross-validation accuracy is 100.00% and the optimal parameter c and g are 0.57435 and 0.0625, respectively. It seems that the model which was established by mid-level data fusion is more reliable than other strategies.
Table 3. The optimization results for parameters c and g by grid-search method.
Figure 3. The optimization results for parameters (c and g) and cross-calidation accuracy by grid-search method with mid-level data fusion strategy. A: FT-IR spectra; B: element concentrations.
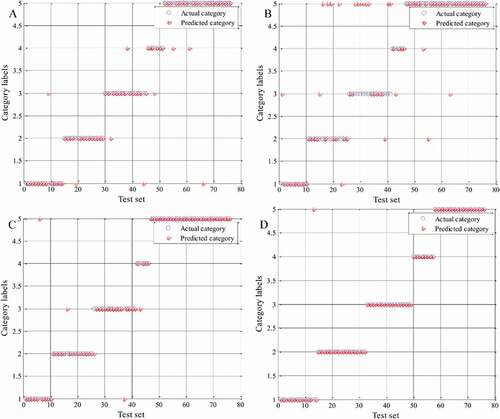
Furthermore, one of the most important standard to evaluate the classification model is the prediction accuracy of test set. In , the mushroom species A, B, C, D, and E are associated with the y class values 1, 2, 3, 4, and 5. The shows the SVM classification models; it showed that there were 9, 20, 4, and 1 samples which were erroneously judged by FT-IR spectra (), element concentration (), low-level data fusion (), and mid-level data fusion () strategies, respectively. As we can see in , about 70% samples were classified correctly. The result showed that the element concentration was relative to the mushroom species, which was same as the research by Yin et al.[Citation45] The model established by mid-level data fusion has the minimum discrimination error that only 1 B. speciosus sample was wrongly classified in B. edulis. For evaluating the classification model by single instrument and data fusion based on SVM, the identification results are listed in . The classification model established by low-level and mid-level fusion data was better than FT-IR spectra and element concentration; it indicated that data fusion strategy can obtain more chemical information for classification. The accuracy of test set from low-level data fusion and mid-level data fusion was 94.74% and 98.68%, respectively. It is clear that the two data fusion strategies could identify different species of mushroom samples effectively. However, combined with the accuracy of cross validation, the mid-level data fusion could provide more acceptable results for the classification from different species based on SVM. Especially, in this study, the data fusion strategy in combination with low-level and mid-level data fusion has already gotten satisfied results, so we did not make a further study of high-level data fusion.
Table 4. The results of SVM models on different data matrices.
Figure 4. The plot of actual and predicted category of test samples by support vector machine.
A: FT-IR spectra; B: element concentrations; C: low-level data fusion; D: mid-level data fusion.
Previous studies have indicated that the elevation would impact the content of chemical substances.[Citation46] Consequently, the geographical conditions and climatic characteristics can affect the results of identification. In present study, all samples are collected from different origins with complex surroundings and different years. The above factors may be the cause that the one sample was misclassified by mid-level data fusion. Thereby, the strategy of data fusions is a promising solution to overcome these difficulties for the quality control of edible mushrooms.
Conclusion
In this study, FT-IR and ICP–AES were used for discrimination of various species of Boletaceae mushrooms by individual and fused strategies. The pattern recognition method of SVM was applied to construct the discriminant models for identification of different species of edible mushrooms. Subsequently, the classification capacities of individual and data fusion strategies were compared. Obviously, the identification effect of data fusion strategy is better than individual instrument. It may be caused that data fusion can obtain more chemical information which is good for classification. In particular, the low-level and mid-level data fusion was were compared; the mid-level data fusion was proved as the better classification strategy with the classification accuracies of 100.00% and 98.68% in the calibration and test set by SVM, respectively. This results showed that low-level data fusion contained effective information and noise signal, but mid-level data fusion not only extracted useful features but also eliminated the unnecessary variables by PLS-DA. As a consequence, the study demonstrated that FT-IR coupled with ICP–AES is an effective and accurately method to discriminate the wild-grown Boletaceae mushrooms by mid-level data fusion based on SVM for quality control. Thus, it is a suitable method to evaluate the analogous food.
Additional information
Funding
References
- Zhang, M.; Cui, S. W.; Cheung, P. C. K.; Wang, Q. Antitumor Polysaccharides from Mushrooms: A Review on Their Isolation Process, Structural Characteristics and Antitumor Activity. Trends in Food Science & Technology 2007, 18(1), 4–19. DOI: 10.1016/j.tifs.2006.07.013.
- Zhang, D.; Frankowska, A.; Jarzyńska, G.; Kojta, A. K.; Drewnowska, M.; Wydmańska, D.; Bielawskil, L.; Wang, J. P.; Falandysz, J. Metals of King Bolete (Boletus Edulis) Bull.: Fr. Collected at the Same Site over Two Years. African Journal of Agricultural Research 2010, 5(22), 3050–3055.
- Nnorom, I. C.; Jarzyńska, G.; Falandysz, J.; Drewnowska, M.; Okoye, I.; Oji-Nnorom, C. G. Occurrence and Accumulation of Mercury in Two Species of Wild Grown Pleurotus Mushrooms from Southeastern Nigeria. Ecotoxicology and Environmental Safety 2012, 84, 78–83. DOI: 10.1016/j.ecoenv.2012.06.024.
- Pereira, E.; Barros, L.; Martins, A.; Ferreira, I. C. Towards Chemical and Nutritional Inventory of Portuguese Wild Edible Mushrooms in Different Habitats. Food Chemistry 2012, 130(2), 394–403. DOI: 10.1016/j.foodchem.2011.07.057.
- Szubstarska, J.; Jarzyńska, G.; Falandysz, J. Trace Elements in Variegated Bolete (Suillus Variegatus) Fungi. Chemical Papers 2012, 66(11), 1026–1031. DOI: 10.2478/s11696-012-0216-5.
- Wang, X. M.; Zhang, J.; Wu, L. H.; Zhao, Y. L.; Li, T.; Li, J. Q.; Wang, Y. Z.; Liu, H. G. A Mini-Review of Chemical Composition and Nutritional Value of Edible Wild-Grown Mushroom from China. Food Chemistry 2014, 151, 279–285. DOI: 10.1016/j.foodchem.2013.11.062.
- Wu, S. R.; Luo, X. L.; Liu, B.; Gui, M. Y. Analyse and Advise to Research and Development of Wild Edible Fungi. Food Science and Technology 2010, 35, 100–103.
- Li, Y. C.; Wu, G.; Yang, Z. L. DNA Barcoding of Edible Boletes (Boletaceae) from Yunnan, China. Plant Diversity and Resources 2013, 35, 725–732.
- Dentinger, B. T.; Suz, L. M. What’s for Dinner? Undescribed Species of Porcini in a Commercial Packet. PeerJ 2014, 2, e570. DOI: 10.7717/peerj.570.
- Lima, A. D. L.; Costa Fortes, R.; Carvalho Garbi Novaes, M. R.; Percário, S. Poisonous Mushrooms: A Review of the Most Common Intoxications. Nutricion Hospitalaria 2012, 27(2), 402–408.
- Bassbasi, M.; De Luca, M.; Ioele, G.; Oussama, A.; Ragno, G. Prediction of the Geographical Origin of Butters by Partial Least Square Discriminant Analysis (PLS-DA) Applied to Infrared Spectroscopy (FTIR) Data. Journal of Food Composition and Analysis 2014, 33(2), 210–215. DOI: 10.1016/j.jfca.2013.11.010.
- Li, Y.; Zhang, J.; Liu, H. G.; Jin, H.; Wang, Y. Z.; Li, T. Discrimination of Storage Periods for Macrocybe Gigantea (Massee) Pegler & Lodge Using UV Spectral Fingerprints. Czech Journal Food Sciences 2015, 33(5), 441–448. DOI: 10.17221/316/2014-CJFS.
- Shen, T. T.; Zou, X. B.; Shi, J. Y.; Li, Z. H.; Huang, X. W.; Xu, Y. W.; Chen, W. Determination Geographical Origin and Flavonoids Content of Goji Berry Using Near-Infrared Spectroscopy and Chemometrics. Food Analytical Methods 2016, 9(1), 68–79. DOI: 10.1007/s12161-015-0175-x.
- Dubost, N. J.; Beelman, R. B.; Peterson, D.; Royse, D. J. Identification and Quantification of Ergothioneine in Cultivated Mushrooms by Liquid Chromatography-Mass Spectroscopy. International Journal of Medicinal Mushrooms 2006, 8(3), 215–222. DOI: 10.1615/IntJMedMushr.v8.i3.
- Chen, Y.; Yan, Y.; Xie, M. Y.; Nie, S. P.; Liu, W.; Gong, X. F.; Wang, Y. X. Development of a Chromatographic Fingerprint for the Chloroform Extracts of Ganoderma Lucidum by HPLC and LC-MS. Journal of Pharmaceutical and Biomedical Analysis 2008, 47(3), 469–477. DOI: 10.1016/j.jpba.2008.01.039.
- Falandysz, J.; Drewnowska, M.; Chudzińska, M.; Barałkiewicz, D. Accumulation and Distribution of Metallic Elements and Metalloids in Edible Amanita Fulva Mushrooms. Ecotoxicology and Environmental Safety 2017, 137, 265–271. DOI: 10.1016/j.ecoenv.2016.12.014.
- Li, Y.; Zhang, J.; Zhao, Y. L.; Liu, H. G.; Wang, Y. Z.; Jin, H. Exploring Geographical Differentiation of the Hoelen Medicinal Mushroom, Wolfiporia Extensa (Agaricomycetes), Using Fourier-Transform Infrared Spectroscopy Combined with Multivariate Analysis. International Journal of Medicinal Mushrooms 2016, 18(8), 721–731. DOI: 10.1615/IntJMedMushrooms.v18.i8.
- Wang, X. M.; Liu, H. G.; Zhang, J.; Li, T.; Wang, Y. Z. Evaluation of Heavy Metal Concentrations of Edible Wild-Grown Mushrooms from China. Food Contaminants and Agricultural Wastes 2017, 52(3), 178–183. DOI: 10.1080/03601234.2017.1261545.
- Li, Y.; Zhang, J.; Li, T.; Liu, H. G.; Wang, Y. Z. A Comprehensive and Comparative Study of Wolfiporia Extensa Cultivation Regions by Fourier Transform Infrared Spectroscopy and Ultra-Fast Liquid Chromatography. PLoS One 2016, 11(12), e0168998. DOI: 10.1371/journal.pone.0168998.
- Borràs, E.; Ferré, J.; Boqué, R.; Mestres, M.; Aceña, L.; Busto, O. Data Fusion Methodologies for Food and Beverage Authentication and Quality assessment-A Review. Analytica Chimimca Acta 2015, 891, 1–14. DOI: 10.1016/j.aca.2015.04.042.
- Wang, X.; Huang, J.; Fan, W.; Lu, H. Identification of Green Tea Varieties and Fast Quantification of Total Polyphenols by Near-Infrared Spectroscopy and Ultraviolet-Visible Spectroscopy with Chemometric Algorithms. Analytical Methods 2015, 7(2), 787–792. DOI: 10.1039/C4AY02106A.
- Márquez, C.; López, M. I.; Ruisánchez, I.; Callao, M. P. FT-Raman and NIR Spectroscopy Data Fusion Strategy for Multivariate Qualitative Analysis of Food Fraud. Talanta 2016, 161, 80–86. DOI: 10.1016/j.talanta.2016.08.003.
- Silvestri, M.; Bertacchini, L.; Durante, C.; Marchetti, A.; Salvatore, E.; Cocchi, M. Application of Data Fusion Techniques to Direct Geographical Traceability Indicators. Analytica Chimica Acta 2013, 769, 1–9. DOI: 10.1016/j.aca.2013.01.024.
- Dankowska, A. Data Fusion of Fluorescence and UV Spectroscopies Improves the Detection of Cocoa Butter Adulteration. European Journal of Lipid Science and Technology 2017, 118, 1600268. DOI: 10.1002/ejlt.201600268.
- Sun, W.; Zhang, X.; Zhang, Z.; Zhu, R. Data Fusion of Near-Infrared and Mid-Infrared Spectra for Identification of Rhubarb. Spectrochimica Acta Part A-Molecular and Biomolecular Spectroscopy 2017, 171, 72–79. DOI: 10.1016/j.saa.2016.07.039.
- Sun, X.; Zhang, H.; Gong, Z.; Ouyang, A.; Zhou, J.; Liu, Y. Spectral Pretreatment and Wavelength Selection for Soluble Solids Content in Gannan Navel Orange. Sensor Letters 2010, 8(1), 140–144. DOI: 10.1166/sl.2010.1216.
- Roy, I. G. On Computing First and Second Order Derivative Spectra. Journal of Computational Physics 2015, 295, 307–321. DOI: 10.1016/j.jcp.2015.04.015.
- Everard, C. D.; Kim, M. S.; O’Donnell, C. P. Distinguishing Bovine Fecal Matter on Spinach Leaves Using Field Spectroscopy. Applied Sciences 2016, 6(9), 246. DOI: 10.3390/app6090246.
- Vera, L.; Aceña, L.; Boqué, R.; Guasch, J.; Mestres, M.; Busto, O. Application of an Electronic Tongue Based on FT-MIR to Emulate the Gustative Mouthfeel “Tannin Amount” in Red Wines. Analytical and Bioanalytical Chemistry 2010, 397(7), 3043–3049. DOI: 10.1007/s00216-010-3852-z.
- Pizarro, C.; Rodríguez-Tecedor, S.; Pérez-del-Notario, N.; Esteban-Díez, I.; González-Sáiz, J. M. Classification of Spanish Extra Virgin Olive Oils by Data Fusion of Visible Spectroscopic Fingerprints and Chemical Descriptors. Food Chemistry 2013, 138(2), 915–922. DOI: 10.1016/j.foodchem.2012.11.087.
- Biancolillo, A.; Bucci, R.; Magrì, A. L.; Magrì, A. D.; Marini, F. Data-Fusion for Multiplatform Characterization of an Italian Craft Beer Aimed at Its Authentication. Analytica Chimica Acta 2014, 820, 23–31. DOI: 10.1016/j.aca.2014.02.024.
- Haddi, Z.; Alami, H.; El Bari, N.; Tounsi, M.; Barhoumi, H.; Maaref, A.; Jaffrezic-Renault, N.; Bouchikhi, B. Electronic Nose and Tongue Combination for Improved Classification of Moroccan Virgin Olive Oil Profiles. Food Research International 2013, 54(2), 1488–1498. DOI: 10.1016/j.foodres.2013.09.036.
- Bougrini, M.; Tahri, K.; Haddi, Z.; Saidi, T.; El Bari, N.; Bouchikhi, B. Detection of Adulteration in Argan Oil by Using an Electronic Nose and a Voltammetric Electronic Tongue. Journal of Sensors 2014, 2014, 245831. DOI: 10.1155/2014/245831.
- Devos, O.; Downey, G.; Duponchel, L. Simultaneous Data Pre-Processing and SVM Classification Model Selection Based on a Parallel Genetic Algorithm Applied to Spectroscopic Data of Olive Oils. Food Chemistry 2014, 148, 124–130. DOI: 10.1016/j.foodchem.2013.10.020.
- Choong, Y. K.; Lan, J.; Lee, H. L.; Chen, X. D.; Wang, X. G.; Yang, Y. P. Differential Identification of Mushrooms Sclerotia by IR Macro-Fingerprint Method. Spectrochimica Acta Part A-Molecular and Biomolecular Spectroscopy 2016, 152, 34–42. DOI: 10.1016/j.saa.2015.07.054.
- Choong, Y. K.; Xu, C. H.; Lan, J.; Chen, X. D.; Jamal, J. A. Identification of Geographical Origin of Lignosus Samples Using Fourier Transform Infrared and Two-Dimensional Infrared Correlation Spectroscopy. Journal of Molecular Structure 2014, 1069, 188–195. DOI: 10.1016/j.molstruc.2014.04.001.
- O’Gorman, A.; Downey, G.; Gowen, A. A.; Barry-Ryan, C.; Frias, J. M. Use of Fourier Transform Infrared Spectroscopy and Chemometric Data Analysis to Evaluate Damage and Age in Mushrooms (Agaricus Bisporus) Grown in Ireland. Journal of Agriculture and Food Chemistry 2010, 58(13), 7770–7776. DOI: 10.1021/jf101123a.
- Sarikurkcu, C.; Tepe, B.; Solak, M. H.; Cetinkaya, S. Metal Concentrations of Wild Edible Mushrooms from Turkey. Ecology of Food and Nutrition 2012, 51(4), 346–363. DOI: 10.1080/03670244.2012.674448.
- Chen, X. H.; Zhou, H. B.; Qiu, G. Z. Analysis of Several Heavy Metals in Wild Edible Mushrooms from Regions of China. Bulletin of Environmental Contamination and Toxicology 2009, 83(2), 280–285. DOI: 10.1007/s00128-009-9767-8.
- Mickiewicz, B.; Heard, B. J.; Chau, J. K.; Chung, M.; Hart, D. A.; Shrive, N. G.; Frank, C. B.; Vogel, H. J. Metabolic Profiling of Synovial Fluid in a Unilateral Ovine Model of Anterior Cruciate Ligament Reconstruction of the Knee Suggests Biomarkers for Early Osteoarthritis. Journal of Orthopaedic Surgery and Research 2015, 33(1), 71–77. DOI: 10.1002/jor.22743.
- Saptoro, A.; Tadé, M. O.; Vuthaluru, H. A Modified Kennard-Stone Algorithm for Optimal Division of Data for Developing Artificial Neural Network Models. Chemical Product and Process Modeling 2012, 7(1), 1–14. DOI: 10.1515/1934-2659.1645.
- Cherkassky, V.; Ma, Y. Practical Selection of SVM Parameters and Noise Estimation for SVM Regression. Neural Networks 2004, 17(1), 113–126. DOI: 10.1016/S0893-6080(03)00169-2.
- Hsu, C. W.; Chang, C. C.; Lin, C. J.; A Practical Guide to Support Vector Classification. Tech. rep., Department of Computer Science, National Taiwan University. 2003.
- Huang, C. L.; Wang, C. J. A GA-based Feature Selection and Parameters Optimizationfor Support Vector Machines. Expert Systems with Applications 2006, 31(2), 231–240. DOI: 10.1016/j.eswa.2005.09.024.
- Yin, L. L.; Shi, G. Q.; Tian, Q.; Shen, T.; Ji, Y. Q.; Zeng, G. Determination of the Metals by ICP-MS in Wild Mushrooms from Yunnan, China. Journal of Food Science 2012, 77(8), T151–T155. DOI: 10.1111/j.1750-3841.2012.02810.x.
- Barbosa, R. M.; De Paula, E. S.; Paulelli, A. C.; Moore, A. F.; Souza, J. M. O.; Batista, B. L.; Campiglia, A. D.; Barbosa, F. Recognition of Organic Rice Samples Based on Trace Elements and Support Vector Machines. Journal of Food Composition and Analysis 2016, 45, 95–100. DOI: 10.1016/j.jfca.2015.09.010.