
 ?Mathematical formulae have been encoded as MathML and are displayed in this HTML version using MathJax in order to improve their display. Uncheck the box to turn MathJax off. This feature requires Javascript. Click on a formula to zoom.
ABSTRACT
In this study, cumin protein isolates (CPI) and major protein fractions were extracted and separated from cumin seeds, their structure, physicochemical, and functional properties were investigated. Albumin (62.29%) and glutelin (25.16%) were the predominant protein fractions of cumin seeds. Glutamic acid (Glu) and aspartic acid (Asp) were the major amino acids of cumin proteins, whereas more hydrophobic and aromatic amino acids were predominantly found in chickpea protein isolates. Electrophoresis profiles indicated that CPI have more disulphide bonds than major protein fractions. The intrinsic fluorescence data revealed that glutelin displayed greater exposure of tyrosine (Tyr) and tryptophan (Trp) residues compared to albumin and CPI. Circular dichroism (CD) data showed CPI presented more α-helix (14.4%) and less β-strand (30.7%) than albumin and glutelin. The atomic force microscope (AFM) profile and hydrodynamic diameter (Dh) determination showed the presence of low particle size in albumin fractions. Differences in the hydrophobicity (Ho) and the zeta-potential (ζ) of CPI, albumin, and glutelin were also observed due to their difference in structure and amino acid composition. Compared with CPI and glutelin, albumin exhibited the highest emulsifying activity (103.67 m2/g) and stability (42.84 min) and the smallest emulsion particle size (4.29 μm). The CPI, albumin and glutelin presented typical U-shaped protein solubility–pH curves, with the lowest solubility at pH 4.0. Rheological investigation demonstrated that CPIs were efficient in forming a gel at 80.6°C, whereas glutelin could form the hardest gel at 92.6°C. The overall results suggested that the cumin proteins can be a promising protein source for the food industry.
Introduction
Protein is a major nutritional source for human and animals. Plant proteins are widely studied and used in the food industry, such as soybean protein[Citation1,Citation2], chickpea protein[Citation3], kidney bean protein[Citation4], and peanut protein.[Citation5] Commonly, plant proteins are divided into four categories – albumin, globulin, prolamin, and glutelin – according to their solubility in different solvents, such as water, salt, alcohol, and alkali solution.[Citation6] Different ratios of those four categories are found in various plants. Soybean and chickpea are rich in albumin (75% and 71.4%)[Citation7,Citation8], whereas tomato seed is rich in globulin (61%). In hemp seed, globulin has higher contents in aromatic and hydrophobic residues and more disulphide bonds than albumin, but the solubility and foaming capacity of albumin are higher than those of globulin.[Citation9] The protein fractions from pumpkin seed showed significantly different solubility and emulsifying activity.[Citation10] The uncharged polar amino acids in albumin of buckwheat are higher than in globulin, but lower in total acidic amino acids.[Citation11]
Cumin (Cuminum cyminum) is an annual plant belonging to the Umbellifereae family, which originated from the Mediterranean region, and is a traditional spice in Asia, Africa, and Europe, and now is predominantly cultivated in India, China, Iran, and Turkey.[Citation12,Citation13] Cumin plays an important role in the food and pharmaceutical industries for its aromatic and therapeutic properties[Citation14,Citation15], such as flavouring, sterilizing, pest-resistance, and antioxidant activities.[Citation16–Citation20] Cumin is mainly processed into cumin essential oil or oleoresin in the food industry, thereby producing a large amount of by-products that constitute over 70% weight of the processed cumin seeds, which is rich in protein (28.33%).[Citation12] Cumin proteins contain a wide range of amino acids[Citation13], and no significant change in amino acid composition is observed during different storage times.[Citation21] On the protein model database (PMDB), cumin proteins included 665 sequences, and three kinds of 3D models sorted by target sequence coverage were recorded.[Citation22]After hydrolysis of the cumin protein, three peptides are identified to be responsible for the α-amylase inhibitory and antioxidant activities of cumin protein.[Citation23,Citation24] However, only few reports about the cumin protein fractions composition as well as their structural, physicochemical, and functional properties could be found in the literature.
The aim of this study was to characterize CPI/cumin protein fractions and their amino acid compositions and to investigate their major physicochemical and functional properties to evaluate the potential of cumin protein application in the food industry.
Materials and methods
Materials
The cumin seeds were obtained from Dunhuang Seed Co., Ltd. (Gansu, China). The protein ladder marker of molecular weight (MW) ranging from 10 to 170 kDa was purchased from Thermo (Thermo Fisher Scientific, Inc., Lithuania), and 1-anilinonaphthalene-8-sulphonate (ANS) was supplied from Sigma (St. Louis, MO, USA). All other reagents used were of analytical or chromatographic grade.
Preparation of defatted cumin seed powder (DCSP)
Cumin seeds were ground into powder, passed through a 30-mesh sieve, defatted with hexane at a sample to solvent ratio of 1:10 (w/v) for 2 h, and centrifuged at 5, 000 g for 15 min at room temperature, and the residue was used for further extraction. The defatting procedure was repeated twice, and the DCSP was air-dried for 24 h at room temperature and then stored at 4°C for protein extraction.
Preparation of cumin protein isolates
The DCSP was dispersed in distilled water, with a pH value adjusted to 9.0 with 1.0 M NaOH solution, and extracted for 1 h at room temperature under continuous stirring. Subsequently, a centrifugation at 10, 000 g for 30 min was applied. The procedure was repeated twice. The supernatants were collected and isoelectrically precipitated with 1 M HCl and kept at 4°C overnight. The precipitate was recovered by centrifugation at 5, 000 g for 15 min, washed twice with distilled water, with the pH value adjusted to 7.0 with 1 M NaOH, and then dialyzed against distilled water for 48 h and freeze-dried. All the freeze-dried proteins were stored at –18°C until analysed. Protein content of CPI was 88.04% (w/w, dry basis) as determined by the Kjeldahl method (N × 6.25).
Extraction of cumin protein fractions
Protein fractions from cumin seed were extracted as described by Du et al.[Citation25] Defatted cumin powder (20 g) was extracted twice with distilled water (200 mL) for 2 h at room temperature. The slurry was centrifuged at 10, 000 g for 30 min; the supernatant was then collected and used for determination of the albumin extract. The residue was extracted successively with 1.0 M NaCl solution, 70% ethanol solution, and 0.1 M NaOH solution in the same conditions in order to obtain successively the globulin, prolamin. and glutelin fractions, and each extraction step was repeated twice. The supernatant protein content was determined by a modified version of the Lowry method.[Citation26] The supernatants of albumin, globulin, and glutelin fractions were precipitated at a pH value of 4.0 with 1 M HCl, kept at 4°C overnight, and then centrifuged at 5, 000 g for 15 min at 4°C. The precipitates were washed twice with distilled water at a ratio of 1/2 (w/v), and the pH value was adjusted to 7.0 with 1 M NaOH; they were then dialyzed against distilled water for 48 h and freeze-dried. The prolamin fraction extract was directly dialyzed against distilled water for 48 h and then lyophilized. The protein contents, determined by the Kjeldahl method (N × 6.25), of albumin, glutelin, and globulin powders were 83.15%, 80.20%, and 67.96%, respectively.
Sodium dodecyl sulfate polyacrylamide gel electrophoresis (SDS-PAGE)
The SDS-PAGE analyses of CPI and major fractions were carried out according to Laemmli’s (Citation1970) method[Citation27] with 12.5% separating gel and 5% stacking gel. Protein samples were mixed with a sample dissolving buffer (0.05 M of Tris–HCl, 1% SDS, 12% sucrose, 0.025% bromophenol blue, and 1% β-mercaptoethanol (β-ME) for the reducing sample) to reach a concentration of 4 mg/mL. Before loading, the samples with β-ME were heated in boiling water for 2 min, and then 10 μL of the protein samples were loaded in the corresponding well. Electrophoresis was carried out using an AE-6450 apparatus (Atto, Japan) at a constant current of 30 mA for about 2 h. After electrophoresis, the gels were stained for 3 h in a methanol/acetic acid/water solution (5:1:4, v/v/v) with 0.25% of Coomassie blue (R-250), then de-stained by methanol/acetic acid/water solution (4:1:5, v/v/v) for 6 h. The gels’ images were taken, and then analysed by Alpha Ease FC image analyser (LAS-3000, Fujifilm, Tokyo, Japan).
Amino acid composition
First, 50 mg of protein was placed in a 20 mL ampoule and mixed with 10 mL of 6 M HCl. The vacuumed and sealed samples were hydrolysed at 110°C for 24 h in an air oven. The hydrolysates were cooled, filtered, and diluted to 100 mL. Next, 5 mL of the solution was evaporated in a flow of nitrogen. The dried samples were dissolved in 1 mL of sodium citrate buffer (pH 2.2) and loaded on a Hitachi L-8900 amino acid analyser (Tokyo, Japan) for amino acid analysis.
Circular dichroism (CD) spectroscopy
Protein CD spectra were obtained using an MOS-500 spectropolarimeter (Biologic science instrument, France) with wavelength range from 190 to 240 nm for secondary structure determination. The CD spectrum measurements were performed in a quartz cuvette of 0.1 mm at a protein concentration of 0.1 mg/mL in phosphate buffer (10 mM, pH 7.0). The measurement parameters were as follows: step resolution, 2 nm; acquisition duration, 1 s; bandwidth, 1.0 nm; and sensitivity, 100 mdeg. All of the spectra were an average of three scans with the subtraction of phosphate buffer without protein. All of the data were analysed using the CONTIN program of DOCROWEB website, and 43 kinds of soluble proteins were used as the reference set.[Citation28]
Intrinsic emission fluorescence spectra
According to the method of Malomo and Aluko (Citation2015)[Citation9] with some modification, intrinsic emission fluorescence spectra of CPI and major fractions were determined. Proteins were dissolved in 10 mM of phosphate buffer (pH 7.0) to reach a concentration of 0.1 mg/mL. The fluorescence spectrum was recorded from 280 to 450 nm at an excitation wavelength of 275 nm, corresponding to tyrosine (Tyr) and tryptophan (Trp). The constant slit of excitation and emission was 5 nm. The emission of phosphate buffer was subtracted for all fluorescence spectra.
Atomic force microscope (AFM)
The nanostructure morphology of protein was evaluated with an AFM in tapping mode (NX10, Park Co., Ltd, Korea). Distilled water was used to prepare 10 μg/mL protein solutions. Aliquots (10 μL) were applied to the surface of freshly cleaved mica slice and dried in air for 30 min at room temperature; the slice was then bound to a magnetic stainless steel disk and scanned by the tip. About three images were acquired at least for each sample.
Hydrodynamic diameter (Dh)
The apparent Dh was determined according to the method of Peng et al. (2016)[Citation29] with some modifications. The protein samples were diluted to 2 mg/mL with phosphate buffer (10 mM, pH 7.0) and passed through a 0.45 μm Millipore filter. The experiment was carried out with 1 × 1 cm cuvettes at a fixed angle of 173° by a Zetasizer Nano ZS (Malvern Instruments Ltd., UK) at 25°C. The refractive index and appropriate viscosity parameters were set.
Surface hydrophobicity (Ho)
The Ho was determined according to the method of Kato and Nakai (Citation1980)[Citation30] with an ANS fluorescence probe. Protein solutions (1 mg/mL) were prepared with 10 mM of phosphate buffer (pH 7.0). The protein dispersions were diluted to a final concentration of 20–200 μg/mL with phosphate buffer. Then, 20 μL of ANS solution (8.0 mM in phosphate buffer) was added to 4 mL of each protein dilution. The fluorescence intensity (FI) of the mixtures was measured using an F2500 fluorescence spectrophotometer (Hitachi Co., Japan) with a constant slit of 2 nm excitation at 390 nm and emission at 470 nm with a 5 nm slit. The FI for each protein concentration with a probe was determined by subtracting the FI of each solution without the probe in phosphate buffer (pH 7.0). The Ho value was determined as the initial slope of the FI versus protein concentrations.
Zeta potential (ζ)
The ζ of protein was measured using a Zetasizer Nano ZS (Malvern Instrument Ltd., UK) according to the method of Yin et al. (2011).[Citation31] The protein stock solution (10 mg/L) was diluted to 2 mg/mL with phosphate buffer (10 mM, pH 7.0) and filtered through a 0.45 μm Millipore membrane. The dispersion was equilibrated for 60 s before analysis, and then scanned 50 times for each record.
Protein solubility
Solubility of proteins was determined according to the method of Jarpa-Parra et al. (2014)[Citation32] with some modifications. Samples were dissolved in 10 mL of distilled water to reach a concentration of 1% (w/v), and the pH was adjusted to 2.0, 3.0, 4.0, 5.0, 6.0, 7.0, 8.0, 9.0, and 10.0 with 1.0 M HCl or 1.0 M NaOH solution. After a magnetic stirring for 60 min, the samples were centrifuged at 10, 000 g for 10 min. The protein content of the supernatant was determined by modified Lowry’s method[Citation26], using bovine serum albumin as the standard. The solubility of the protein was expressed as the percentage of soluble protein to total protein of the sample in suspension.
Emulsifying properties
Emulsifying activity index (EAI) and emulsifying stability index (ESI)
EAI and ESI were determined according to the method of Yin et al. (2008)[Citation33] with some modifications. Proteins were dissolved in 10 mM of phosphate buffer (pH 7.0) to a concentration of 0.1% (w/v). Emulsions were prepared by homogenizing 9 mL of protein solution and 3 mL of corn oil for 60 s at a speed of 22,000 rpm using a high-speed homogenizer (I25, IKN Co., Shanghai, China). An aliquot of 20 μL of the freshly prepared emulsion was removed from the bottom of the test tube, diluted in 5 mL of 0.1% SDS solution, and then blended. The absorbance of the dispersion was determined at 500 nm directly and after 10 min. The EAI and ESI were calculated according to the following equations:
where c is the initial protein concentration of the protein solution (g/mL), l is the optical path (1 cm), φ is the oil volume fraction used to form the emulsion, D is the dilution factor, t is the time before the measurement, and A0 and A10 are the absorbance of the diluted emulsions at 0 and 10 min, respectively.
Optical microscopy
Freshly prepared homogenous emulsions were placed carefully between a microscope slide and a coverslip to ensure the absence of air gap or bubbles between the sample and the coverslip. The microstructures of cumin protein major fractions and CPI were observed by an optical microscope (CX41, Olympus Corporation, Tokyo, Japan). The images of the emulsions were captured using a CCD camera (EOS 750D, Canon, Japan) with a magnification of 20 (objective) × 10 (eyepiece).
Measurements of emulsion droplet size and distribution
The droplet size and particle distribution of the emulsions were determined by a laser particle size analyser (Bettersizer 2000, Dandong Baite Instrument Co., Ltd., Dandong, Liaoning, China). The relative refractive index of the emulsion was taken as 1.107, corresponding to the ratio of the refractive indices of corn oil and the phosphate buffer (1.472 and 1.33, respectively). The emulsions were diluted 20 times with 1.0% (w/v) SDS solution before the determinations. The volume-weighted mean diameter (d4,3) was measured as the droplet size.
Dynamic rheological properties
The dynamic rheological properties of cumin proteins were analysed by Anton Paar rheometer (Physica MCR 301, Austria) with a temperature-controlled Peltier system (HePTD 200). The proteins were dispersed in 10 mM of phosphate buffer solution (pH 7) to a concentration of 10% (w/v), stirred for 2 h, allowed to equilibrate overnight at 4°C, and magnetically stirred again for 30 min before analysis. The storage modulus (G′) and loss modulus (G″) of the proteins were determined by a parallel 50-mm-diameter plate (PP50) with a gap of 1 mm. Protein solutions (2.3 mL) were loaded, and light silicon oil was applied to reduce the evaporation. Temperature sweeps of protein dispersions were measured at 0.1% strain and 1 Hz frequency within the linear viscoelastic region. The protein dispersions were heated from 25°C to 95°C at the rate of 2°C/min, held at 95°C for 30 min, and finally cooled down to 25°C at the same rate. According to this performance, the gel temperature (Tgel), corresponding to the temperature when G″ is higher than G′, was evaluated. All the measurements were performed in duplicate.
Statistical analysis
All experiments were carried out in triplicate or duplicate. Results were expressed as mean ± standard deviation (SD). The statistical significance (p < 0.05) of the data was determined by analysis of variance (ANOVA) and Duncan’s multiple range tests using SPSS software for Windows (Version 18.0, SPSS Inc., Chicago, IL, USA).
Result and discussion
Protein fractions composition
The proteins in DCSP were fractionated based on their solubility in different solvents. Albumin was dominant, accounting for 62.29%, followed by glutelin, globulin, and prolamin, accounting for 25.16%, 11.12%, and 1.43%, respectively. Albumin also forms the predominant fraction of cowpea protein (71.4%)[Citation8], tartary buckwheat (43.7%)[Citation34], and A. trifoliata var. australis seed (51.6%)[Citation25], whereas globulin is the major fraction in tomato seed (61.0%)[Citation35] and hyacinth bean seed (55%).[Citation36] Moreover, albumin and glutelin were the main fractions in cumin seed, accounting for almost 90%, which is similar to soybean protein (albumin 75%, glutelin 21.5%)[Citation8] and A. trifoliata var. australis seed (albumin 51.65%, glutelin 46.40%).[Citation23]
SDS-PAGE
The compositions of protein fractions and CPI were analysed by SDS-PAGE with or without β-ME (). As shown in , under non-reducing condition, CPI had seven major protein subunits with MWs of about 51.9, 45.9, 35.2, 23.6, 20.4, 14.6, and 13.2 kDa (, lane 1), and the bands of protein subunits found at 51.9 and 45.9 kDa were darker than the others. Albumin displayed five major distinct bands at about 51.9, 45.9, 35.2, 20.4, and 13.2 kDa, with the most concentrated bands at 35.2, 20.4, and 13.2 kDa (, lane 2), among which the 13.2 kDa band might correspond to 2S albumin.[Citation13]The globulin exhibited a distinct band at 45.9 kDa and some minor bands at 51.9, 35.2, 20.4, and 16.1 kDa (, lane 3). Glutelin only shows one minor band at 20.4 kDa (, lane 4), which might be due to alkali-soluble protein with a specific structure. Indeed, similar results were found for glutelin of A. trifoliata var. australis by Du et al. (2012). [Citation25]
Figure 1. SDS-PAGE patterns of CPI and cumin protein fractions. M, marker standard; A, under non-reducing condition (without β-mercaptoethanol) for CPI (lane 1), albumin (lane 2), globulin (lane 3), and glutelin (lane 4); B, under reducing condition (with β-mercaptoethanol) for CPI (lane 5), albumin (lane 6), globulin (lane 7), and glutelin (lane 8).
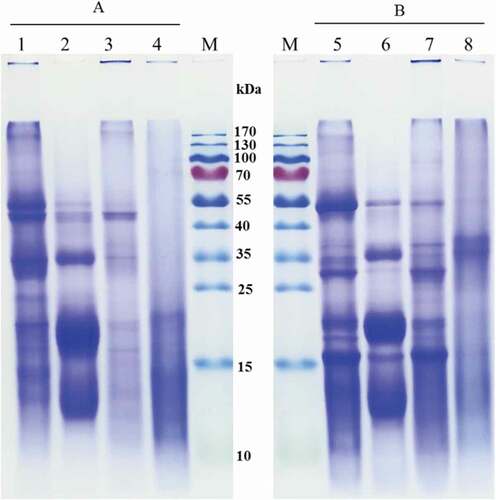
When β-ME was added, the band at 45.9 kDa of CPI, albumin, and globulin disappeared, meaning that the protein band with high MW was stabilized by disulphide bonds. Four intense bands at 51.9, 29.8, 20.4, and 16.1 kDa, which correspond to the major polypeptides of the CPI (, lane 1), and minor bands at 37.0, 35.2, 17.9, and 13.2 kDa were also observed. Albumin showed two new bands at 29.8 and 16.1 kDa (, lane 2), but major polypeptides were still found at 35.2, 20.4, and 13.2 kDa. Addition of β-ME significantly affected the polypeptide profile of globulin in the presence of three intense bands with estimated sizes of 51.9, 29.8, and 16.1 kDa and three minor bands at 37.0, 35.2, and 20.4 kDa (, lane 4). The protein bands of 16.1 and 20.4 kDa might correspond to acidic subunits of 11S globulin.[Citation13] The appearance of new bands at 29.8 and 16.1 kDa (, lanes 1, 2, and 3) might come from the conversion of the protein presenting the 45.9 kDa band through the dissociation of disulphide bonds. On the one hand, glutelin exhibited only one band at about 37.0 kDa (, lane 4). On the other hand, the prolamin of cumin seed did not exhibit any bands in SDS-PAGE with or without β-ME (data not shown), which is in accordance with the data found for grape (Vitis vinifera L.) seed endosperm prolamin.[Citation37]
Amino acid composition
The amino acid compositions of CPI and major protein fractions are shown in . Glu and Asp were the most abundant amino acids in CPI and cumin protein fractions, which is similar to pea protein[Citation38] and African yam bean protein.[Citation39] Glu and Asp content in CPI were 18.98% and 10.74%, respectively, which is in agreement with the report of Badr and Georgiev (Citation1990).[Citation21] CPI presented the highest content in sulphuric amino acids, especially more cysteine (Cys) than in albumin and glutelin, which might demonstrate that more S–S bonds or SH- groups were present in CPI and in globulin than in albumin. The contents in hydrophobic and aromatic amino acids were higher in CPI (32.95% and 8.33%, respectively) when compared to albumin (31.01% and 8.15%, respectively) and glutelin (25.20% and 6.99%, respectively), which could be attributed to the interactions of inter- and intra-polypeptides. In addition, all the cumin proteins were relatively rich in essential amino acids; hence, the ratios of essential amino acids to total amino acids (EAA/TAA) of CPI and globulin were 37.68% and 38.61%, respectively, whereas the ratios of essential amino acid to non-essential amino acids (EAA/NTAA) of CPI and globulin were both over 60%, which was close to the FAO/WHO (Citation1991)[Citation40]-recommended protein model. Lysine (Lys) was considered as the limiting amino acid in CPI and major fractions as its content did not reach the recommended needs.
Table 1. Amino acid compositions of cumin protein isolate (CPI) and cumin protein fractions (g/100g protein).
Secondary structure
In the wavelength range of 190–260 nm, the α-helix and β-strand present a dichroic activity.[Citation41] In general, the CD spectrum of α-helix presents a strong positive band from 191 to 193 nm and a typical double minimum band from 208 to 210 nm and at 222 nm, whereas that of the β-sheet has a fairly intense positive band from 195 to 200 nm and a negative band from about 216 to 218 nm.[Citation42]
In the far-UV CD spectra (), the magnitude of the α-helix negative (208–219 nm) and positive (191 nm) bands of CPI was stronger than that of albumin and glutelin. The CD spectrum of albumin in the far-UV region (190–240 nm) showed a positive peak around 194 nm and a negative band from 210 to 221 nm, which was consistent with the hemp seed albumin data.[Citation9] The secondary structure composition for CPI was 14.4% α-helix, 30.9% β-strand, 20.3% turns, and 34.4% unordered (), which constitutes a higher content of α-helix and a lower content of β-strand than albumin (8.5% and 34.2%, respectively) and glutelin (8.3% and 34.3%, respectively). These results differed from the work of Tang and Wang (Citation2010)[Citation11], who reported that buckwheat albumin showed higher α-helix than buckwheat globulin and protein isolate. Greater proportions of β-conformation compared to α-helix were observed in the three fractions of proteins, and similar results were found in kidney bean protein, albumin, globulin, and protein isolates from soapnut seeds and other plant seeds.[Citation4,Citation31]
Figure 2. Far-UV CD (190–240 nm) spectra (A) and intrinsic fluorescence spectra (B) of CPI, albumin, and glutelin in 10 mM phosphate buffer (pH 7.0) at a concentration of 0.1 mg/mL.
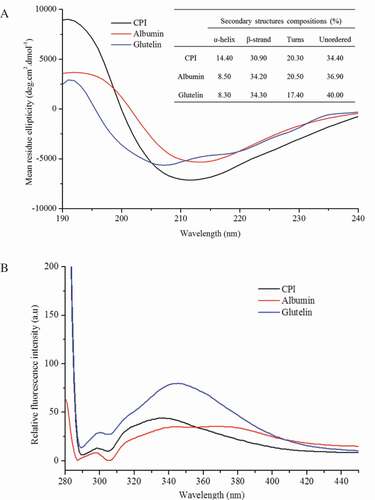
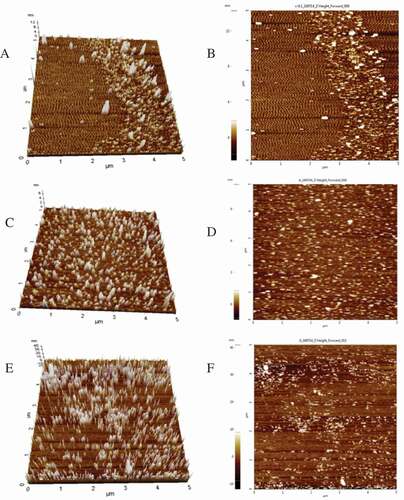
Figure 3. 3D-view and typical top-view AFM images of CPI (A and B), albumin (C and D), and glutelin (E and F). Scan area was 5 μm×5 μm.
Intrinsic fluorescence spectra
The intrinsic fluorescence spectrum is determined according to the ability of aromatic amino acid residues to absorb incident light from the ultraviolet area and emit fluorescence. The intrinsic fluorescence of protein could thus reflect the protein conformation. The protein’s intrinsic fluorescence spectra are shown in . Both Tyr and Trp residues of cumin proteins were excited at a wavelength of 275 nm and showed two fluorescence peaks. The first emission maximum wavelength (λmax) for Tyr in albumin was present at 297.5 nm, whereas it was present at 299 nm and 300.17 nm for CPI and glutelin, respectively. The Tyr λmax of CPI, albumin, and glutelin was close to 303 nm, a typical characteristic fluorescence profile for Tyr residues.[Citation43] CPI exhibits another higher fluorescence peak at a λmax of 336 nm, which corresponds to the relative FI of Trp and was significantly more intense than Tyr. The Trp λmax of fluorescence for albumin and glutelin was present at 345.5 nm, which showed about 10 nm red-shift compared to CPI. The polarity of the amino acid residues environment also affected the intrinsic fluorescence significantly. Therefore, the fluorescence peak wavelengths of Trp and Tyr are affected by protein types and environment polarity, and thus indicate the changes in the protein structure.[Citation31] Compared to the typical Trp λmax (348 nm), the Trp λmax of CPI, albumin, and glutelin decreased (blue-shift), with CPI having the greatest decrease. This might be explained by the weaker polarity of CPI compared to albumin and glutelin, and therefore the interaction with chromophores might be more difficult with CPI[Citation11], which is also consistent with the data obtained for the solubility of proteins at pH 7.0. Moreover, Tyr and Trp FIs at λmax in glutelin were higher than for CPI and albumin, which could be attributed to the higher contents of Tyr and Trp residues in glutelin, together with the variety in structures and polypeptide compositions of CPI, albumin, and glutelin.
Atomic force microscopy (AFM)
shows the AFM morphology images of the three kinds of protein from 3D view and typical top view. The morphology and surface evenness of the CPI nanoparticles were significantly different from those of albumin and glutelin (). The height of albumin ranged from 0 to 6 nm, and the albumin nanoparticles surface was smoother than that of glutelin and CPI (). Compared to CPI and albumin, the glutelin nanoparticles were bigger, and the morphology of glutelin nanoparticles was sharper, as most of them were present in a clustered state (). The results of the AFM analysis with the three kinds of protein were in agreement with their Dh ().
Table 2. Ho, ζ, Dh, EAI, and ESI of CPI, albumin, and glutelin and d4,3 of their emulsions at a protein concentration of 0.1% (w/v).
Ho
Surface Ho is an important physicochemical parameter for protein characterization, which reflects the ability of proteins to undergo intermolecular interaction and which influences their surface-related properties.[Citation39] shows that Ho of glutelin (924.56) was higher than that of CPI (343.35) and albumin (327.42), which indicates the presence of more exposed hydrophobic clusters in glutelin and CPI than in albumin. The difference in Ho observed for various proteins might be caused by their variable amino acid compositions and/or the increasing Ho of aromatic and aliphatic amino acid residues that were exposed on the protein surface during extraction processing.[Citation44] During the alkaline extraction of glutelin and CPI, the protein might partially unfold and lead to the exposure of more hydrophobic residues on the surface of the proteins.[Citation23,Citation40] Moreover, the functional properties (solubility and emulsifying properties) of proteins could be affected by Ho, together with the degree of protein denaturation, particle size, flexibility, and other factors.[Citation45,Citation46]
ζ
The ζ determination allows one to measure the electrostatic charge on a protein and is an important factor for intermolecular interaction characterization in protein solutions.[Citation4] The ζ of CPI, glutelin, and albumin were –20.33, –21.18, and –14.50 mV, respectively (). These values arise from the ionization of surface groups and present the same sequential order with their Ho values.
Dh
The Dh of protein was evaluated by dynamic light scattering technology and was expressed as the z-average diameter of particles in protein solution. The Dh of CPI was about 122.12 nm, which was lower than the value of 131.25 nm found for glutelin. From , it can be seen that Ho is positively correlated with the absolute values of ζ and Dh. Possibly, higher absolute charge on the proteins might enhance the hydrophobic interaction between protein particles. The Ho, ζ, and Dh of CPI were higher than those of albumin, which is largely attributed to the higher content of glutelin in CPI.
Protein solubility
Solubility is one of the most relevant physicochemical properties of protein and is highly dependent on the pH of the solutions. shows the solubility values of CPI, albumin, and glutelin at different pH values ranging from 2.0 to 10.0. With the pH increasing, the solubility values of CPI, albumin, and glutelin showed a typical U-shaped evolution, with the minimum solubility reached at pH 4.0 (). Indeed, the interaction strength between proteins gradually reduces as the net protein charge increases at lower or higher pH values. Previous reports on the solubility of plant protein showed similar trends for sweet potato protein[Citation47], chickpea protein[Citation8], common buckwheat globulin and albumin[Citation11], and A. trifoliata var. australis seed albumin, glutelin, and protein isolates.[Citation25] From pH 5.0 to 7.0, CPI and albumin showed lower protein solubility than glutelin, which might be due to their higher hydrophobic and aromatic amino acid contents (). Indeed, Malomo and Aluko (Citation2015)[Citation9] found that the higher protein solubility of hemp seed albumin was consistent with the lower level of hydrophobic and aromatic amino acids compared to hemp globulin. The positive relationship between ζ and the solubilities of kidney bean protein and field pea protein indicates that the charge on the proteins significantly influences the solubility[Citation4]; the higher ζ of glutelin might also lead to its higher solubility compared to albumin in neutral condition.
Figure 4. Protein solubility curves of CPI, albumin, and glutelin at different pH values.
Emulsifying properties
EAI and ESI
The EAI and ESI of CPI and major fractions are shown in . The EAI and ESI of albumin (103.67 m2/g and 42.84 min, respectively) were significantly higher than those of CPI (69.43 m2/g and 21.51 min, respectively) and glutelin (69.37 m2/g and 14.12 min, respectively). Some reports have shown that albumin has better emulsifying activity than protein isolate and glutelin, especially when pH > 4.0.[Citation25] Moreover, EAIs of CPI, albumin, and glutelin were significantly higher than those of protein isolates from kidney bean (21.3 m2/g), field bean (13.1 m2/g), soy (12.2 m2/g)[Citation4], and red kidney bean (~25 m2/g)[Citation33]; the ESI of albumin was higher than that of soy (18.6 min).[Citation4] All the results indicate that cumin proteins could be a good potential emulsifier substitute. Generally, the emulsifying activity depends on whether the proteins can be adsorbed on the oil droplets interface in emulsion, whereas emulsion stability is related to the properties of the adsorbed protein layer. At neutral pH, higher net charges of protein inhibit the formation of strong interfacial membranes because of the increased protein–protein repulsions[Citation9], which might explain the lower EAI and ESI of CPI and glutelin and their higher ζ.
Emulsion particle size and distribution
shows the emulsion particle size and distribution of CPI, albumin, and glutelin. A smaller particle size is correlated with higher EAI for the protein. The minimum emulsion d4,3 obtained for the protein fractions was for albumin (4.29 μm) in comparison with those formed by CPI (26.51 μm) and glutelin (18.93 μm). It might be attributed to the lower net charge of albumin compared to CPI and glutelin, which improves the formation of an interfacial membrane at neutral condition.[Citation9] All the studied protein emulsion droplets displayed a bimodal distribution, and the position of the peaks varied with the proteins (). The peaks of albumin emulsion ranged from 0.44 to 8.28 μm and were significantly higher than those of CPI and glutelin. On the contrary, the emulsions stabilized by CPI and glutelin had higher volume frequency than albumin ranging from 8.28 to 100 μm.
Figure 5. Particle distribution (A), optical microscopy images (B) of emulsions stabilized by CPI, albumin, and glutelin at a concentration of 0.1% (w/v), and changes in storage modulus (G′) and loss modulus (G″) of 10% (w/v) CPI, albumin, and glutelin dispersion with time and temperature (C). The bar accounts for 100 μm.
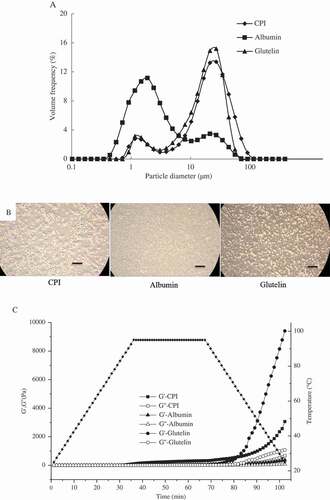
The emulsions’ optical microscopy images are shown in ; the individual emulsion droplets of albumin were the smallest, followed by those of CPI and glutelin, which was consistent with the d4,3 values measured (). The majority of droplets in the glutelin emulsion were found in clusters, giving a different morphology in comparison with CPI and albumin emulsion droplets. Moreover, large flocculated particles could be produced easily in the emulsion because of the clusters formed by protein[Citation29], which makes the protein emulsion unstable and have a lower ESI value ().
Rheological characteristics
shows the temperature dependences of G and G″ of CPI, albumin, and glutelin solutions. With increasing temperature, G′ increases gradually and exceeds the G″ at Tgel. When the heating temperature exceeds Tgel, proteins are denatured and more hydrophobic groups trapped inside the folded proteins become exposed on the surface and lead to protein association, forming a gel with a network structure. CPI had the lowest Tgel at 80.6°C, which meant that CPI can easily form a heat-induced gel, followed by albumin (85.4°C) and glutelin (92.6°C). The Tgel of soy protein isolate at pH 7.0 (~86.0°C)[Citation48] was higher than the Tgel of albumin and CPI, which means that the formation of a network is easier with CPI and albumin than with soy protein isolate. Moreover, as CPI and glutelin present higher Ho than albumin, during the heat denaturing process, more hydrogen bonds might be produced as larger regions become active and available for intermolecular interactions, while high temperature was needed to form a stronger gel network.[Citation49] The higher Tgel of glutelin and albumin might be attributed to a higher β-strand content, as Shevkani et al. (2015)[Citation4] reported that the β-strand surface area was higher than that of the α-helix. Thus, β-strand content has a positive relationship with higher thermal stability, which favours the formation of intermolecular hydrogen bonds at higher Tgel. After the heating and cooling treatments, both G′ and G″ increased, which indicates the formation of the gel network. A similar phenomenon has been observed for other proteins such as canola protein[Citation49] and sweet potato protein.[Citation50] The final G′ of CPI, albumin, and glutelin were 3060, 374, and 9410 Pa, respectively. And the G′ of CPI and glutelin were significantly higher than that of soy protein isolate gel[Citation51,Citation52], which might be related to the higher Ho of CPI and glutelin compared to soy bean protein isolate.[Citation52] The increase of the G′ and G″ values during the cooling period was attributed to inter-protein molecular interactions (hydrogen bonding and van der Waals forces) in the gel network.
Conclusion
This study investigated the main protein fractions presented in cumin seed as well as the structure, physicochemical, and functional properties of the protein isolate and the major protein fractions from cumin seed. Albumin, globulin, glutelin, and CPI contained different protein subunits and most of the essential amino acids. Different protein subunits were found in the SDS-PAGE profiles for CPI, albumin, and glutelin. Cumin proteins presented an ordered structure, with CPI having more α-helix and less β-strand than albumin and glutelin. The morphology, fluorescence, Dh, Ho, and ζ determination for CPI, albumin, and glutelin allowed one to evaluate the different physicochemical and functional properties. Indeed, CPI, albumin, and glutelin present good solubility at acidic and alkali pH values. Albumin presents a better emulsifying activity and stability than CPI and glutelin, whereas CPI presents a better stability than glutelin. Higher contents in β-strand and surface Ho of glutelin than CPI and albumin contributed to the formation of the stronger gel at higher temperature. Therefore, compared with soy protein and other plant proteins, CPI and albumin are potential candidates as emulsifying agents for the food industry, and CPI and glutelin could be used for gelation.
Acknowledgments
This work was funded by the Comprehensive Utilization and Deep Processing of Cumin and Related Byproducts project (2014-Z64) and The Science and Technology Innovation Project of Chinese Academy of Agricultural Sciences. We also thank the China Scholarship Council for the funding of the scientific study in Belgium that made this paper possible.
Additional information
Funding
References
- Nishinari, K.; Fang, Y.; Guo, S.; Phillips, G. O. Soy Proteins: A Review on Composition, Aggregation and Emulsification. Food Hydrocolloids 2014, 39, 301–318. DOI: 10.1016/j.foodhyd.2014.01.013.
- Zhang, Y.; Yang, R.; Zhao, W.; Hua, X.; Zhang, W. Physicochemical and Emulsifying Properties of Protein Extracted from Soybean Meal Assisted by Steam Flash-Explosion. Innovative Food Science and Emerging Technologies 2014, 23, 131–137. DOI: 10.1016/j.ifset.2014.03.009.
- Zhang, T.; Jiang, B.; Mu, W.; Wang, Z. Emulsifying Properties of Chickpea Protein Isolates: Influence of pH and NaCl. Food Hydrocolloids 2009, 23(1), 146–152. DOI: 10.1016/j.foodhyd.2007.12.005.
- Shevkani, K.; Singh, N.; Kaur, A.; Rana, J. C. Structural and Functional Characterization of Kidney Bean and Field Pea Protein Isolates: A Comparative Study. Food Hydrocolloids 2015, 43(3), 679–689. DOI: 10.1016/j.foodhyd.2014.07.024.
- He, X. H.; Liu, H. Z.; Liu, L.; Zhao, G. L.; Wang, Q.; Chen, Q. L. Effects of High Pressure on the Physicochemical and Functional Properties of Peanut Protein Isolates. Food Hydrocolloids 2014, 36, 123–129. DOI: 10.1016/j.foodhyd.2013.08.031.
- Osborne, T. B.;. The Vegetable Proteins; 2nd. Green & Co.: London, 1924.
- Branda, H.; Asim, E. Heterogeneity of Soybean Seed Proteins One-Dimensional Electrophoretic Profiles of Six Different Solubility Fractions. Journal of Agricultural and Food Chemistry 1981, 29(3), 497–501. DOI: 10.1021/jf00105a015.
- Ragab, D. M.; Babiker, E. E.; Eltinay, A. H. Fractionation, Solubility and Functional Properties of Cowpea (Vigna Unguiculata) Proteins as Affected by pH And/Or Salt Concentration. Food Chemistry 2004, 84(2), 207–212. DOI: 10.1016/S0308-8146(03)00203-6.
- Malomo, S. A.; Aluko, R. E. A Comparative Study of the Structural and Functional Properties of Isolated Hemp Seed (Cannabis Sativa L.) Albumin and Globulin Fractions. Food Hydrocolloids 2015, 43, 743–752. DOI: 10.1016/j.foodhyd.2014.08.001.
- Rezig, L.; Riaublanc, A.; Chouaibi, M.; Guéguen, J.; Hamdi, S. Functional Properties of Protein Fractions Obtained from Pumpkin (Cucurbita Maxima) Seed. International Journal of Food Properties 2016, 19(1), 172–186. DOI: 10.1080/10942912.2015.1020433.
- Tang, C. H.; Wang, X. Y. Physicochemical and Structural Characterisation of Globulin and Albumin from Common Buckwheat (Fagopyrum Esculentum Moench) Seeds. Food Chemistry 2010, 121(1), 119–126. DOI: 10.1016/j.foodchem.2009.12.016.
- Ma, M.; Mu, T.; Sun, H.; Zhang, M.; Chen, J.; Yan, Z. Optimization of Extraction Efficiency by Shear Emulsifying Assisted Enzymatic Hydrolysis and Functional Properties of Dietary Fiber from Deoiled Cumin (Cuminum Cyminum L.). Food Chemistry 2015, 179, 270–277. DOI: 10.1016/j.foodchem.2015.01.136.
- Siow, H. L.; Gan, C. Y. Functional Protein from Cumin Seed (Cuminum Cyminum): Optimization and Characterization Studies. Food Hydrocolloids 2014, 41, 178–187. DOI: 10.1016/j.foodhyd.2014.04.017.
- Hajlaoui, H.; Mighri, H.; Noumi, E.; Snoussi, M.; Trabelsi, N.; Ksouri, R.; Bakhrouf, A. Chemical Composition and Biological Activities of Tunisian Cuminum Cyminum L. Essential Oil: A High Effectiveness against Vibrio Spp. Strains. Food and Chemical Toxicology 2010, 48(8–9), 2186–2192.
- Sowbhagya, H. B.; Sathyendra Rao, B. V.; Krishnamurthy, N. Evaluation of Size Reduction and Expansion on Yield and Quality of Cumin (Cuminum Cyminum) Seed Oil. Journal of Food Engineering 2008, 84(4), 595–600. DOI: 10.1016/j.jfoodeng.2007.07.001.
- Zare, R.; Heshmati, F.; Fallahzadeh, H.; Nadjarzadeh, A. Complementary Therapies in Clinical Practice Effect of Cumin Powder on Body Composition and Lipid Pro Fi Le in Overweight and Obese Women. Complementary Therapies in Clinical Practice 2014, 20(4), 297–301. DOI: 10.1016/j.ctcp.2014.10.001.
- Sowbhagya, H. B.; Suma, P. F.; Mahadevamma, S.; Tharanathan, R. N. Spent Residue from Cumin - a Potential Source of Dietary Fiber. Food Chemistry 2007, 104(3), 1220–1225. DOI: 10.1016/j.foodchem.2007.01.066.
- Hinneburg, I.; Damien Dorman, H. J.; Hiltunen, R. Antioxidant Activities of Extracts from Selected Culinary Herbs and Spices. Food Chemistry 2006, 97(1), 122–129. DOI: 10.1016/j.foodchem.2005.03.028.
- El-Ghorab, A. H.; Nauman, M.; Anjum, F. M.; Hussain, S.; Nadeem, M. A. Comparative Study on Chemical Composition and Antioxidant Activity of Ginger (Zingiber Officinale) and Cumin (Cuminum Cyminum). Journal of Agricultural amd Food Chemistry 2010, 58(14), 8231–8237. DOI: 10.1021/jf101202x.
- Vallverdú-Queralt, A.; Regueiro, J.; Martínez-Huélamo, M.; Rinaldi Alvarenga, J. F.; Leal, L. N.; Lamuela-Raventos, R. M. A Comprehensive Study on the Phenolic Profile of Widely Used Culinary Herbs and Spices: Rosemary, Thyme, Oregano, Cinnamon, Cumin and Bay. Food Chemistry 2014, 154, 299–307. DOI: 10.1016/j.foodchem.2013.12.106.
- Badr, F. H.; Georgiev, E. V. Amino Acid Composition of Cumin Seed (Cuminum Cyminum L.). Food Chemistry 1990, 38(4), 273–278. DOI: 10.1016/0308-8146(90)90184-6.
- Castrignanò, T.; De Meo, P. D.; Cozzetto, D.; Talamo, I. G.; Tramontano, A. The PMDB Protein Model Database. Nucleic Acids Research 2006, 34, D306–D309. DOI: 10.1093/nar/gkj105.
- Siow, H. L.; Lim, T. S.; Gan, C. Y. Development of a Workflow for Screening and Identification of α-amylase Inhibitory Peptides from Food Source Using an Integrated Bioinformatics-Phage Display Approach: Case Study - Cumin Seed. Food Chemistry 2017, 214, 67–76. DOI: 10.1016/j.foodchem.2016.07.069.
- Siow, H. L.; Gan, C. Y. Optimization Study in Extracting Anti-Oxidative and α-amylase Inhibitor Peptides from Cumin Seeds (Cuminum Cyminum). Journal of Food Biochemistry 2017, 41: e12280. Doi:10.1111/jfbc.12280
- Du, Y.; Jiang, Y.; Zhu, X.; Xiong, H.; Shi, S.; Hu, J.; Peng, H.; Zhou, Q.; Sun, W. Physicochemical and Functional Properties of the Protein Isolate and Major Fractions Prepared from Akebia Trifoliata Var. Australis Seed. Food Chemistry 2012, 133(3), 923–929. DOI: 10.1016/j.foodchem.2012.02.005.
- Markwell, M.; Haas, S. M.; Bieber, L. L.; Tolbert, N. E. A Modification of the Lowry Procedure to Simplify Protein Determination in Membrane and Lipoprotein Samples. Analytical Biochemistry 1978, 87(1), 206–210. DOI: 10.1016/0003-2697(78)90586-9.
- Laemmli, U. K.;. Cleavage of Structural Proteins during the Assembly of the Head of Bacteriophage T4. Nature 1970, 227(5259), 680–685. DOI: 10.1038/227680a0.
- Sreerama, N.; Woody, R. W. Estimation of Protein Secondary Structure from Circular Dichroism Spectra: Comparison of CONTIN, SELCON, and CDSSTR Methods with an Expanded Reference Set. Analytical Biochemistry 2000, 287(2), 252–260. DOI: 10.1006/abio.2000.4880.
- Peng, W.; Kong, X.; Chen, Y.; Zhang, C.; Yang, Y.; Hua, Y. Effects of Heat Treatment on the Emulsifying Properties of Pea Proteins. Food Hydrocolloids 2016, 52, 301–310. DOI: 10.1016/j.foodhyd.2015.06.025.
- Kato, A.; Nakai, S. Hydrophobicity Determined by a Fluorescence Probe Method and Its Correlation with Surface Properties of Proteins. Biochimica et Biophysica Acta (BBA) - Protein Structure 1980, 624(1), 13–20. DOI: 10.1016/0005-2795(80)90220-2.
- Yin, S. W.; Chen, J. C.; De, S. S.; Tang, C. H.; Yang, X. Q.; Wen, Q. B.; Qi, J. R. Physicochemical and Structural Characterisation of Protein Isolate, Globulin and Albumin from Soapnut Seeds (Sapindus Mukorossi Gaertn.). Food Chemistry 2011, 128(2), 420–426. DOI: 10.1016/j.foodchem.2011.03.046.
- Jarpa-Parra, M.; Bamdad, F.; Wang, Y.; Tian, Z.; Temelli, F.; Han, J.; Chen, L. Optimization of Lentil Protein Extraction and the Influence of Process pH on Protein Structure and Functionality. LWT - Food Science and Technology 2014, 57(2), 461–469. DOI: 10.1016/j.lwt.2014.02.035.
- Yin, S. W.; Tang, C. H.; Wen, Q. B.; Yang, X. Q.; Li, L. Functional Properties and in Vitro Trypsin Digestibility of Red Kidney Bean (Phaseolus Vulgaris L.) Protein Isolate: Effect of High-Pressure Treatment. Food Chemistry 2008, 110(4), 938–945. DOI: 10.1016/j.foodchem.2008.02.090.
- Guo, X.; Yao, H. Fractionation and Characterization of Tartary Buckwheat Flour Proteins. Food Chemistry 2006, 98(1), 90–94. DOI: 10.1016/j.foodchem.2005.05.055.
- Sogi, D. S.; Arora, M. S.; Garg, S. K.; Bawa, A. S. Fractionation and Electrophoresis of Tomato Waste Seed Proteins. Food Chemistry 2002, 76(4), 449–454. DOI: 10.1016/S0308-8146(01)00304-1.
- Subagio, A.;. Characterization of Hyacinth Bean (Lablab Purpureus (L.) Sweet) Seeds from Indonesia and Their Protein Isolate. Food Chemistry 2006, 95(1), 65–70. DOI: 10.1016/j.foodchem.2004.12.042.
- Gazzola, D.; Vincenzi, S.; Gastaldon, L.; Tolin, S.; Pasini, G.; Curioni, A. The Proteins of the Grape (Vitis Vinifera L.) Seed Endosperm: Fractionation and Identification of the Major Components. Food Chemistry 2014, 155, 132–139. DOI: 10.1016/j.foodchem.2014.01.032.
- Stone, A. K.; Karalash, A.; Tyler, R. T.; Warkentin, T. D.; Nickerson, M. T. Functional Attributes of Pea Protein Isolates Prepared Using Different Extraction Methods and Cultivars. Food Research International 2015, 76, 31–38. DOI: 10.1016/j.foodres.2014.11.017.
- Arogundade, L. A.; Mu, T.; Akinhanmi, T. F. Structural, Physicochemical and Interfacial Stabilisation Properties of Ultra Filtered African Yam Bean (Sphenostylis Stenocarpa) Protein Isolate Compared with Those of Isoelectric Protein Isolate. LWT - Food Science and Technology 2016, 69, 400–408. DOI: 10.1016/j.lwt.2016.01.049.
- FAO/WHO. Protein Quality Evaluation; Report of joint FAO/WHO expert consultation: Rome, Italy, 1991.
- Kelly, S. M.; Price, N. C. The Application of Circular Dichroism to Studies of Protein Folding and Unfolding. Biochimca et Biophysica Acta 1997, 1338, 161–185. DOI: 10.1016/S0167-4838(96)00190-2.
- Yang, J. T.; Wu, C. C.; Martinez, H. M. Calculation of Protein Conformation from Circular Dichroism. Methods Enzymol 1986, 130, 208–269.
- Mundi, S.; Aluko, R. E. Effects of NaCl and pH on the Structural Conformations of Kidney Bean Vicilin. Food Chemistry 2013, 139, 624–630. DOI: 10.1016/j.foodchem.2012.12.051.
- Jahaniaval, F.; Kakuda, Y.; Abraham, V.; Marcone, M. F. Soluble Protein Fractions from pH and Heat Treated Sodium Caseinate: Physicochemical and Functional Properties. Food Research International 2000, 33(8), 637–647. DOI: 10.1016/S0963-9969(00)00108-3.
- Liang, H. N.; Tang, C. H. pH-dependent Emulsifying Properties of Pea [Pisum Sativum (L.)] Proteins. Food Hydrocolloids 2013, 33(2), 309–319. DOI: 10.1016/j.foodhyd.2013.04.005.
- Moure, A.; Sineiro, J.; Domínguez, H.; Parajó, J. C. Functionality of Oilseed Protein Products: A Review. Food Research International 2006, 39, 945–963. DOI: 10.1016/j.foodres.2006.07.002.
- Mu, T. H.; Tan, S. S.; Xue, Y. L.; Chen, J. W. The Amino Acid Composition, Solubility and Emulsifying Properties of Sweet Potato Protein. Food Chemistry 2009, 112(4), 1002–1005. DOI: 10.1016/j.foodchem.2008.07.012.
- Kim, J. H. J.; Varankovich, N. V.; Nickerson, M. T. The Effect of pH on the Gelling Behaviour of Canola and Soy Protein Isolates. Food Research International 2016, 81, 31–38. DOI: 10.1016/j.foodres.2015.12.029.
- Tan, S. H.; Mailer, R. J.; Blanchard, C. L.; Agboola, S. O.; Day, L. Gelling Properties of Protein Fractions and Protein Isolate Extracted from Australian Canola Meal. Food Research International 2014, 62, 819–828. DOI: 10.1016/j.foodres.2014.04.055.
- Arogundade, L. A.; Mu, T. H.; Añón, M. C. Heat-Induced Gelation Properties of Isoelectric and Ultrafiltered Sweet Potato Protein Isolate and Their Gel Microstructure. Food Research International 2012, 49(1), 216–225. DOI: 10.1016/j.foodres.2012.07.061.
- Wang, X. S., Tang, C. H., Li, B. S., Yang X. Q., Li Ling, Ma C. Y. Effects of High-Pressure Treatment on Some Physicochemical and Functional Properties of Soy Protein Isolates. Food Hydrocolloids 2008, 22(4), 560–567. DOI: 10.1016/j.foodhyd.2007.01.027.
- Speroni, F., Beaumal, V., Lamballerie, M. de, Añón M. C., Puppo M. C. Gelation of Soybean Proteins Induced by Sequential High-Pressureand Thermaltreatments. Food hydrocolloids 2009, 23, 1433–1442. DOI: 10.1016/j.foodhyd.2008.11.008.