
ABSTRACT
The potential of near infrared (NIR) spectroscopy combined with chemometrics methods was studied to rapidly detect intramuscular fat (IMF) content in pork. Near infrared diffuse reflectance spectra were recorded both with an FT-NIR and a USB4000 spectrometer. The data analysis was compared on different sample preparation, spectral range and spectra pretreatment. According to calibration statistics, best calibration for IMF showed R2cal of 0.94, R2val of 0.92, RMSEC of 0.233, RMSEP of 0.462 and RPD of 2.29. The prediction of IMF content for minced samples was more accurate than that for intact samples. The spectra obtained using FT-NIR contained much information correlating to the IMF content than the Vis-NIR spectra of USB4000. The results showed that NIR spectroscopy technique can be used to determine the IMF content in pork as a rapid, convenient, and feasible analysis tool.
Introduction
Pork is the most commonly consumed meat in the world, and the quality of pork supplies nutrition of daily life is important. The intramuscular fat (IMF) content of the longissimus dorsi muscle (MLD) of pigs is widely regarded as an important parameter influencing sensory characteristics of porcine meat. The IMF content plays a major role in meat eating quality. Most instrumental techniques to measure this property are destructive and involve a considerable amount of manual work. Thus, it is of great importance to develop rapid and cheap method to assure the quality of pork.
Near infrared (NIR) spectroscopy has been successfully used in the agricultural products and food industry for chemical analysis due to its recognized advantages as a rapid and convenient tool.[Citation1] It has become a well-established technique for quantitative and qualitative analysis, helping to reduce the demand for traditional analysis. NIR spectroscopy had been developed for the prediction of chemical composition, technological parameters, sensory attributes, and microorganisms count in food.[Citation2,Citation3] As a rapid analysis tool, it was used to predict the physico-chemical composition of samples of different meat,[Citation4–Citation6] determine total volatile basic nitrogen (TVB-N) content and Warner–Bratzler shear force (WBSF) in pork,[Citation7,Citation8] discriminate the adult steers (oxen) and young cattle ground beef samples,[Citation9] evaluate tenderness of pork loins,[Citation10] evaluate freshness,[Citation11–Citation13] detect spoilage in sliced pork meat,[Citation14] predict sensory characteristics of lamb meat,[Citation15] and meat adulteration.[Citation16] NIR spectroscopy technology had also been applied for detection of IMF content in meat. Partial least-squares (PLS) models based on visible (Vis) and NIR reflectance spectroscopy data were explored to predict IMF using homogenized samples and raw spectra yielded a coefficient of determination in calibration (R2) and standard error of cross validation (SECV) for IMF (R2 = 0.87; SECV = 1.8 g/kg).[Citation17] NIR spectroscopy and modified partial least squares regression (mPLSR) were implemented to predict in pork and beef.[Citation18] The research proved the prediction ability of NIR spectroscopy used to determine IMF content (R2cv between 0.84 and 0.99; SECV between 0.14% and 0.53%). Vis-NIR as an on-line tool to predict IMF of lamb meat was investigated, and genetic algorithm-based PLS model was established with R2cv of 0.71 and RMSECV of 1.55.[Citation19] As a portable NIR sensor, IMF of pork had been detected, and different spectra pretreatments were compared. The optimal calibration model displayed values for R2 of 0.63 and SECV of 1.77.[Citation20] These reports indicate that NIR spectroscopy can be used as a potential tool to predict the intramuscular fat content in meat. However, compared to research for detection most other components of meat, little study was focused on the application of NIR technology for the IMF determination of pork and the accuracy also need to be improved.
The purpose of the present research was to develop rapid, nondestructive, and accurate method to determination of IMF in pork. PLS and least-squares supported vector machines (LS-SVM) were employed to establish quantitative analysis models based on different sample preparation, spectral range, and spectra pretreatment. Through comparing the performances of different models, the optimal model with spectra pretreatment method was achieved, and further investigate the potential of NIR spectroscopy for determining the IMF content of pork.
Materials and methods
Sample preparation
In total, 95 pork samples from Longissimus dorsi muscles (MLD) were used for analysis in ten successive days (everyday about ten samples). These samples were purchased from a commercial livestock market and came from different carcasses after slaughter for four hours. The pigs were slaughtered when their weight was about 150 kg. There were two sample presentations, namely intact and minced. Intact samples were prepared by cutting slices (100 mm×80 mm×25 mm thick approximately) and the weights ranged from 100 to 50 g. Intact samples were broken by a multiprocessor blender after collecting spectrum, and each minced sample was prepared about 50 g for measurement. The samples were scanned to collect the spectra firstly, then sub-samples were taken for further chemical analysis. All samples were packed in polyethylene bags and stored in 4ºC before scan.
Chemical analysis
The IMF content was determined by Soxhlet extraction with hydrolysis, using petrol-ether as the organic solvent (GB/T 9695.7–2008) (GB means national standard; 9695.7 is the code of the official methods; and 2008 is the year in which the methods were revised.). As the prediction ability of NIR spectroscopy depends largely on the reliability of the reference method for chemical composition, chemical analysis was performed on the fresh samples.
Spectra analysis
Both intact and minced samples were scanned in diffuse reflectance mode (800–2500 nm) using a Nexus FT-NIR (Thermo Nicolet Corporation, Madison, WI, USA) with bifurcated fiber optic diffuse reflectance accessory and a sample holder. The instrument equipped an interferometer, a cooled InGaAs detector and a wide-band quartz halogen light source (Quartz Tungsten Halogen, 50W). For each sample, the recorded spectra consisted of the average of 32 scans, the mirror velocity was 0.9494 cm s−1, and the resolution was four wavenumbers (cm−1). The intact or minced samples were placed steadily upon the sample holder when spectra collection was made. Each intact sample was scanned in three different positions. The light was guided to the sample by source fibers, and from the sample with the detector fibers to spectrometer. Minced samples were placed in a circular cup 50 × 30 mm with a quartz window and scanned for three times. Before spectra were measured on the sample, the standard reference spectrum was obtained by placing a Teflon block on the fruit holder and measuring the intensity of reflected light using the same instrumental conditions. The collection of NIR spectra were performed using the OMNIC software (Thermo Nicolet Corporation, Madison, WI, USA). And reflectance data were stored as log (1/R) (where R: reflectance) at 2 nm intervals.
The diffuse reflectance spectra for 85 minced meat samples of nine days were also recorded between 350 and 1000 nm using a USB4000 spectrometer (Ocean Optics,USA). The spectrometer was equipped with a linear silicon CCD array detector. Reference spectrum with a Teflon block for air and dark spectrum were measured and stored prior to sample spectra measurement. Spectrometer parameters setting, spectra data obtaining and storing were carried out via software OOIBase32 (Ocean Optics Inc. USA). The integration time was eight milliseconds, the number of discrete spectral acquisitions and the boxcar smoothing width were both five.
For the spectra collection, the intact samples were scanned by a Nexus FT-NIR firstly, then the fresh muscle was minced for at least 30 s with a multiprocessor blender in order to obtain a homogenous mixture. Minced samples about 50 g each were prepared for scan by FT-NIR and USB4000. The two instruments are different performance, which were used to compare the measurement capability for minced meat samples. The three replicates per sample were averaged to acquire a new dataset consisting of the sample scan.
Statistical analysis
The IMF contents acquired for the meat samples were used to develop quantification models. The intact meat samples of 95 contained IMF content from 0.9% to 7.08% (SD = 1.06), which were scanned from 800 to 2500 nm. Eighty-five minced meat samples contained IMF content from 0.9% to 2.33% (SD = 0.87) and were measured by two systems with the spectra range of 400–1000 nm and 800–2500 nm.
Statistical analysis was done using Matlab (version 7.6, The MathWorks, Inc.) and PLS toolbox (version 5.8, Eigenvector Research, Inc.), which was used to develop PLSR models and LS-SVM models with calibration and validation data sets. Spectral data pretreatment such as standard normal variation (SNV), multiplicative scatter correction (MSC) and orthogonal signal correction (OSC) were applied to reduce the noise and light scattering effects of spectra.
PLSR and LS-SVM models were built using the intact or minced meat sample spectra and their corresponding IMF reference values. PLS regression is a widely utilized multivariate regression method in spectroscopic analysis. The main idea of PLSR is to get as much concentration information as possible into the first few loading vectors. One of the main advantages of PLSR is that the resulting spectral vectors are directly related to the constituents of interest.[Citation21] Suykens et al. (2002). has described theory of LS-SVM, which is capable of dealing with linear and nonlinear multivariate analysis and resolving these problems in a relatively fast way.[Citation22,Citation23] LS-SVM encompasses similar advantages as SVM, but its additional advantage is that it requires solving a set of only linear equations (linear programming), which is much easier and computationally very simple.[Citation24]
The accuracy of prediction was evaluated in terms of coefficient of determination of calibration and validation (R2cal and R2val), root mean square error of calibration (RMSEC), root mean square of validation (RMSEP) and the ratio performance deviation (RPD) which has been suggested as the indicator of the reliability of prediction model.[Citation2,Citation25] Generally, a high R2 value, a low RMSEC and RMSEP, and a relatively small difference between RMSEC and RMSEP are necessarily to judge that a model is adequate and able to predict future unseen sample. The RMSEC and RMSEP were calculated as earlier measured.[Citation26]
The Chauvenet test was applied to detect the outlier sample during calibration.[Citation27] There were four outlier samples for the minced meat spectra and one outlier sample for the intact meat between 800 and 2500 nm, and no outlier for the minced meat in the range of 400–1000 nm. After eliminating the outlier, three-quarters of the samples were selected at random as calibration set. The remaining samples were used as validation set.
Results and discussion
Spectral reflectance characteristics of samples
Each sample was scanned in three different positions, then obtained an average of three spectra as the sample spectra. The average spectra of 95 samples of minced and intact samples are showed in . As can be seen, the shapes of the spectra were quite homogeneous, but the spectra also show absorbance differences between minced and intact samples. The absorbance of intact samples is higher than that of minced samples, which agree with other studies and is explained by disruption of the meat structure and its consequence for light absorbance.[Citation28,Citation29]
Figure 1. Average spectra (log 1/R) of minced and intact samples using a nexus FT-NIR spectrometer.
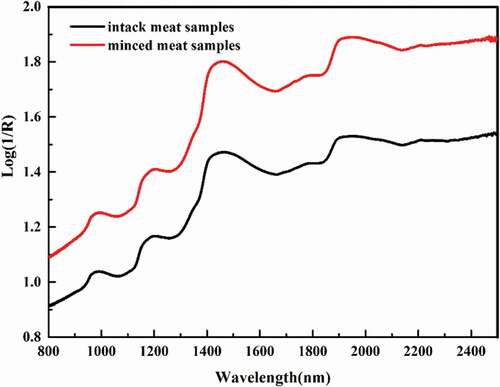
Near-infrared spectra could record the multifrequency and co-frequency information of organic molecules, which involves the response of molecular bonds of C–H, N–H, C–O, and O–H.[Citation30] The chemical composition of meat is moisture, fat and protein, and some peaks and valleys representing the characteristics of meat including hidden information of different elements were obviously shown in the spectra. The NIR spectra present broader peaks, but it is still much easier to assign specific lipid, protein, or water peaks.[Citation31] Strong absorption bands can be observed at a number of wavelengths. The original spectrum reveals clear wide peaks only at about 1210, 1450, and 1900 nm, which were appeared in the main absorbing wavelengths. The case of C-H bonds corresponds to the 1620–1780 and 2200–2500 nm regions of the spectrum (first C-H overtone and C-H bond vibration, respectively), and that of N–H and O–H bonds corresponds to the 1420–1620 and 1800–2200 nm regions (first N–H and O–H overtones, and N–H and O–H vibrations, respectively).[Citation32–Citation34] The main meat component was moisture and has the highest absorption at wavelengths in the NIR region. The absorbance spectra for meat samples are dominated by moisture absorption bands at 970 and 1450 nm. The typical peaks of fat are located at about 1210 (C–H second overtone), and 1900 nm, which agrees with other studies.[Citation35–Citation38]
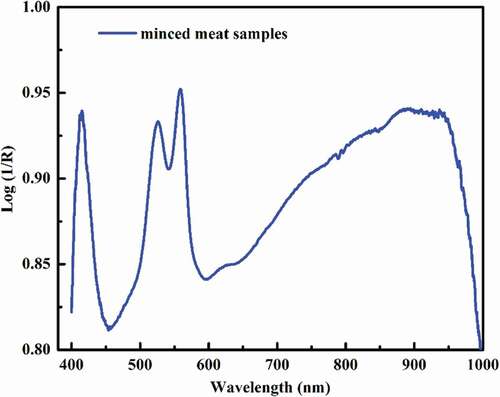
. shows the average spectra based on USB4000 of 85 minced meat samples for nine successive day. Two main broad bands can be identified at about 525 and 560 nm, which relate to both myoglobin and oxymyoglobin absorptions. A weak NIR band at 780 nm should be due to the O-H third overtone, which is not distinctness. The spectral characteristics in the visible region are not similar to other reports.[Citation17,Citation39]
Figure 2. Averaged spectra of minced meat samples using a USB4000 spectrometer.
Prediction of IMF content based on FT-NIR
The minced meat sample spectra of full range (800–2500 nm) and the corresponding reference values were submitted to establish PLSR and LS-SVM models for IMF content. The performance of the calibration and validation models with different pretreatment methods was shown in .
Table 1. Statistics for IMF content of minced meat using PLSR and LS-SVM models based on NIR spectra.
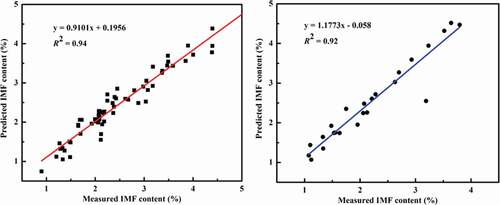
According to the results, the pretreatment of MSC and SVN for spectra could not improve the validation models compared with original spectra. The PLSR model with the spectra of OSC pretreatment made progress for both calibration and validation but there was a big difference between RMSEC and RMSEP. The pretreatments also could not improve the LS-SVM models for prediction the IMF content. The best model for IMF content was obtained by the original minced meat spectra using LS-SVM with R2cal of 0.94, R2val of 0.92, RMSEC of 0.233, RMSEP of 0.462, and RPD of 2.29, which reveals a strong relationship between spectra and IMF content. shows the relationship between the measured values and the predicted value of IMF content for both calibration (a) and validation (b) sets based on the optimal LS-SVM model.
Figure 3. Relationship between the measured values and the predicted value of IMF content by the NIRS technique for both calibration (a) and the validation (b) sets of minced meat samples by the original minced meat spectra using LS-SVM.
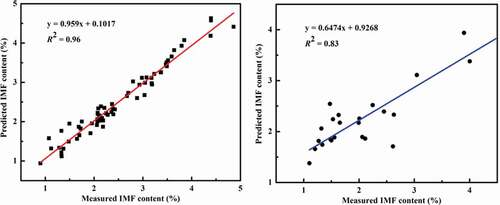
For intact meat samples, three different spectral pretreatment methods were also used and compared with the original NIR spectra. As can be seen in the prediction accuracy of models using pretreatment spectra was improved. The best model of PLSR with the intact meat spectra was accomplished with MSC pretreatment. presents the statistics corresponding to the best prediction equations for the IMF content, and the validation statistics. Although the LS-SVM model has a higher R2cal (0.98) and a lower RMSEC (0.124) than the PLSR model with R2cal = 0.96 and RMSEC = 0.179, but there was a relatively big difference between RMSEC and RMSEP, and a lower RPD. However, the ability of models using PLSR or LS-SVM method based on the intact meat spectra had the similar calibration and prediction accuracy. Compared with minced meat samples, scattering and absorption of light from the surface of samples are different because of different samples’ status. The minced meat samples were much more homogenized than the intact meat samples and the models with intact meat were altered by mincing. The best model for the minced meat was achieved by the original spectrum, while the MSC pretreatment could improve the ability of model of intact meat.
Table 2. Statistics for IMF content of intact meat using PLSR and LS-SVM models based on NIR spectra.
Figure 4. Relationship between the measured values and the predicted value of IMF content by the NIRS technique for both calibration (a) and the validation (b) sets of intact meat samples by PLSR with MSC pretreatment.
Prediction of IMF content for minced meat based on USB4000
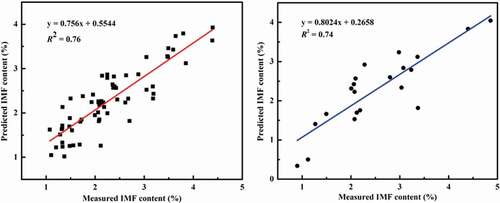
shows the performance of the prediction models based on the Vis-NIR minced meat sample spectra. The predictive ability of the Vis-NIR models is poorer than the NIR models overall. The best model (R2cal = 0.76, R2val = 0.74, RMSEC = 0.405, RMSEP = 0.561 and RPD = 1.55) was achieved using PLS model with the OSC pretreatment minced meat spectra from 400 to 1000 nm. The IMF content predicted by Vis-NIR and values obtained by reference method is plotted in . This implies that the prediction of IMF content with Vis-NIRS would be possible, in-depth study should be done to improve the accuracy and the precision. Because it is easy to scan the sample in the Vis-NIR spectral region, the detector is cheaper in the Vis-NIR spectral region compared with in the NIR spectral region. Increase in the number of samples might be likely to improve the accuracy of Vis-NIR spectroscopy to predict IMF content in the future research. This makes real-time or on-line analysis of meat quality possible in the future.
Table 3. Statistics for IMF content of minced meat using PLSR and LS-SVM models based on Vis-NIR spectra.
Figure 5. Relationship between the measured values and the predicted value of IMF content by the Vis-NIRS technique for both calibration (a) and the validation (b) sets of minced meat samples by PLSR with OSC pretreatment.
Conclusion
NIR reflectance spectroscopy coupled with chemometrics techniques could provide a rapid method for determination IMF of pork. The relationship between IMF content and NIR spectra of pork meat were analyzed via PLS regression and LS-SVM. The results indicate that IMF content can be successfully predicted applying NIR spectroscopy. The calibration and validation models using minced meat spectra showed a bit better result as compared with the models of intact meat for determine IMF content of pork. For minced meat samples, the pretreatment of spectra could not improve the performance of models as compared with the models obtained from the original spectra. And for intact meat samples, the pretreatment of spectra was effective to improve the models. LS-SVM model for IMF in minced meat show high accuracy with the original spectra. The R2cal, RMSEC, R2val, RMSEP and PRD were 0.94, 0.233, 0.92, 0.462, and 2.99, respectively. PLS regression with MSC shows better accuracy for IMF in intact meat. The R2cal, RMSEC, R2val, RMSEP, and PRD were 0.96, 0.179, 0.83, 0.522, and 2.03, respectively. All models were based on the spectra from 800 to 2500 nm. The Vis-NIR spectra from 400 to 1000 nm were also correlated with the IMF content in minced meat, but the accuracy of models was unsatisfied, because there are less relevant bands with the IMF content of meat on the range of Vis-NIR (400–1000 nm). Consequently, an in-depth study of more samples and spectrum bands might be important for higher level of estimation of meat quality using NIR spectroscopy. Compared to the conventional wet methods, the NIRS reflectance spectroscopy was to be preferred because it is rapid, non-destructive and has high repeatability, and seems to be promising for the effective, chemical-free, and rapid analysis of food quality in agriculture and food industry.
Additional information
Funding
References
- Ripoll, G.; Albertí, P.; Panea, B.; Olleta, J. L.; Sañudo, C. Near-Infrared Reflectance Spectroscopy for Predicting Chemical, Instrumental and Sensory Quality of Beef. Meat Science 2008, 80, 697–702. DOI: 10.1016/j.meatsci.2008.03.009.
- Prieto, N.; Roehe, R.; Lavín, P.; Batten, G.; Andrés, S. Application of near Infrared Reflectance Spectroscopy to Predict Meat and Meat Products Quality: A Review. Meat Science 2009, 83, 175–186. DOI: 10.1016/j.meatsci.2009.04.016.
- Kutsanedzie, F. Y. H.; Chen, Q.; Hassan, M. M.; Yang, M.; Sun, H.; Rahman, M. H. Near Infrared System Coupled Chemometric Algorithms for Enumeration of Total Fungi Count in Cocoa Beans Neat Solution. Food Chemistry 2018, 240, 231–238. DOI: 10.1016/j.foodchem.2017.07.117.
- Tejerina, D.; López-Parra, M. M.; García-Torres, S. Potential Used of near Infrared Reflectance Spectroscopy to Predict Meat Physico-Chemical Composition of Guinea Fowl (Numida Meleagris) Reared under Different Production Systems. Food Chemistry 2009, 113, 1290–1296. DOI: 10.1016/j.foodchem.2008.08.044.
- Wang, J. X.; Fan, L. F.; Wang, H. H.; Zhao, P. F.; Li, H.; Wang, Z. Y.; Huang, L. Determination of the Moisture Content of Fresh Meat Using Visible and Near-Infrared Spatially Resolved Reflectance Spectroscopy. Biosystems Engineering 2017, 162, 40–56. DOI: 10.1016/j.biosystemseng.2017.07.004.
- Prieto, N.; Pawluczyk, O.; Dugan, M. E. R.; Aalhus, J. L. A Review of the Principles and Applications of Near-Infrared Spectroscopy to Characterize Meat, Fat, and Meat Products. Applied Spectroscopy 2017, 71, 1403–1426. DOI: 10.1177/0003702817709299.
- Cai, J.; Chen, Q.; Wan, X.; Zhao, J. Determination of Total Volatile Basic Nitrogen (TVB-N) Content and Warner-Bratzler Shear Force (WBSF) in Pork Using Fourier Transform near Infrared (FT-NIR) Spectroscopy. Food Chemistry 2011, 126, 1354–1360. DOI: 10.1016/j.foodchem.2010.11.098.
- Khulal, U.; Zhao, J.; Hu, W.; Chen, Q. Nondestructive Quantifying Total Volatile Basic Nitrogen (TVB-N) Content in Chicken Using Hyperspectral Imaging (HSI) Technique Combined with Different Data Dimension Reduction Algorithms. Food Chemistry 2016, 197, 1191–1199. DOI: 10.1016/j.foodchem.2015.11.084.
- Prieto, N.; Andrés, S.; Giráldez, F. J.; Mantecón, A. R.; Lavín, P. Discrimination of Adult Steers (Oxen) and Young Cattle Ground Meat Samples by near Infrared Reflectance Spectroscopy (NIRS). Meat Science 2008, 79, 198–201. DOI: 10.1016/j.meatsci.2007.08.001.
- Shackelford, S. D.; King, D. A.; Wheeler, T. L. Development of a System for Classification of Pork Loins for Tenderness Using Visible and Near-Infrared Reflectance Spectroscopy. Journal of Animal Science 2011, 89, 3803–3808. DOI: 10.2527/jas.
- Chou, C.-H.; Chyr, C.-Y.-L.; Chen, R.-L.-C.; Shaw, J.-T. Evaluation of Freshness of Ground Pork Tenderloin by Visible/Near Infrared Spectroscopy. Journal Food Drug Analysis 2010, 18, 107–112. DOI: 10.6227/jfda.
- Liao, Y.; Fan, Y.; Cheng, F. On-Line Prediction of PH Values in Fresh Pork Using Visible/Near-Infrared Spectroscopy with Wavelet De-Noising and Variable Selection Methods. Journal of Food Engineering 2012, 109, 668–675. DOI: 10.1016/j.jfoodeng.2011.11.029.
- Huang, Q.; Chen, Q.; Li, H.; Huang, G.; Ouyang, Q.; Zhao, J. Non-Destructively Sensing Pork’s Freshness Indicator Using Near Infrared Multispectral Imaging Technique. Journal of Food Engineering 2015, 154, 69–75. DOI: 10.1016/j.jfoodeng.2015.01.006.
- Horváth, K.; Seregély, Z.; Andrássy, É.; Dalmadi, I.; Farkas, J.; Horváth, K.; Seregély, Z.; Andrássy, É.; Farkas, J. A Preliminary Study Using near Infrared Spectroscopy to Evaluate Freshness and Detect Spoilage in Sliced Pork Meat. Acta Alignment Hung 2008, 37, 93–102. DOI: 10.1556/AAlim.37.2008.1.9.
- Andrés, S.; Murray, I.; Navajas, E. A.; Fisher, A. V.; Lambe, N. R.; Bünger, L. Prediction of Sensory Characteristics of Lamb Meat Samples by near Infrared Reflectance Spectroscopy. Meat Science 2007, 76, 509–516. DOI: 10.1016/j.meatsci.2007.01.011.
- Schmutzler, M.; Beganovic, A.; Böhler, G.; Huck, C. W. Methods for Detection of Pork Adulteration in Veal Product Based on FT-NIR Spectroscopy for Laboratory, Industrial and On-Site Analysis. Food Control 2015, 57, 258–267. DOI: 10.1016/j.foodcont.2015.04.019.
- Barlocco, N.; Vadell, A.; Ballesteros, F.; Galietta, G.; Cozzolino, D. Predicting Intramuscular Fat, Moisture and Warner-Bratzler Shear Force in Pork Muscle Using near Infrared Reflectance Spectroscopy. Animal Science 2006, 82, 111–116. DOI: 10.1079/ASC20055.
- Prevolnik, M.; Čandekpotokar, M.; Škorjanc, D.; Velikonjabolta, Š.; Škrlep, M.; Žnidaršič, T.; Babnik, D. Predicting Intramuscular Fat Content in Pork and Beef by near Infrared Spectroscopy. Journal of Near Infrared Spectroscopy 2005, 13, 77–85. DOI: 10.1255/jnirs.460.
- Pullanagari, R. R.; Yule, I. J.; Agnew, M. On-Line Prediction of Lamb Fatty Acid Composition by Visible near Infrared Spectroscopy. Meat Science 2015, 100, 156–163. DOI: 10.1016/j.meatsci.2014.10.008.
- De La Roza-Delgado, B.; Soldado, A.; Oliveira, A.; Martinez-Fernandez, A.; Argamenteria, A. Assessing the Value of a Portable near Infrared Spectroscopy Sensor for Predicting Pork Meat Quality Traits of “Asturcelta Autochthonous Swine Breed”. Food Analytical Methods 2014, 7, 151–156. DOI: 10.1007/s12161-013-9611-y.
- Yu, H.-Y.; Niu, X.-Y.; Lin, H.-J.; Ying, Y.-B.; Li, -B.-B.; Pan, -X.-X. A Feasibility Study on On-Line Determination of Rice Wine Composition by Vis-NIR Spectroscopy and Least-Squares Support Vector Machines. Food Chemistry 2009, 113, 291–296. DOI: 10.1016/j.foodchem.2008.06.083.
- Suykens, J. A. K.; Gestel, T. V.; Brabanter, J. D.; Moor, B. D.; Vandewalle, J. Least Squares Support Vector Machines World Scientific Press: River Edge, 2002.
- Vapnik, V. N.;. The Nature of Statistical Learning Theory. Springer Press: New York, 1995.
- Thissen, U.; Ustün, B.; Melssen, W. J.; Buydens, L. M. Multivariate Calibration with Least-Squares Support Vector Machines. Analytical Chemistry 2004, 76, 3099–3105. DOI: 10.1021/ac035522m.
- Shen, F.; Niu, X.-Y.; Yang, D.-T.; Ying, Y.-B.; Li, -B.-B.; Zhu, G.-Q.; Wu, J. Determination of Amino Acids in Chinese Rice Wine by Fourier Transform near Infrared Spectroscopy. Journal of Agricultural and Food Chemistry 2010, 58, 9809–9816. DOI: 10.1021/jf1017912.
- Fu, X.; Ying, Y.; Lu, H.; Xu, H.; Yu, H. FT-NIR Diffuse Reflectance Spectroscopy for Kiwifruit Firmness Detection. Journal of Food Measurement and Characterization 2007, 1, 29–35. DOI: 10.1007/s11694-007-9004-2.
- Cozzolino, D.; Murray, I.; Paterson, R.; Scaife, J. R. Visible and near Infrared Reflectance Spectroscopy for the Determination of Moisture, Fat and Protein in Chicken Breast and Thigh Muscle. Journal of Near Infrared Spectroscopy 1996, 4, 108–114. DOI: 10.1255/jnirs.92.
- Cozzolino, D.; Murray, I.; Scaife, J. R.; Paterson, R. Study of Dissected Lamb Muscles by Visible and near Infrared Reflectance Spectroscopy for Composition Assessment. Animal Science 2000, 70, 417–423. DOI: 10.1017/S1357729800051766.
- Zhang, K.; Tan, Z.; Chen, C.; Sun, X. S.; Wang, D. Rapid Prediction of Oil Content of Camelina Seeds Using Near-Infrared Spectroscopy. Energy Fuel 2017, 31, 5629–5634. DOI: 10.1021/acs.energyfuels.6b02762.
- Liu, F.; He, Y.; Wang, L.; Sun, G. Detection of Organic Acids and pH of Fruit Vinegars Using Near-Infrared Spectroscopy and Multivariate Calibration. Food and Bioprocess Technology 2011, 4, 1331–1340. DOI: 10.1007/s11947-009-0240-9.
- Afseth, N.-K.; Segtnan, V.-H.; Marquardt, B.-J.; Wold, J.-P. Raman and Near-Infrared Spectroscopy for Quantification of Fat Composition in a Complex Food Model System. Applied Spectroscopy 2005, 59, 1324–1332. DOI: 10.1366/000370205774783304.
- Murray, I.; Williams, P. C. Chemical Principals of Near-Infrared Technology American Association of Cereal Chemists Press: Saint Paul, 1987.
- Shenk, J. S.; Workman, J. J.; Westerhans, M. O. Application of NIRS to Agricultural Products Dekker Press: New York, 1992.
- Prieto, N.; Andrés, S.; Giráldez, F.-J.; Mantecón, A.-R.; Lavín, P. Potential Use of near Infrared Reflectance Spectroscopy (NIRS) for the Estimation of Chemical Composition of Oxen Meat Samples. Meat Science 2006, 74, 487–496. DOI: 10.1016/j.meatsci.2006.04.030.
- Rødbotten, R.; Nilsen, B.-N.; Hildrum, K.-I. Prediction of Beef Quality Attributes from Early Post Mortem near Infrared Reflectance Spectra. Food Chemistry 2000, 69, 427–436. DOI: 10.1016/j.meatsci.2008.03.009.
- Cozzolino, D.; Barlocco, N.; Vadell, A.; Ballesteros, F.; Gallieta, G. The Use of Visible and Near-Infrared Reflectance Spectroscopy to Predict Colour on Both Intact and Homogenised Pork Muscle. LWT Food Science and Technology 2003, 36, 195–202. DOI: 10.1016/S0023-6438(02)00199-8.
- Cozzolino, D.; Murray, I. Identification of Animal Meat Muscles by Visible and near Infrared Reflectance Spectroscopy. LWT Food Science and Technology 2004, 37, 447–452. DOI: 10.1016/j.lwt.2003.10.013.
- Leroy, B.; Lambotte, S.; Dotreppe, O.; Lecocq, H.; Istasse, L.; Clinquart, A. Prediction of Technological and Organoleptic Properties of Beef Longissimus Thoracis from Mear-Infrared Reflectance and Transmission Spectra. Meat Science 2004, 66, 45–54. DOI: 10.1016/S0309-1740(03)00002-0.
- Liao, Y.-T.; Fan, Y.-X.; Cheng, F. On-Line Prediction of Fresh Pork Quality Using Visible/Near-Infrared Reflectance Spectroscopy. Meat Science 2010, 86, 901–907. DOI: 10.1016/j.meatsci.2010.07.011.