
 ?Mathematical formulae have been encoded as MathML and are displayed in this HTML version using MathJax in order to improve their display. Uncheck the box to turn MathJax off. This feature requires Javascript. Click on a formula to zoom.
ABSTRACT
The effect of salt concentration on the processing and characteristics of turbot muscle was investigated in this study. The turbot muscle samples were salted with 1%, 5%, 10%, 15%, or 20% w/w salt at 4°C for 3 h. Low-field nuclear magnetic resonance was utilized to characterize water distribution and water holding capacity in the samples. Nuclear magnetic resonance transverse (T2) relaxation identified three water components (T21, T22, and T23) which all exhibited characteristics correlated with water holding capacity. Textural analysis indicated that hardness and elasticity increased with increasing salt concentration. Histological imaging showed that with the increase of salt concentration, the muscle fiber diameter and area increased first and then decreased. The porosity of salted samples was higher than that of fresh ones. It was shown that salting at lower salt concentrations would lead to partial degradation of the fibrin in the tissue samples and the swelling of proteins. In treated samples, 5% w/w salt was shown to produce the best results. This study provides theoretical basis for the development of salted turbot meat products.
Introduction
Cultivation of turbot (Scophthalmus maximus) is a fast-growing aquaculture industry. It is in high demand in countries where consumers prefer white, firm, and flavorful fishes.[Citation1] Turbot is a commercially important marine fish for aquaculture in northern China.[Citation2–Citation4] The harvest of flounder fish was 118,009 tones; it was no. 3 maricultural fish in China in 2016.[Citation5]
Salting is one of the oldest processing and preservation methods for foods. During salting, foods are brought into contact with solid salt, or soaked in brine for extended time. Salting results in the reduction of water activity in foods, which subsequently leads to the inhibition of spoilage. In addition, salting also improves the functional characteristics of proteins in meaty foods[Citation6] and improves the texture and flavor of meat products.
Studies have shown that quality of “pickled” fish is dependent on the level of salt added.[Citation7–Citation9] As the concentration of salt increases, more protein denaturation and fiber shrinkage occur, leading to a decrease in muscle water holding capacity (WHC).[Citation10] The WHC of meat can be defined as its ability to retain its own water as well as added water,[Citation11] and it directly affects meat hardness, tenderness, and yield, thereby influencing meat economic value.[Citation12] Due to its importance, research works have been conducted to better understand and improve WHC.[Citation13,Citation14] Although much information has been gained, there is still a need for better understanding the foundational mechanism of bulk water holding within meat,[Citation15] and the effects of the addition of salt on water distribution and mobility within the protein filament lattice.[Citation16] In recent years, low-field nuclear magnetic resonance (LF-NMR) has been employed to characterize water mobility and distribution within meat.[Citation17] The relaxation data have been shown to correlate well with WHC.[Citation16]
During salting, the microstructure of meat goes through complicated changes that correlate with the loss of water and the changes in texture, and the quality of meat is determined to a large extent by it.[Citation18–Citation20] However, experimental procedures that allow an objective way to quantitatively describe morphological differences and to relate them with macroscopic attributes are generally lacking.[Citation21] For pickled fishes, currently the relationship between processing parameters and quantitative microstructure characteristics remains to be fully explored. Microstructures of fish like turbot observed under microscope, due to its disorderly shape, are not easy to describe in an objective and quantitative way.[Citation22–Citation25]
To our knowledge, no work has been reported on the relationship of salting conditions and changes in microstructural characteristics of turbot. Therefore, in this work, we attempted to describe the quantitative microstructural changes of salted turbot by means of imaging analysis of paraffin sections. In addition, these changes were correlated with the characteristics of salted turbot, as explained by changes in low-field NMR T2 relaxation times, texture, and WHC by principal component analysis (PCA). A thorough comprehension of this relationship is essential to achieve better control of deep processing of turbot fish for quality products.
Materials and methods
Materials and salting
Living turbot fishes (n = 30, 1.3–1.5 kg, and length 38–42 cm) were randomly selected and purchased from a local market (Meilinyuan Market, Dalian, China). Fishes were kept on ice and transported to a laboratory within 0.5 h of purchasing. The fishes were killed by a big bang on the head and were skinned, and then the muscle meat was obtained. The muscle from each fish was cut into cubes of 1.5 × 1.5 × 1.0 cm3 using a stainless steel scalpel. The same amount of fish was soaked in brine at different salt concentrations (1%, 5%, 10%, 15% and 20% w/w); the ratio of fish:brine was 1:3, for 3 h at 4ºC. The raw turbot was used as control.
Measuring water holding capacity
Water holding capacity (WHC, %) was determined according to the method developed by R.M. Uresti.[Citation26] Two layers of the filter paper were put at the bottom of 80 mL centrifuge tubes. Samples of minced fish were weighted (A1), then placed at the bottom of centrifuge tubes and on top of the filter paper, and centrifuged at 1000 r/min×15 min at 4ºC. Immediately after centrifugation, the samples were weighted (A2), and the WHC was calculated as follows:
Measurements were performed in quadruplicate.
Instrumental textural properties
Texture profile analysis (TPA) was performed on turbot samples using TA.XT plus texture analyzer (Stable Micro Systems, Haslemere, Surrey, UK). The size of each muscle sample was 1.5 × 1.5 × 1.0 cm3. The operating parameters were as follows: Model P50 head; pre-test speed 2.0 mm/s, test speed 1 mm/s, and post-test speed 1 mm/s; compressed depth 60%; time interval 5.0 s; compressed times 2. Each treatment was measured with four replicates.[Citation27]
Low-field NMR measurement
A low-field NMR analyzer (LF-NMR, NMI20-030H-I, Suzhou Niumag Analytical Instrument Co., Suzhou, China) equipped with a 30 mm diameter coil and a 0.5 T permanent magnet corresponding to a proton resonance frequency of 23.2 MHz at 32°C was used to collect T2 transverse relaxation data for turbot samples by using a Carr-Purcell-Meiboom-Gill (CPMG) pulse sequence with a τ-value (time between 90 and 180 pulses) of 200 μs. Data from 6000 echoes were acquired as four scans. The LF-NMR relaxation curves were obtained after multi-exponential fitting of CPMG decay curves using MultiExp Inv analysis software (Suzhou Niumag Analytical Instrument Co., Suzhou, China). All measurements were performed with three replicates for each sample.
Histological analysis of microstructure
Turbot samples (1.5 × 1.5 × 1.0 cm3) were salted for 3 h at 4ºC by soaking in brine of 1%, 5%, 10%, 15%, and 20% w/w salt concentrations, respectively. Post-salting, samples were rinsed with deionized water and blotted dry. A non-treated sample was used as the control. Samples were immediately fixed in a 10% formaldehyde solution (AR, Tianjin Shigeru chemical reagent, China) for 24 h. Imaging slides for each sample were prepared by paraffin section and hematoxylin and eosin staining technique.
A microscopic imaging system (Model No. DP72, Labophot-2, Olympus, Japan) was used to examine the effect of salt concentration on fibers. Images for each sample were generated with three slides. Ten sites were selected at random for image acquisition from each slide. Images were analyzed using Image-pro plus software (Version 6.2.1, Media Cybernetics, USA) to obtain the area and diameter of each microfiber.
Statistical analysis
Statistical treatment of the results was performed using Statistical Analysis System IBM SPSS (Statistical Package for the Social Sciences) statistics v19.0 (SPSS Inc., USA). One-way analysis of variance (ANOVA) was employed to determine the significance of main effects by means of Duncan’s multiple range test with a significant level of p < 0.05. All the figures were plotted using Origin 8.5 software (Microcal, USA). PCA was conducted to find the main variations in the multivariate data and determine the relationship between the WHC, textural quality characteristics, LF NMR data, and microstructure characteristics during turbot salting by using Statistica 8.0 analysis software.[Citation28,Citation29]
Results and discussion
WHC
WHC is one of the most important processing properties of fish. The WHC of salted turbot muscle increased at 1% salt concentration compared to control, but decreased with increasing salt concentration, as shown in (p < 0.05). At lower salt concentration, salt increases the ionic strength in the muscle, which favors myosin B transitioning into the sol state, and may lead to the increase of WHC and the occurrence of additional water absorption. With the salt concentration continue to increase, proteins are now exposed to high levels of salt present in the brine, and the resulted protein degradation and fiber shrinkage may lead to decreased WHC.[Citation10,Citation30]
Figure 1. Effect of salt on WHC of turbot (mean ± SD, n = 4). *Different letters indicate significant differences (p < 0.05) between treatments.
TPA
Salted fish would dehydrate, leading to textural changes reflected in changes of sensory attributes. In this work, hardness and elasticity changes of the turbot salted at different brine concentrations were investigated, as shown in and , respectively. Toyohara[Citation31] pointed out that the connective tissue around fresh fish muscle cells helps maintain good texture characteristics in the muscle, while the dissolution of the gluing tissue may cause the fish to become tenderer. As shown in , the hardness of the fish increases with an increase in salt concentration. As more salt enters the muscle, its protein denatures, and protein surface structures change, with more hydrophobic groups exposed. Hence, association between water and proteins weakens, and the water film between protein molecules starts to disappear, causing more intermolecular collisions and aggregation. The fish muscle loses water in this concentration range of salt, and the microbial growth is inhibited. At the same time, the endogenous autolytic enzymes are also inhibited. Denaturation of muscle proteins at high salt content renders its structures more rigid, and increases the hardness in turn.[Citation32] On the other hand, salt may also cause salt-soluble proteins to dissolve and form into a sol-gel. The formation of salt-soluble protein sol-gel may lead to an increase in elasticity in the turbot, as evidenced by .
Figure 2. Effect of salt on hardness of turbot (mean ± SD, n = 4). *Different letters indicate significant differences (p < 0.05) between treatments.
Figure 3. Effect of salt on elasticity of turbot (mean ± SD, n = 4). *Different letters indicate significant differences (p < 0.05) between treatments.
Proton relaxation determined by NMR
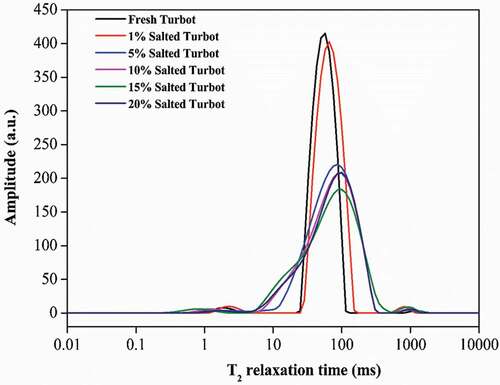
The longitudinal relaxation time T1 and the transverse relaxation time T2 determined from low-field NMR spectra are time constants used to describe the proton relaxation process, especially protons (i.e., H) in H2O. Compared with T1, T2 is more sensitive to the presence of multiphase morphology. The T2 relaxation time reflects the chemical environment of the proton in the sample, which is related to the binding force and freedom of the proton. The larger the proton bound or the smaller the degree of freedom, the shorter the relaxation time of T2, and the longer the T2 relaxation.[Citation33] Differences in T2 can be attributed to water state in a food sample. It can be used to distinguish between free water and crystal water that does not interact with solid particles or solvent, or chemically bound water. Therefore, the determination of water state in food is typically through the study of transverse relaxation time T2.[Citation34,Citation35]
As shown in , three peaks could be identified in LF-NMR T2 spectra of turbot samples, which corresponded to three types of water: T21 peak has a relaxation time of 1–5 ms, which corresponds to tightly bound water molecules at the fish surface; T22 peak has a relaxation time of 50–150 ms, representing immobilized water existing between fibrils, myofibrils, and membranes; T23 peak has a relaxation time of 700–1500 ms, characterizing free water residing in muscle fibers outside the fiber bundle. Interestingly, these three peaks appeared to be affected differently by salting. As shown in , for T21 values, significant variations were observed among samples treated with brine of different salt concentrations of 1%, 5%, and 15%, but no significant difference was found between samples treated with concentrations of 10% and 20%. T22 values varied significantly between no or low salt condition (1%) and high salt conditions (>5% salt). T23 values in contrast were significantly affected by salting, regardless of the salt concentration though. ATotal indirectly reflected the total amount of H (i.e., total amount of H2O) in the sample. Compared with the fresh turbot, the changes in ATotal suggested that salting affected water loss in samples. The relative peak area of the sample treated with 1% brine increased, consistent with the overall increase of WHC in those samples. Jiang[Citation36] proposed that the protein structure and the spatial arrangement of muscle tissue would affect water distribution. In this study, at low salt concentration of 1%, water absorption seems to occur mainly due to weak interaction between muscle proteins and water molecules that brings in mostly free water and immobilized water (i.e., T22 and T23).
Table 1. NMR parameters obtained from different treatments with turbot.
Figure 4. T2 relaxation spectra for turbot during different concentrations of salting.
Histological characterization of microstructure
The salted fish muscle contains large amounts of water, not only in inter-filament spaces within the myofibrils, but also in extracellular spaces and in spaces between myofibrils.[Citation33] The water molecules have different mobilities, due to their different degrees of association with the proteins and salt as well. Analysis of images () showed that all salt concentrations caused shrinkage of muscle fibers in comparison with the fresh control. Fresh turbot muscle fiber was closely arranged with fewer voids in between. As the concentration of salt increased, the arrangement of fibers became more and more disordered. At 1% salt, the sample showed similar fiber arrangement as in fresh samples; fiber swelling and coarsening became more apparent as salt concentration increased. The swelling of turbot muscle fibers was most visible with 5% salt. Higher concentration (15% and 20% salt) of salt indeed inhibited fiber swelling. It caused more fiber fracture and fragmentation, while the difference between the 15% and 20% salt-treated samples was not significant. This is similar to the findings of Knight and Parsons who reported that varying degrees of myofibrillar swelling occur at different NaCl concentrations.[Citation37]
Figure 5. Effect of salt on the longitudinal section muscle of turbot.
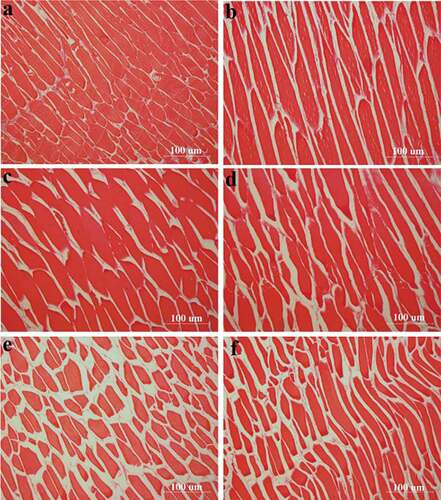
As histological parameters () showed, the largest amount of swelling was caused by 10% w/w salt, evidenced by the largest overall fiber area and diameter. It was significantly larger than the swelling observed with other treatments (). Histologically, samples treated with 20% w/w salt did not differ significantly from samples treated with 15% w/w salt, nor did it differ significantly from fresh control. The average fiber diameter reached the maximum in samples treated with 5% w/w salt. The swelling might be due to water being absorbed into fibrin which leads to an increase in both fiber area and fiber diameter. Earlier reports showed that under <10% w/w low salt conditions, water absorption might occur, which could result in an increase in fiber porosity, consistent with the results of this study.
Table 2. Least-square means of histological variables as affected by salt concentration.
Principal component and correlation analysis of low-field NMR, WHC, TPA, and histological microstructure data
It is well known that microstructure plays a critical role in determining meat physical properties, such as WHC, but an objective method to measure such influence is still lacking due to the difficulty of quantitative description of the microstructure. In this work, we aim to establish a correlation between microstructural changes during salting and the physical characteristics of the fish.[Citation38]
Correlations were found between some LF-NMR parameters, WHC, and histological variables. Analysis of the histological images () along with correlations between histological variables and LF-NMR parameters () further enhanced our understanding of water distribution within the fish as affected by salt concentration.[Citation30] As shown in , the porosity of muscle fibers is positively correlated with the T22 intensity. Good correlations are also obtained between WHC and the relaxation times, the intra-myofibrillar water peak (A21) and the extramyofibrillar water peak (A22), with the strongest influence on WHC from immobilized water (A22). It was previously presumed that T22, which is an indicator of immobilized water, was closely correlated with drip loss.[Citation39] Our results confirmed it. WHC showed a strong, negative correlation with T22, which implied that drip loss would be positively correlated with T22. These results, in agreement with those of Bertram et al.,[Citation40] also confirmed that WHC is strongly affected by structural changes to the myofibril (i.e., porosity), which lead to changes in water distribution inside and outside of the myofibril.
Table 3. The correlation analysis of low-field NMR, WHC, TPA, and histology microstructure data.
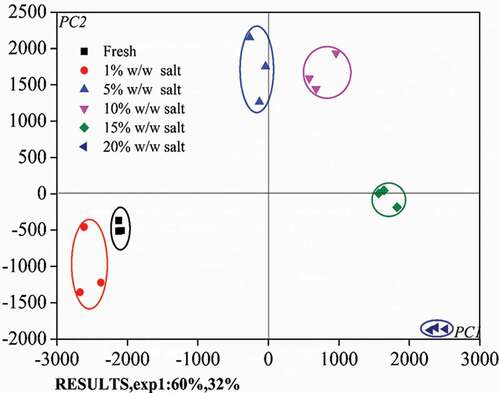
A visualized comparison between samples treated differently can be made by plotting the first two PC scores calculated from a group of variables defined by the LF-NMR, WHC, TPA, and histological microstructure data. The score plot using PC1 and PC2, which accounts for 60% and 32% of the total variance, is shown in . Clearly, samples closely clustered into groups defined by salt concentration. Furthermore, the high salt concentration samples (10%, 15%, and 20% w/w salt) all fall within the right-hand quadrant, i.e., for the scores of PC1 > 0, while the low salt concentration samples (fresh, 1% and 5% w/w salt) locate on the left-hand side. Hence, it suggests that a critical salt concentration may exist between 5% and 10% for the turbot salting operation.
Figure 6. Results of the PCA—score plots in the PC1 vs. PC2 plane for all samples tested.
Conclusion
Findings of this study further confirm traditional WHC theories; that is, WHC is mainly dependent on the ability of the muscles to retain immobilized water; LF-NMR provided further evidence that changes in the fish muscle fiber matrix, water molecule distribution, and water mobility are all correlated with fish WHC. An increase in T22 may be attributed to protein denaturation, and the subsequent loss of protein side chains may reduce sites for water binding. In order to have maximum WHC, intra-myofibrillar water should be increased, and extra-myofibrillar water should be decreased. This can be best achieved by salting turbot with 5% w/w brine concentration. Findings of this study could be utilized to optimize fish picking process to improve product quality.
Additional information
Funding
Related Research Data
References
- Martinez, B.; Miranda, J. M.; Nebot, C.; Rodriguez, J. L.; Cepeda, A.; Franco, C. M. Differentiation of Farmed and Wild Turbot (Psetta maxima): Proximate Chemical Composition, Fatty Acid Profile, Trace Minerals and Antimicrobial Resistance of Contaminant Bacteria. Food Science and Technology International 2010, 5, 435–441. 10.1177/1082013210367819
- Lee, J. K.; Cho, S. H.; Park, S. U.; Kim, K.-D.; Lee, S.-M. Dietary Protein Requirement for Young Turbot (Scophthalmus maximus L.). Aquaculture Nutrition 2003, 9, 283–286. 10.1046/j.1365-2095.2003.00255.x
- Rodriguez, Ó.; Barros-Velazquez, J.; Ojea, A.; Pineiro, C.; Aubourg, S. P. Evaluation of Sensory and Microbiological Changes and Identification of Proteolytic Bacteria during the Iced Storage of Farmed Turbot (Psetta maxima). Journal of Food Science 2003, 68, 2764–2771. 10.1111/j.1365-2621.2003.tb05802.x
- Casas, L.; Sanchez, L.; Orban, L. Sex-Associated DNA Markers from Turbot. Marine Biological Research 2011, 7, 378–387. 10.1080/17451000.2010.515226
- Zhang, X. L.; Fishery Statistics Yearbook, 2017; Agricultural Press: Beijing, China, 2016.
- Offer, G.; Trinick, J. On the Mechanism of Water Holding in Meat: The Swelling and Shrinking of Myofibrils. Meat Science 1983, 8, 245–281. 10.1016/0309-1740(83)90013-X
- Wang, H.; Luo, Y. K.; Yin, X. F.; Wu, H.; Bao, Y. L.; Hong, H. Effects of Salt Concentration on Biogenic Amine Formation and Quality Changes in Grass Carp (Ctenopharyngodon idellus) Fillets Stored at 4 and 20 ˚C. Journal of Food Protection 2014, 77, 796–804. 10.4315/0362-028X.JFP-13-244
- Zhang, Y. M.; Qin, N.; Luo, Y. K.; Shen, H. X. Effects of Different Concentrations of Salt and Sugar on Biogenic Amines and Quality Changes of Carp (Cyprinus carpio) during Chilled Storage. Journal of the Science of Food and Agriculture 2015, 95, 1157–1162. 10.1002/jsfa.2015.95.issue-6
- Rizo, A.; Fuentes, A.; Fernandez-Segovia, I.; Barat, J. M. Smoke-Flavoured Cod Obtained by a New Method Using Water Vapour Permeable Bags. Journal of Food Engineering 2016, 179, 19–27. 10.1016/j.jfoodeng.2016.01.028
- Feiner, G.; Meat Products Handbook-Practical Science and Technology; Woodhead Publishing Limited: Cambridge, England, 2006.
- Hamm, R.; Biochemistry of Meat hydration. Advance Food Research 1960, 10, 355–463.
- Lonergan, S. M.; Mechanisms of Water-Holding Capacity of Meat: The Role of Postmortem Biochemical and Structural Changes. Meat Science 2005, 71, 194–204. 10.1016/j.meatsci.2005.04.022
- Bertram, H. C.; Meyer, R. L.; Wu, Z. Y.; Zhou, X. F.; Andersen, H. J. Water Distribution and Microstructure in Enhanced Pork. Journal of Agricultural and Food Chemistry 2008, 56, 7201–7207. 10.1021/jf8007426
- Pearce, K. L.; Rosenvold, K.; Andersen, H. J.; Hopkins, D. L. Water Distribution and Mobility in Meat during the Conversion of Muscle to Meat and Ageing and the Impacts on Fresh Meat Quality attributes – A Review. Meat Science 2011, 89, 111–124. 10.1016/j.meatsci.2011.04.007
- Puolanne, E.; Halonen, M. Theoretical Aspects of Water-Holding in Meat. Meat Science 2010, 86, 151–165. 10.1016/j.meatsci.2010.04.038
- Bertram, H. C.; Andersen, H. J.; Karlsson, A. H. Comparative Study of Low-Field NMR Relaxation Measurements and Two Traditional Methods in the Determination of Water Holding Capacity of Pork. Meat Science 2001, 57, 125–132. 10.1016/S0309-1740(00)00080-2
- Bertram, H. C.; Andersen, H. J. Applications of NMR in Meat Science. Annual Reports NMR Spectroscopy 2004, 53, 157–202.
- Hao, Z. N.; Dong, H.; Li, Z. X.; Lin, H. Analysis of Physicochemical Properties during the Processing of Yiluxian, a Traditional Chinese Low-Salt Fish Product. International Journal of Food Science and Technology 2016, 51, 2185–2192. 10.1111/ijfs.13171
- Zheng, J.; Zhang, F. S.; Zhou, C. H.; Chen, G. G.; Lin, M.; Kan, J. Q. Changes in Amino Acid Contents, Texture and Microstructure of Bamboo Shoots during Pickling Process. International Journal of Food Science & Technology 2013, 48, 1847–1853. 10.1111/ijfs.12160
- García-Fillería, S. F.; Tironi, V. A. Application of Amaranth Protein Isolate and Hydrolysate on a Reduced Salt Fish Restructured Product: Antioxidant Properties, Textural and Microbiological Effects. International Journal of Food Science and Technology 2015, 50, 1452–1460. 10.1111/ijfs.12777
- Han, M. Y.; Wang, P.; Xu, X. L.; Zhou, G. H. Low-Field NMR Study of Heat-Induced Gelation of Pork Myofibrillar Proteins and Its Relationship with Microstructural Characteristics. Food Research International 2014, 62, 1175–1182. 10.1016/j.foodres.2014.05.062
- Eleya-Ould, M. M.; Ko, S.; Gunasekaran, S. Scaling and Fractal Analysis of Viscoelastic Properties of Heat-Induced Protein Gels. Food Hydrocolloids 2004, 18, 315–323. 10.1016/S0268-005X(03)00087-0
- Hermansson, A.-M.; Microstructure of Protein Gels Related to Functionality. Protein Structure–Function Relationships in Foods 1994, 1, 22–42.
- Langton, M.; 9strom, A.; Hermansson, A.-M. Texture as a Reflection of Microstructure. Food Quality and Preference 1996, 7, 185–191. 10.1016/S0950-3293(96)00030-4
- Marangoni, A. G.; Barbut, S.; McGauley, S. E.; Marcone, M.; Narine, S. S. On the Structure of Particulate Gels – The Case of Salt-Induced Cold Gelation of Heat-Denatured Whey Protein Isolate. Food Hydrocolloids 2000, 14, 61–74. 10.1016/S0268-005X(99)00046-6
- Uresti, R. M.; Lopez-Arias, N.; Gonzalez-Cabriales, J. J.; Ramirez, J. A.; Vazquez, M. Use of Amidated Low Methoxyl Pectin to Produce Fish Restructured Products. Food Hydrocolloids 2003, 17, 171–176. 10.1016/S0268-005X(02)00049-8
- Dong, X. P.; Wu, Q.; Li, D. Y.; Wang, T.; Pan, J. F.; Zheng, J. J.; Fu, X. X.; Qi, L. B.; Chen, G. B. Physicochemical, Micro-Structural, and Textural Properties of Different Parts from Farmed Common Carp (Cyprinus Carpio). International Journal of Food Properties 2017, 20, 946–955. 10.1080/10942912.2016.1190375
- Jolliffe, I. T.; Principal Component Analysis; Springer: New York, USA, 2002.
- Xu, X. L.; Han, M. Y.; Fei, Y.; Zhou, G. H. Raman Spectroscopic Study of Heat-Induced Gelation of Pork Myofibrillar Proteins and Its Relationship with Textural Characteristic. Meat Science 2011, 87, 159–164. 10.1016/j.meatsci.2010.10.001
- Ciara, K. M.; Paul, A.; Elaine, D.; Joshua, M. A.; Eoin, C.; Gearoid, D.; James, G. L. The Effect of Salt and Fibre Direction on Water Dynamics, Distribution and Mobility in Pork Muscle: A Low Field NMR Study. Meat Science 2013, 95, 51–58.
- Toyohara, M.; Texture Changes Associated with Insolubilization of Sarcoplasmic Proteins during Salt-Vinegar Curing of Fish. Food Science 1999, 5, 804–807. 10.1111/j.1365-2621.1999.tb15916.x
- Toyohara, M. Fisheries Science. Beijing. Agriculture Press: China, 2000.
- Han, M. Y.; Zhang, Y. J.; Fei, Y.; Xu, X. L.; Zhou, G. H. Effect of Microbial Transglutaminase on NMR Relaxometry and Microstructure of Pork Myofibrillar Protein Gel. European Food Research and Technology 2009, 228, 665–670. 10.1007/s00217-008-0976-x
- Carneiroa, C. S.; Mársicob, E. T.; Resende-Ribeirob, R. O.; Conte-Júniorb, C. A.; Manob, S. B.; Cesar-Augustoc, C. J.; Oliveira-Jesusd, E. F. Low-Field Nuclear Magnetic Resonance (LF NMR 1H) to Assess the Mobility of Water during Storage of Salted Fish (Sardinella brasiliensis). Journal of Food Engineering 2016, 169, 321–325. 10.1016/j.jfoodeng.2015.09.010
- Ruth, H.; Joachim, G.; Michael, N.; Alan, W.; Hermann, E.; Horst, W. Characterisation of the Water-Holding Capacity of Fresh Cheese Samples by Means of Low Resolution Nuclear Magnetic Resonance. Journal of Food Research International 2004, 37, 667–676. 10.1016/j.foodres.2004.02.005
- Jiang, X. W.; Relationship between Water Distribution, Antionxidation and Water-Holding Capacity in Fresh Pork Meat; Zhejiang Gongshang University: Hang Zhou, China, 2009.
- Knight, P.; Parsons, N. Action of NaCl and Polyphosphates in Meat Processing: Responses of Myofibrils to Concentrated Salt Solutions. Meat Science 1988, 24, 275–300. 10.1016/0309-1740(88)90040-X
- Hermansson, A. M.; Buchheim, W. Characterization of Protein Gels by Scanning and Transmission Electron Microscopy A Methodology Study of Soy Protein Gels. Journal of Colloid and Interface Science 1981, 81, 519–530. 10.1016/0021-9797(81)90433-1
- Bertram, H. C.; Dønstrup, S.; Karlsson, A. H.; Andersen, H. J. Continuous Distribution Analysis of T2 Relaxation in Meat – An Approach in the Determination of Water-Holding Capacity. Meat Science 2002, 60, 27–285. 10.1016/S0309-1740(01)00134-6
- Bertram, H. C.; Purslow, P. P.; Andersen, H. J. Relationship between Meat Structure, Water Mobility, and Distribution: A Low-Field Nuclear Magnetic Resonance Study. Journal of Agricultural and Food Chemistry 2002, 50, 824–829. 10.1021/jf010738f