
 ?Mathematical formulae have been encoded as MathML and are displayed in this HTML version using MathJax in order to improve their display. Uncheck the box to turn MathJax off. This feature requires Javascript. Click on a formula to zoom.
ABSTRACT
Variability and sensitivity of a portable electronic nose (32 sensors) was assessed by considering different variables for measurement (i.e., reference, standard, first and second purges, sample draw time, waiting time for the volatiles released in the headspace, and mass of sample or headspace volume of the jar containing sample). In this study, dried date-pits were used a model sample. The highest stability was achieved when both reference and standard (i.e., dried date-pits, no heating treatment) were used before test sample measurement. Higher sample draw time more than 10 s significantly decreased the stability, whereas optimum second purge was observed at 50 s. Optimum time to generate volatile was observed as 24 h. A sample of 100 g increased the signal intensity compared to the 50 g sample for the 60°C and 100°C treated samples, while an opposite trend was observed for the 150°C treated sample. Finally, the responses of volatile components in date-pits heated at different temperatures (60°C, 100°C, and 150°C) were measured using the optimum operating conditions. Principal component analysis explored the relationships between the volatile features and classified date-pits heated at different temperatures. The results showed that an electronic nose was able to classify date-pits based on their volatile components generated by different degrees of heating (93.3% accuracy).
Introduction
Odor is one of the important sensory attributes for foods. In any food product, odors are formed during its processing and storage by microbial, physicochemical, biochemical, and structural changes. These changes caused formation of different volatiles, which could be related to the different properties of foods. The traditional instruments, such as gas chromatography (GC), gas chromatography/chemiluminescence (GC/SCD), and gas chromatography/mass spectrometry (GC/MS), are commonly used to detect odors in foods. These methods are destructive, time-consuming, very expensive, and bulky.[Citation1] In addition, these need extensive operational skills. There is a need to develop robust, reliable, and satisfactory methods to measure quality of foods. These methods should be easy, fast, portable, and reliable. The new technologies related to electronic nose (e-nose) are being used to assess the quality of foods similar to human olfactory senses. An e-nose consists of an array of electronic sensors for detection of volatile chemical and a mechanism for pattern recognition, such as classification, discrimination, and recognition of volatile chemicals occurring in various kinds of samples.[Citation2,Citation3] Persaud and Dodd[Citation4] first reported a design of e-nose (a sensor array) to analyze the pattern of a pre-defined set of volatiles.
There are two important issues for volatile pattern recognition: first is the operation of the e-nose under optimum conditions, and second is analyzing data for extracting patterns or features. The optimum operating conditions need to be used to extract the features in the volatiles.[Citation5] The applied data analyzing methods include regression, self-organizing map,[Citation3] principal component analysis (PCA),[Citation5,Citation6] partial least-square analysis,[Citation7] partial least-square discriminate analysis,[Citation8,Citation9] cluster analysis,[Citation6,Citation10] neural network and fuzzy logic,[Citation10,Citation11] and support vector machine analysis. [Citation12]
It is common to measure the types of volatiles formed as a function of different microbial spoilage of fish.[Citation13] Di Natale et al.[Citation8] used an e-nose to determine the freshness of fish by measuring the headspace gas during storage of fish. Olafsdbttir et al.[Citation7] observed correlations of e-nose signals with sensory attributes (sweet/sour, rancid odor, and off-odor), total viable count, and lactic acid bacteria during spoilage of cold smoked Atlantic salmon. The headspace gas of tomatoes during storage was measured by e-nose and used to classify tomatoes during different days of storage. [Citation6] In addition, different cultivars could also be classified by e-nose. Pei et al.[Citation14] classified the mushroom sample as a function of drying time. Hai and Wang[Citation11] determined the adulteration of maize oil in sesame oil from the headspace gas analysis by e-nose. There are numbers of parameters affecting the stability of the e-nose data. Specific parameters are checked by researchers; however, there are negligible papers available considering the effects of diversified parameters on the stability of the e-nose data. In addition, in most of the cases the parameters were selected without thoroughly checking their effects on the stability of the e-nose data. Therefore, the main objective of this study was to assess the performance (i.e., stability) of an e-nose (Cryanose 320) by considering the effects of reference, standard, sample draw time, second purge, waiting time for the volatiles release in the headspace, and mass of sample or headspace volume of a jar containing sample. Dried date-pits heated at 60°C, 100°C, and 150°C for 1 h were used as a model sample to assess the performance.
Materials and methods
Materials
Date-pits (50 kg) in a bag were purchased from a local date fruit syrup producer. One kilogram of pits were dipped in 2 kg hot tap water (i.e., 70°C) and stirred for 5 min, and then water was drained out. These steps were followed for three to five times until sticky components remained on the pit surface. The washed date-pits were then dried under sun (temperature: 35–40°C) for 24 h and stored at room temperature (i.e., 20°C) until used for further treatment.
E-nose
The portable e-nose (Cryanose 320, Intelligent Sensing Solutions) manufactured from Sensigent, California, USA, was used in this work. It consisted of arrays of 32 individual polymer sensors blended with carbon black composite and configured as an array.[Citation15] Steps used to measure the headspace gas were as follows: e-nose probe was inserted inside the headspace of the sample bottle and experimental run was then started automatically after pressing the on-key (i.e., baseline purge when sample draw was closed, sample draw followed by first air purge and second air purge, i.e., cleaning the sensors). The equipment had two purge options with different gases. In these experiments, air was used for both purges to clean the sensors. After completion of the sample draw step, the readings of 32 sensors were taken and recorded in the software. All readings of the 32 sensors were extracted and further analyzed.
Optimization e-nose parameters
Five plastic food grade bottles (size: 300 mL, diameter at the body: 6.7 cm, diameter at the neck: 5.5 cm, and height: 9 cm) were filled with 50 g (sample height: 2.5 cm, headspace height: 6.5 cm) or 100 g (i.e., sample height: 4 cm, headspace: 5 cm) of date-pits each. Each jar contained two holes (i.e., 2 mm diameter): one for inserting an e-nose probe and another one to avoid vacuum inside the headspace during suction of the e-nose. Both holes were kept open only during measurement. The second hole was used to avoid vacuum and this could restrict the flow of dust over the e-nose sensors. The holes were covered with sticky plastic tape all time and it was removed during e-nose measurement only.
In the first set of experiments, the effects of first purge, sample draw, and second purge as well as volatiles’ regeneration time in the headspace were studied. In addition, the effect of using a reference or standard was also considered. The room air and dried date-pits (i.e., no heat treatment) were used as reference and standard sample, respectively. In all experiments, the first purge was maintained at 20 s. First experiments were performed with different sample draw times which varied from 10 to 30 s and coefficient of variances (CVs) were determined. The second purge was varied from 10 to 60 s and CVs were determined. Considering these results, the sample draw time of 10 s and the second purge time of 50 s were used for all experiments. Time of volatiles’ regeneration on the headspace was considered as 2, 4, 17, 24, and 32 h. Six replicated samples in six bottles were used to replicate each experiment and CVs were considered as the stability of the e-nose.
Date-pits heated at different temperatures
Dry date-pits were heated in an oven at 60°C, 100°C, and 150°C for 1 h. Heated date-pits (100 g) at different temperatures were placed inside plastic bottles and stored for 24 h in order to release volatiles in the headspace. Six replicated samples were used for each sample and ten replicated readings were taken for each sample. The classification accuracy was determined considering correct classified sample(s) compared to the total number of samples used for all three temperatures used in this experiment.
Data analysis
The average, standard deviation, and outlier were determined using MS-Excel 2016. PCA, ANOVA, cluster analysis, and correlation were performed using PAST software.[Citation16] Standard was used as dried date-pits (i.e., before heating) and the coefficient of variance (CV) was determined as follows:
Results and discussion
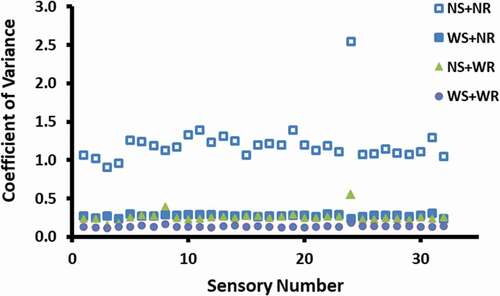
shows the CVs of 32 sensors when reference and standard were used to calibrate the e-nose. Similarly, Steine et al.[Citation17] also used CVs for analyzing sensor’s response. It was clear that the use of reference and standard reduced the variability of the sensors’ reading significantly compared to other runs (P < 0.001). In addition, the use of reference and standard produced consistent reading for all 32 sensors. The drift of the sensor is common for the e-nose and this could be compensated by recalibrating the sensor with known gas.[Citation6,Citation10] It is important to recalibrate the system frequently to ensure that the baseline remains the same.[Citation18] Olafsdottir et al.[Citation19] used four volatiles (guiacol, furfural, ethanol, and butanol) to determine sensitivity and reproducibility of a lab-scale e-nose system.
Figure 1. Effects of reference and standard on the performance as determined by CV (NS: no standard, NR: no reference, WS: with standard, WR: with reference).
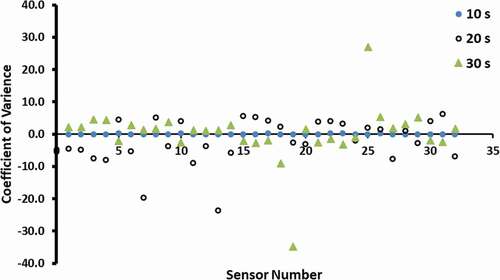
shows the effects of sample draw time on the sensor response. It was observed that the sample draw time of 10 s gave lowest variability and consistency in the readings. Pei et al.[Citation14] used sample draw time as 120 s for dried mushroom. Cluster analysis showed that data sets for 20 and 30 s were completely different groups compared to the 10 s data set. The longer draw time allowed more air to enter inside the bottle (i.e., thru second hole in the jar, which was used to avoid create vacuum in the jar and to avoid particle movement to the sensors); thus, it could cause little dilution of the volatiles inside the headspace. This could result in the variability of the data for longer sample draw time. Therefore, it is important to optimize the sample draw time for obtaining stable results. However, Steine et al.[Citation17] observed that the optimum response time varied from 10 to 90 s, considering different types of sensors and juices used. They also pointed complexity of volatiles’ transport and their interactions with sensors. These interactions resulted from mechanisms of adsorption, desorption, competition, and catalysis on the surface of sensors.
Figure 2. Effects of sample draw time on the performance as determined by CV.
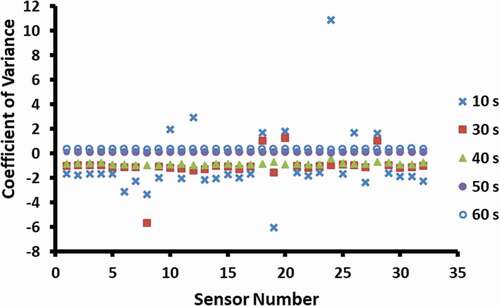
An optimum second purge was observed at 50 s, indicating that all volatiles from sensors can be removed with 50 s purge (). It is necessary to use enough time to remove volatiles from the sensor before taking consecutive readings. Cluster analysis showed that 50 and 60 s data sets were in the same group, while 10, 30, and 40 s data sets were in the different groups. Mielle[Citation2] mentioned that conditioning and cleaning cycle could be up to 40 min. In the case of saffron analysis, Kiani et al.[Citation20] used a purge time of 200 s. In the case of determining the sesame oil with maize oil adulteration, Hai and Wang[Citation11] used a purge time of 100 s to desorb the volatiles from the sensors and enable the signals to return to the baseline. Therefore, cleaning of the sensor could be dependent on the types of sensors as well the types of volatiles in the sample.
Figure 3. Effects of second purge on the performance as determined by CV.
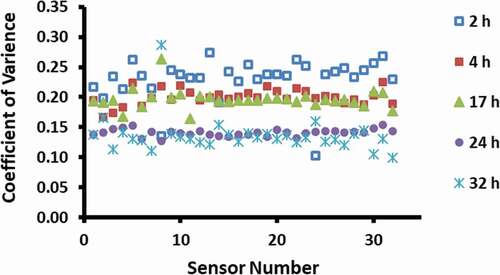
shows that the volatile release time above 24 h was adequate to obtain consistent results of the e-nose signals. Cluster analysis showed that 24 and 32 h data sets were in the same group, while 2, 4, and 17 h data sets were in the different groups. The longer time for the date-pits could be due to the diffusivity of the volatiles in the very compact structure. [Citation21] In the case of headspace analysis of sesame oil, Hai and Wang[Citation11] used 1 h headspace generation time. In the case of fresh fish fillet, stable and sensitive reading could be achieved by allowing 1–5 min to generate headspace gas [Citation8,Citation22], while Kiani et al. [Citation20] used 6 min waiting time. The waiting time could enhance concentration of the headspace before its flow into the sensor and could enhance the sensitivity of the sensors. [Citation23] However, Olafsdottir et al.[Citation24] took ten readings within 10 min with 10 s interval and the average of last three readings was considered for analysis. In this study, consecutive ten readings were taken, while Barbri et al.[Citation12] registered e-nose data for each 2 s for a time interval of 50 min. However, it would be interesting to explore the effects of time interval between each reading taken from the same sample.
Figure 4. Effects of sample draw time on the performance as determined by CV.
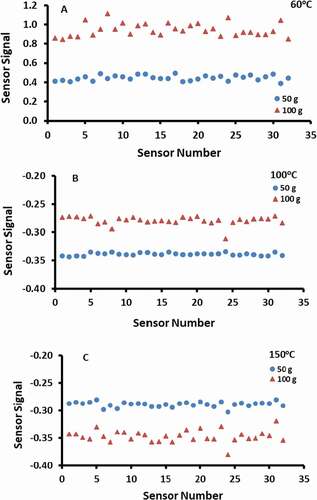
The effects of sample mass on the electrical signal strength of e-nose are shown in . The sample of 100 g showed that the signal intensity increased compared to the 50 g sample for the sample treated at 60°C and 100°C, while it decreased in the case of 150°C. The changes of sensor resistances could either increase or decrease depending on the types of volatiles in the sample and their interactions with the sensors. [Citation1] However, the difference in the date-pits treated with 60°C showed much higher effects compared to the 100°C and 150°C treated samples. Therefore, the effects (i.e., increasing or decreasing intensity) of sample mass could be depended on the types of samples. In addition, the headspace volume decreases as the sample mass is increased if the same volume sample jar is used. Therefore, the effects of sample and headspace volume need to be checked separately in the future works.
Figure 5. Effects of sample mass on the electrical signal of the e-nose sensors for different temperatures of treatments. A: 60°C, B: 100°C, C: 150°C.
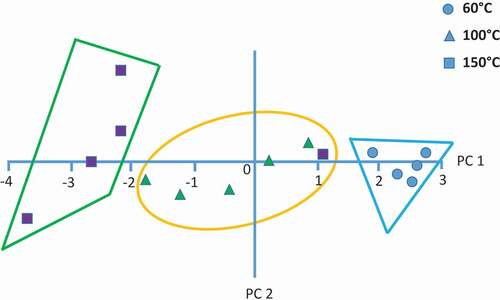
shows the PCA bi-plot of the date-pits treated at 60°C, 100°C, and 150°C. The PCA was able to classify (93.3% accuracy) the date-pits heated at different temperatures considering their volatile features. Severity of the treatment generated different types of volatiles. Heating treatment moved the sample in the negative direction of the PC 1. Similarly in the case of mushroom, extending drying time moved the samples in the regions of negative side of PC 1. [Citation14] However, the samples treated at 60°C showed less variability (i.e., replicates are more close to each other) compared to the samples treated at 100°C and 150°C. The outliers were first excluded from the data set before PCA analysis. Samples of 16.6% data were observed as outliers when a total of 18 samples (i.e., 6 replicates for each treatment) were considered. Di Natale et al.[Citation3] used five replicates, while Barbri et al.[Citation12] used eight replicates for determining freshness of fish; Berna et al.[Citation6] used nine replicates for fresh tomato and Di Natale et al.[Citation8] used 12 replicates for determining fish freshness. It is better to use more replicates and remove the outliers from the data set before exploring the volatile features of a sample.
Figure 6. PCA of e-nose signals for the heated date-pits at different temperatures (100 g samples).
Considering each treated sample, the correlations of the electrical signals from 32 sensors were varied from 0.82 to 0.99, indicating that sensors were excited differently (to some extend) by the types of volatiles present in the date-pits. Hai and Wang[Citation11] observed that correlations between sensors varied within 0.56–0.99 in the case of headspace gas of sesame oil adulterated by maize oil. In the case of meat spoilage, Kodogiannis[Citation9] observed that correlations varied from 0.13 to 0.96 and from 0.31 to 0.98 for AIR and MAP sensors, respectively. The purpose of using 32 sensors was to achieve different selectivity of the sensors by different volatiles. [Citation2] It is good if a wide variation of correlation coefficients is achieved for different sensors, since this indicates the varied selectivity of the 32 sensors and it could capture more features of the varied volatile components. The use of more sensors to explore the volatile features could not be beneficial if a wide range of correlations is achieved.
Conclusion
The results in this study showed that an e-nose should be optimized considering the use of reference and standard, first and second purge times, sample draw time, waiting time for the volatiles released in the headspace, and mass of sample or headspace volume. The optimum conditions could depend on the types of sensors as well as on the types of samples. In addition, outliers need to be excluded from the data set before analyzing data for classification and prediction. The results of PCA showed that an e-nose could be a potential instrument to determine online and offline quality assessment of roasted date-pits and could be used in process control. In addition, it could be used to determine (i.e., very fast) quality levels of the available roasted date-pits in the market.
Acknowledgments
The authors would like to acknowledge the support of the Sultan Qaboos University toward this research in the area of artificial sensors to assess the quality of foods.
Additional information
Funding
References
- Timsorn, K.; Thoopboochagorn, T.; Lertwattanasakul, N.; Wongchoosuk, C. Evaluation of Bacterial Population on Chicken Meats Using a Briefcase Electronic Nose. Biosystems Engineering 2016, 151, 116–125. DOI: 10.1016/j.biosystemseng.2016.09.005.
- Mielle, P. Electronic Noses’: Towards the Objective Instrumental Characterization of Food Aroma. Trends in Food Science and Technology 1996, 7, 432–438. DOI: 10.1016/S0924-2244(96)10045-5.
- Di Natale, C.; Macagnano, A.; D’Amico, A.; Davide, F. Electronic-Nose Modelling and Data Analysis Using a Self-Organizing Map. Measurement Science and Technology 1997, 8, 1236–1243. DOI: 10.1088/0957-0233/8/11/004.
- Persaud, K.; Dodd, G. Analysis of Discrimination Mechanisms in the Mammalian Olfactory System Using a Model Nose. Nature 1982, 299, 352. DOI: 10.1038/299352a0.
- Pardo, M.; Sberveglieri, G. Sensors and Data Analysis for Electronic Nose. Anales De La Asociación Química Argentina 2005, 93, 1–3.
- Berna, A. Z.; Lammertyn, J.; Saevels, S.; Di Natale, C.; Nicolai, B. M. Electronic Nose Systems to Study Shelf Life and Cultivar Effect on Tomato Aroma Profile. Sensors and Actuators B: Chemical 2004, 97, 324–333. DOI: 10.1016/j.snb.2003.09.020.
- Olafsdottir, G.; Chanie, E.; Westad, F.; Jonsdottir, R.; Thalmann, C. R.; Bazzo, S.; Labreche, S.; Marcq, P.; Lundby, F.; Haugen, J. E. Prediction of Microbial and Sensory Quality of Cold Smoked Atlantic Salmon (Salmo Salar) by Electronic Nose. Journal of Food Science 2005, 70(9), S563–S574. DOI: 10.1111/j.1365-2621.2005.tb08330.x.
- Di Natale, C. D.; Olafsdottir, G.; Einarsson, S.; Martinelli, E.; Paolesse, R.; D’Amico, A. Comparison and Integration of Different Electronic Noses for Freshness Evaluation of Cod Fish Fillets. Sensors and Actuators B: Chemical 2001, 77, 572–578. DOI: 10.1016/S0925-4005(01)00692-X.
- Kodogiannis, V. S. Application of an Electronic Nose Coupled with Fuzzy-Wavelet Network for the Detection of Meat Spoilage. Food and Bioprocess Technology 2017, 10(4), 730–749. DOI: 10.1007/s11947-016-1851-6.
- Scott, S. M.; James, D.; Ali, Z. Data Analysis for Electronic Nose Systems. Microchimica Acta 2007, 156, 183–207. DOI: 10.1007/s00604-006-0623-9.
- Hai, Z.; Wang, J. Electronic Nose and Data Analysis for Detection of Maize Oil Adulteration in Sesame Oil. Sensors and Actuators B: Chemical 2006, 119, 449–455. DOI: 10.1016/j.snb.2006.01.001.
- Barbri, N. E.; Llobet, E.; Bari, N. E.; Correig, X.; Bouchikhi, B. Application of a Portable Electronic Nose System to Assess the Freshness of Moroccan Sardines. Material Science & Engineering 2008, 28, 666–670. DOI: 10.1016/j.msec.2007.10.056.
- Olafsdbttir, G.; Martinsdbttir, E.; Oehlenschbger, J.; Dalgaard, P.; Jensen, B.; Undeland, I.; Mackie, I. M.; Henehan, G.; Nielsen, J.; Nilsen, H. Methods to Evaluate Fish Freshness in Research and Industry. Trends in Food Science and Technology 1997, 8, 258–265. DOI: 10.1016/S0924-2244(97)01049-2.
- Pei, F.; Yang, W.; Ma, N.; Fang, Y.; Zhao, L.; An, X.; Xin, Z.; Hu, Q. Effect of the Two Drying Approaches on the Volatile Profiles of Button Mushroom (Agaricus Bisporus) by Headspace GC/MS and Electronic Nose. Food Science and Technology 2016, 72, 343–350.
- Dutta, R.; Hines, E. L.; Gardner, J. W.; Boilot, P. Bacteria Classification Using Cyranose 320 Electronic Nose. Biomedical Engineering Online 2002, 1-7(1), article 4. DOI: 10.1186/1475-925X-1-4.
- Hammer, D.; Harper, D. A. T.; Ryan, P. D. PAST: Paleontological Statistics Software Package for Education and Data Analysis; Palaeontoligical Association: Norway, 2001.
- Steine, C.; Beaucousin, F.; Siv, C.; Peiffer, G. Potential of Semiconductor Sensor Arrays for the Origin Authentication of Pure Valencia Orange Juices. Journal of Agricultural and Food Chemistry 2001, 49, 3151–3160. DOI: 10.1021/jf0014664.
- Fryder, M.; Holmberg, M.; Winquist, F.; Lundstrom, I. A Calibration Technique for an Electronic Nose. Conference Solid-State Sens Actuator, 683, 1995.
- Olafsdottir, G.; Chanie, E.; Westad, F.; Jonsdottir, R.; Bazzo, S.; Labreche, S.; Marcq, P.; Lundby, F.; Haugen, J. E. Rapid Control of Smoked Atlantic Salmon Quality by Electronic Nose: Correlation with Classical Evaluation Methods. In Proceedings of the 11th Intl. Symposium on Olfaction and Electronic Nose, ISOEN2005, 13-15 April, 2005; Marco, S., Montoliu, I., editors; Barcelona: Electronic Dept., Physics Faculty, Barcelona Univ: Barcelona, Spain, 2005; pp. 110–114.
- Kiani, S.; Minaei, S.; Ghasemi-Varnamkhasti, M. A Portable Electronic Nose as an Expert System for Aroma-Based Classification of Saffron. Chemometrics Intelligent Laborary Systems 2016, 156, 148–156. DOI: 10.1016/j.chemolab.2016.05.013.
- Suresh, S.; Guizani, N.; Al-Ruzeiki, M.; Al-Hadhrami, A.; Al-Dohani, H.; Al-Kindi, I.; Rahman, M. S. Thermal Characteristics, Chemical Composition and Polyphenol Contents of Date-Pits Powder. Journal of Food Engineering 2013, 119, 668–679. DOI: 10.1016/j.jfoodeng.2013.06.026.
- Olafsdottir, G.; Nesvadba, P.; Natale, C. D.; Careche, M.; Oehlenschlager, J.; Tryggvadottir, S. V.; Schubring, R.; Kroeger, M.; Heia, K.; Esaiassen, M.; et al. Multisensor for Fish Quality Determination. Trends in Food Science and Technology 2004, 15, 86–93. DOI: 10.1016/j.tifs.2003.08.006.
- Peris, M.; Escuder-Gilabert, L. A 21st Century Technique for Food Control: Electronic Noses. Analytica Chimica Acta 2009, 638(1), 1–15. DOI: 10.1016/j.aca.2009.02.009.
- Olafsdottir, G.; Martinsdotlir, E. H.; Jonsson, E. H. Rapid Gas Sensor Measurements to Predict the Freshness of Capelin (Mallotus Villosus). Journal of Agricultural and Food Chemistry 1997, 45, 2654–2659.