
 ?Mathematical formulae have been encoded as MathML and are displayed in this HTML version using MathJax in order to improve their display. Uncheck the box to turn MathJax off. This feature requires Javascript. Click on a formula to zoom.
ABSTRACT
Hard mung bean seeds pose a problem in the sprouting process as they develop mold and infect neighboring seeds. Near-infrared hyperspectral imaging combined with partial least squares discriminant analysis was applied to develop a classifying model to separate hard mung beans from normal ones. The orientation of the measured beans was found to affect the classification result. The optimal partial least squares discriminant analysis model based on all orientations resulted in a correlation coefficient (R) of 0.919 with a root mean squared error of prediction of 0.197. The non-germinative parts were mapped and were concentrated at one end of the bean. Finally, a germinability index was proposed according to the proportion of colored areas between the germinative and non-germinative parts from the hyperspectral imaging results.
Introduction
The mung bean (Vigna radiata) is one of the essential crops exploited in Thailand due to its high nutritional value. The sprouts of mung beans following germination help to improve the medicinal and nutritional qualities of mung beans[Citation1] through alternative nutritional values, chemical constituents, and metabolites.[Citation2] On the other hand, the existence of hard seeds during seed collection poses a major problem to mung consumption, predominantly during the sprouting or boiling process. The “hardness” of seeds is a physiologically and genetically controlled attribute.[Citation3] In the seed production process, it is necessary to separate hard seeds from regular ones because the hard ones do not germinate during sprouting. As a result, the moist, ungerminated hard seeds easily grow mold and contaminate neighboring sprouting seeds.
At present, the available technique for the separation of hard seeds from normal ones is achieved by reciprocating force on a moving sieve plate. Due to the inclined and reciprocating movement, the hard seeds move to a different distance from the normal seeds leading to their physical separation. However, this method is generally not very effective.
Alternatively, near-infrared spectroscopy (NIRS) has been extensively employed for evaluating the internal quality of beans with the main advantage of only minimum sample preparation being needed.[Citation4–Citation7] On the application of NIRS in a mung bean breeding program, the palmitic, linoleic, and total fatty acid contents were predicted with reliable accuracy using NIR reflectance spectra.[Citation8] Moreover, related to seed conservation, NIRS was reported to be capable of evaluating the contents of amylose, starch, and protein in intact mung bean seeds.[Citation9] The nondestructive feature of the NIRS was reported to offer an advantage in the determination of seed quality as the seed’s vitality could be preserved. NIRS has also been applied to the assessment of the internal quality of certain other beans and seeds.[Citation10] For soybean, NIRS has been utilized and provided significant potential as a rapid and nondestructive technique for the evaluation of fat and crude protein in whole-kernel soybean.[Citation10] Regarding qualitative utilization, transmittance-based NIRS was shown to provide high ability in separating seeds of three species of the Larix tree into insect-infested, filled, and empty categories.[Citation11] The accuracy of the separation has been reported to be as high as 100%.
Currently, NIR hyperspectral imaging (HSI) is being rapidly applied and is widely known for its advantages in offering both spectral and spatial information of the sample simultaneously. Similar to NIRS, NIR-HSI has also been applied for the evaluation of the internal quality of several kernels. In one application, successful discrimination of insect-damaged and healthy wheat kernels was reported by using a scanning range of 1000–1600 nm.[Citation12] Another application related to maize kernels, hyperspectral transmittance values in the range 750–1090 nm were used to predict oil and moisture contents.[Citation13] The investigators showed that the moisture model achieved better performance than the oil model. Further, very soft maize kernels with a lower ratio of vitreous-to-floury endosperm could be effectively discriminated from very hard kernels; thanks to the advantage of NIR-HSI that incorporated both spatial and spectral information.[Citation14] Regarding mung beans, NIR-HSI within the wavelength region of 1000–1600 nm could be applied to detect cowpea weevil infestation.[Citation7] The authors reported that the accuracy in identification of uninfested and infested mung bean kernels was more than 85% and 82%, respectively. There has been no report on the application of NIR-HSI to detect germinative mung bean seeds. Thus, this research investigated the potential of NIR-HSI for the classification between normal and ungerminated mung beans. The classification accuracy between two NIR-HSI systems (different wavelength ranges) was compared. Furthermore, since the mung bean seed is asymmetrical along one axis, the orientation effect of the seed on the spectral information was investigated to obtain a robust classification model for practical industrial use.
Materials and methods
Sample preparation
Mung bean samples (Kamphaengsaen II variety) from two crops were picked and threshed to remove the peels. The seed samples were kept at a temperature of 25°C and a relative humidity of approximately 85% in an air-conditioned laboratory overnight to attain temperature equilibrium of the seeds before measurement.
Spectral image acquisition of bean kernels
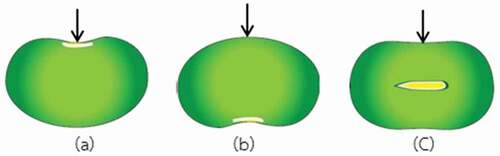
Twenty kernels were placed in four rows of five holes (i.e. one kernel for one hole) on a holder plate made of transparent plastic (). To evaluate the orientation effect of measured samples on the spectral information, all seeds were scanned three times; every time, the seeds were placed in the hole at one orientation relative to the hilum of its axis. In total, three orientations were assigned as hilum-up (HU), hilum-down (HD), and hilum-parallel-to-ground ().
Figure 1. Sample presentation for NIR hyperspectral imaging in wavelength region: (a) 900–1700 nm and (b) 913–2519 nm.
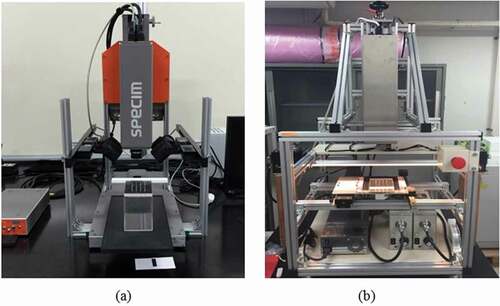
Figure 2. Three orientations of mung bean seed for measurement: (a) hilum up, (b) hilum down, and (c) hilum parallel to the ground.
In this study, two HSI systems were compared. In detail, shows one push broom HSI system, which was described as system A, comprising an imaging spectrograph (Imspector N17E; Specim, Spectral Imaging Ltd., Oulu, Finland), a CCD camera (Xeva 992; Xenics Infrared Solutions, Belgium), two 500 W tungsten–halogen light sources (Lowel Light Inc., NY, USA), and a control software (Specim’s LUMO Software Suite; Spectral Imaging Ltd., Oulu, Finland). All 20 kernels were scanned line by line on a translation stage to acquire the NIR hyperspectral images. The collected hyperspectral images contained both spectral and spatial information in two dimensions with 320 pixels (with a spatial resolution of 30 μm per pixel) in the x-direction and n pixels in the y-direction depending on the sample length. All samples were scanned in the wavelength region 900–1700 nm with a spectral resolution of 3.2 nm being computed from reflected light, and dark and white reference images. The samples were scanned on a translation stage at a speed of 10 mm/s. Following the HSI in the wavelength region 900–1700 nm, the same samples were subjected to the other HSI system (Compovision; Sumitomo Electric Industries, Ltd., Tokyo, Japan) with an extended wavelength range () hereby designated as system B. The hyperspectral images were acquired using the push broom line scanning style. The camera consisted of a spectroscope and a 2D photosensitive element providing 256 pixels (wavelengths from 913 nm to 2519 nm with a spectral resolution of 6.2 nm) × 320 pixels (x-position) with a spatial resolution of 156 μm per pixel. Two halogen lamps were used to provide the light source. The translation stage speed was adjusted to 31.3 mm/s.
Germination test
After HSI, the mung bean seeds were placed on wet paper in a petri dish at a temperature of 25°C for a germination test. The number of germinated seeds and hard seeds was counted on the third day after the beginning of the test.[Citation15]
Removal of background
The reflectance images were imported and further analyzed using the MATLAB R2013a software (MathWorks, Natick, MA, USA) based on Eq. (1): The region of interest was identified by the reflectance value at a wavelength of 968.7 nm where the difference between the background and the sample was largest. Then, the image area with low reflectance corresponding to the background was identified and not used in the analysis.
where λ and n designate the wavelength and pixel index variable, respectively, Rλ,n represents the standardized reflectance at wavelength λ and pixel n, and Sλ,n and Bλ,n are the sample and white reference images, respectively, whereas Dλ,n is the dark image.
Development of classification model
In the development of the classification model, averaged spectra collected from each seed were used. The samples of germinated seeds and nonviable seeds were randomly allocated to a calibration set and a prediction set. The calibration set contained 140 seeds with an equal number of germinated and nonviable seeds. The 60 seeds in the prediction set also consisted of an equal number of the germinated and nonviable seeds. Samples in the calibration set were used to build classification models with the application of partial least squares discriminant analysis (PLS-DA) in the Unscrambler V9.8 program (CAMO, Oslo, Norway). A value of 1 was set for the germinated seeds and 0 for nonviable seeds. The constructed models were cross-validated based on the calibration set to determine the optimum number of PLS factors. The obtained models were used to classify the seed samples in the prediction set to assess the classification performance.
Further models were also developed based on the original spectra pretreated with different techniques to reduce the effect of physical light scattering to improve the classification performance. The techniques for pretreatment involved smoothing, calculation of the first (1D) and second derivatives (2D) of the spectra, multiplicative scatter correction, and standard normal variate, which were individually or jointly applied.
The hilum of the seed is located on one side of the surface and as such causes scattering from the smooth-side surface. Furthermore, when placing the seed on the table, the seed does not assume the same orientation. Therefore, the effect of the hilum orientation on the classification performance was also investigated. Four models based on the spectra from each of three orientations and a combined orientation were developed for comparison. All of the built models were applied to the spectra obtained from both short and long wavelength regions.
Germinability mapping images with prediction on each pixel were further carried out using the MATLAB R2013a software (MathWorks, Natick, MA, USA). The mapping images had the advantage of providing visualization of the spatial distribution of the germinative area. It was useful in the future establishment of the criteria to judge whether the mung bean seed would be germinative by considering the proportion of germinative area in comparison with the whole seed area of the image.
Results and discussion
Absorbance characteristics of mung bean seed
The mung bean seeds absorbed the NIR light with characteristic bands of water at around 990 and 1440 nm and a significant starch band at 1200 nm () which was associated with the second overtone of C–H stretching.[Citation16] This strong starch band verified that the main component in the mung bean seed is starch. Furthermore, dead seeds absorbed less light than healthy seeds in both wavelength ranges. Additionally, a weak band was observed in at 2100 nm (O–H def. + O–H str.) which was correlated with the cellulose content[Citation17] in the mung bean hull.[Citation18] However, there has been a report[Citation19] that germinability of mung bean seed during seed storage decreased with an increase in protein measured by protein fluorescence analysis. This report was in agreement with our analysis that the protein content in normal seeds (24.1 ± 0.5%) was lower than that in hard seeds (26.4 ± 0.3%).
Figure 3. Averaged NIR spectra of normal seeds and dead seeds acquired in wavelength region: (a) 900–1700 nm and (b) 913–2519 nm. (HU: hilum up, HD: hilum down, and HP: hilum parallel to the ground).
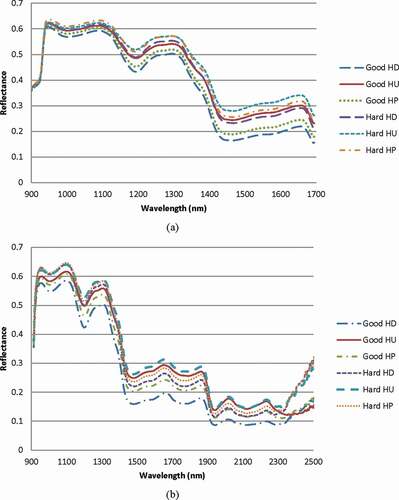
In , noise was clearly present in the reflectance from wavelengths of 2210 nm and higher due to the low sensitivity of the sensor at high wavelengths. also shows the effect of the seed orientation on the absorbance. A similar effect was observed for both wavelength ranges. It was clear that the HD orientation led to the lowest reflectance, whereas the highest reflectance was caused by the HU orientation. One supporting reason was that the HD orientation presented a smooth surface facing the illuminating light resulting in low surface scattering and a low amount of light reflection and thus high absorbance.
Classification
shows the results achieved for the classification between good and hard mung beans with respect to bean orientation. Overall, the HSI system B, with a wavelength range of 913–2519 nm, performed better than system B with an extended wavelength range (900–1700 nm). When considering the effect of the bean orientation, the optimal models based on each orientation of system A yielded good classification performance with root mean squared error of prediction (RMSEP) ranging from 0.192 to 0.215, whereas system B provided a consistent RMSEP of 0.195 for all models with different orientation spectra. These results implied that only system A was affected by the bean orientation. The higher spectral resolution of system A could be a cause for such an effect. In addition, system B used line light sources which provided uniform illumination on the bean while being scanned. This uniform illumination could probably reduce the variation of the bean surface due to different orientations. Comparing the models based on the different orientation spectra of system B, the HD model required the lowest number of factors (i.e. 4 in ) than other orientation models. Similarly, for system A, the 2D model based on the HD reflectance had the best accuracy of classification (R = 0.923 and RMSEP = 0.192 in ) compared to the other orientations. The HD orientation presented the smooth surface of the bean to the camera and thus led to a lower surface-scattering effect than the other orientations.
Table 1. PLS-DA results of classification performance of mung bean based on imaging systems A (900–1700 nm) and B (913–2519 nm).
For further applicability, the model using the reflectance spectra of all orientations was more practicable as it is not necessary to place the seed at any specific orientation for the measurement. Thus, a model based on the spectral information of all orientations was developed. The all-orientations model of system B had better accuracy with R and RMSEP values of 0.920 and 0.196, respectively () compared to the system A (R = 0.894 and RMSEP = 0.224).
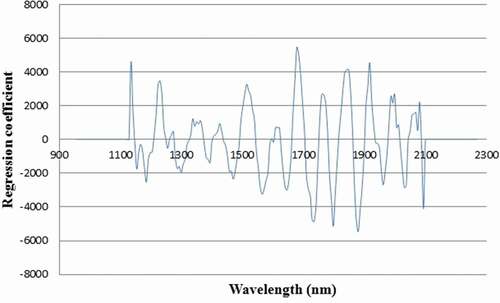
depicts the regression coefficients of the PLS-DA model based on the spectral information from all orientations in the wavelength region 913–2519 nm (system B). Some of the high regression coefficients were observed at 1677, 1797, and 18,799 nm which were assigned, respectively, to: the first overtone of Car–H stretching, attributed to the phenolic and lignin absorption[Citation20]; the first overtone of C–H stretching, related to the cellulose component[Citation21]; and O–H stretching + 2(C–O) stretching with the chemical structure of cellulose.[Citation22] These bands played an important role in the classification between the sound and hard seeds which implied that such components were different between normal and hard seeds.
Figure 4. Regression coefficient of PLS-DA model based on spectra between 913nm and 12519 nm of all-orientation samples from system B.
Visual mapping of germinability
Follow the detection of hard seeds based on the developed models using spectral information, the hardness degree or germinability of the bean could be visualized in the spatial dimension using the spectral images. This technique offered an advantage in displaying the spatial distribution of the germinability level of the samples in each pixel of the image in relation to their spectral information. The all-orientations model of system B was applied to classify each pixel of the prediction seeds into normal (1) or hard (0) pixels. The classified values between 0 and 1 could represent the germinability level. For example, a value from 0.5 to 1.0 suggested a high possibility of germination. shows several examples of the distribution map of the germinability of randomly selected seeds using a linear color scale.
Figure 5. Classification map of mung beans based on spectra between 913 and 2519 nm created using the model of system B based on all-orientation spectra: (a) normal seed and (b) hard seed.
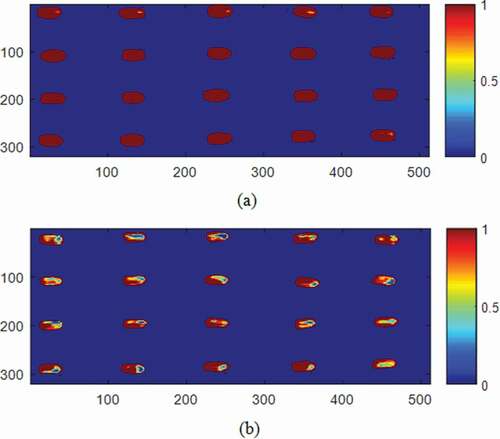
The germinability map obtained using the HSI system B displayed the distribution of germinative parts on the surface of each seed. NIR-HSI can be a nondestructive tool for detection of hard seeds (). It illustrated that most parts of the hard seeds () showed a low possibility of germination. Those non-germinated parts were mostly concentrated at one end of the seeds, whereas there were a few parts of the seeds that were not germinative in the normal seeds (). These findings suggested that the proportion of the ungerminatable parts negatively correlated to the germinability. Hence, the ratio of dark brown color (representing 1 in ) to other colors in ) could be employed as the germinability index. The results from the HSI could lead to the establishment of a standard for the classification of mung beans in the sprouting industry in the future. However, further work needs to be carried out to determine the germinability index.
Conclusions
A combination of NIR-HSI and the PLS calibration technique was used to classify mung bean seeds. Good classification results were obtained in separating mung bean seeds into normal and hard groups. In addition, the high spectral resolution HSI system performed better in the classification than the lower resolution system. The orientation of the bean had an effect on the classification performance which suggested the preferential use of model based on all orientations. The hyperspectral mapping revealed that the parts adjacent to the hilum of the bean contributed to the germinability. The proportion of the color areas between the germinative and non-germinative parts could be used as the index for the germinability.
Acknowledgments
The crop research center in Chainat province, Thailand was also appreciated for provision of the bean samples. The Centre of Advanced Studies in Industrial Technology, Faculty of Engineering, and the Centre of Excellence on Food Agricultural Machinery (Kasetsart University) are also acknowledged for their support.
Additional information
Funding
References
- El-Adawy, T. A.; Rahma, E. H.; El-Bedawey, A. A.; El-Beltagy, A. E. Nutritional Potential and Functional Properties of Germinated Mung Bean, Pea and Lentil Seeds. Plant Foods Human Nutrition (Formerly Qualitas Plantarum) 2003, 58(3), 1–13. DOI: 10.1023/B:QUAL.0000040339.48521.75.
- Tang, D.; Dong, Y.; Ren, H.; Li, L.; He, C. A Review of Phytochemistry, Metabolite Changes, and Medicinal Uses of the Common Food Mung Bean and Its Sprouts (Vigna radiata). Chemistry Central Journal 2014, 8(1), 4. DOI: 10.1186/1752-153X-8-4.
- Rodriguez, F. M.; Mendoza, E. M. T. Physicochemical Basis for Hardseededness in Mung Bean (Vigna radiata (L.) Wilczek). Journal of Agricultural and Food Chemistry 1990, 38(1), 29–32. DOI: 10.1021/jf00091a006.
- Delwiche, S. R.; Pordesimo, L. O.; Scaboo, A. M.; Pantalone, V. R. Measurement of Inorganic Phosphorus in Soybeans with Near-Infrared Spectroscopy. Journal of Agricultural and Food Chemistry 2006, 54(19), 6951–6956. DOI: 10.1021/jf060919n.
- Hacisalihoglu, G.; Larbi, B.; Settles, A. M. Near-Infrared Reflectance Spectroscopy Predicts Protein, Starch, and Seed Weight in Intact Seeds of Common Bean (Phaseolus vulgaris L.). Journal of Agricultural and Food Chemistry 2009, 58(2), 702–706. DOI: 10.1021/jf9019294.
- Haughey, S. A.; Graham, S. F.; Cancouët, E.; Elliott, C. T. The Application of Near-Infrared Reflectance Spectroscopy (NIRS) to Detect Melamine Adulteration of Soya Bean Meal. Food Chemistry 2013, 136(3), 1557–1561. DOI: 10.1016/j.foodchem.2012.01.068.
- Kaliramesh, S.; Chelladurai, V.; Jayas, D. S.; Alagusundaram, K.; White, N. D. G.; Fields, P. G. Detection of Infestation by Callosobruchus maculatus in Mung Bean Using Near-Infrared Hyperspectral Imaging. Journal of Stored Products Research 2013, 52, 107–111. DOI: 10.1016/j.jspr.2012.12.005.
- Lee, Y. Y.; Kim, J. B.; Lee, S. Y.; Kim, M. H.; Lee, J. W.; Lee, H. S.; Ko, H. C.; Hyun, D. Y.; Gwag, J. G.; Kim, C. K.; et al. Determination of Seed Fatty Acids Using Near-Infrared Reflectance Spectroscopy (NIR) in Mung Bean (Vigna radiata) Germplasm. Korean Journal of Food Nutrition 2010, 23, 582–587.
- Wang, L. J.; Liu, S. C.; Me, Y.; Ren, G. X.; Cheng, X. Z. The Development of Near-Infrared Spectroscopy (NIRS) Prediction Model for the Quality Components of Flour and Intact Seed in Mungbean. Journal of Plant Genetic Resources 2013, 14, 833–838.
- Dong, Y.; Qu, S. Y. Nondestructive Method for Analysis of the Soybean Quality. International Journal of Food Engineering 2012, 8(4), art. no. 3. DOI: 10.1515/1556-3758.2511.
- Tigabu, M.; Odén, P. C. Simultaneous Detection of Filled, Empty and Insect-Infested Seeds of Three Larix Species with Single Seed Near-Infrared Transmittance Spectroscopy. New Forests 2004, 27(1), 39–53. DOI: 10.1023/A:1025037408922.
- Singh, C. B.; Jayas, D. S.; Paliwal, J.; White, N. D. G. Detection of Insect-Damaged Wheat Kernels Using Near-Infrared Hyperspectral Imaging. Journal of Stored Products Research 2009, 45(3), 151–158. DOI: 10.1016/j.jspr.2008.12.002.
- Cogdill, R. P.; Hurburgh, C. R.; Rippke, G. R.; Bajic, S. J.; Jones, R. W.; McClelland, J. F.; Jensen, T. C.; Liu, J. Single-Kernel Maize Analysis by Near-Infrared Hyperspectral Imaging. Transactions of ASAE 2004, 47(1), 311–320. DOI: 10.13031/2013.15856.
- McGoverin, C. M.; Manley, M. Classification of Maize Kernel Hardness Using Near Infrared Hyperspectral Imaging. Journal of Near Infrared Spectroscopy 2012, 20(5), 529–535. DOI: 10.1255/jnirs.1018.
- International Seed Testing Association. International Rule for Seed Testing, Handbook on Seeding Evaluation, 3rd ed.; Zurich, Switzerland, 2006.
- Williams, P. Grains and Seeds. In Near-Infrared Spectroscopy in Food Science and Technology. Ozaki, Y., Q4 McClure, W. F., Christy, A. A., Eds.; Hoboken: John Wiley & Sons, 2007; pp 165–217.
- Schwanninger, M.; Rodrigues, J. C.; Fackler, K. A Review of Band Assignments in near Infrared Spectra of Wood and Wood Components. Journal of Near Infrared Spectroscopy 2011, 19(5), 287–308. DOI: 10.1255/jnirs.955.
- Huang, S. C.; Cheng, T. C.; Hwang, D. F. Effect of Mung-Bean Fibre on Acidification in Culture Broths Using Selected Intestinal Microflora. African Journal of Agricultural Research 2013, 8(26), 3362–3367. DOI: 10.5897/AJAR12.505.
- Murthy, U. M.; Liang, Y.; Kumar, P. P.; Sun, W. Q. Non-Enzymatic Protein Modification by the Maillard Reaction Reduces the Activities of Scavenging Enzymes in Vigna radiata. Physiologia Plantarum 2002, 115(2), 213–220. DOI: 10.1034/j.1399-3054.2002.1150206.x.
- Sandak, A.; Sandak, J.; Negri, M. Relationship between Near-Infrared (NIR) Spectra and the Geographical Provenance of Timber. Wood Science and Technology 2011, 45(1), 35–48. DOI: 10.1007/s00226-010-0313-y.
- Ali, M.; Emsley, A. M.; Herman, H.; Heywood, R. J. Spectroscopic Studies of the Ageing of Cellulosic Paper. Polymer 2001, 42(7), 2893–2900. DOI: 10.1016/S0032-3861(00)00691-1.
- Abdel-Zaher, N. A.; Moselhey, M. T. H.; Guirguis, O. W. Optical Studies of Hydroxypropyl Methylcellulose Thin Films Exposed to UV/ozone. Journal of Scientific and Engineering Research 2016, 3, 84–96.