
 ?Mathematical formulae have been encoded as MathML and are displayed in this HTML version using MathJax in order to improve their display. Uncheck the box to turn MathJax off. This feature requires Javascript. Click on a formula to zoom.
ABSTRACT
The study was carried out to establish a formaldehyde (FA) detection method in smoked meat products with ultra-performance liquid chromatography (UPLC) method. The high-performance liquid chromatography method was developed by using steam distillation as extraction method and then derived by2,4-dinitrophenylhydrazine (DNPH). The final optimum conditions of derivatization for UPLC method were determined as follows: DNPH dosage of 0.3 mL, derivatization temperature of 60°C, derivatization time of 60 min, and twice extraction. This method was further applied to determine the content of FA in the smoked meat products from five companies. The internal FA in the smoked meat products ranged from 25.55 mg/kg meat to 49.20 mg/kg meat, and the surface FA was 34.04 mg/kg meat to 165.25 mg/kg meat. Thus, this study establishes a simple, fast, and reliable method for the analysis of FA in smoked meat products.
Introduction
Smoked meat product has been popular all over the world for its easy preservation and unique smoky flavor. However, these meat products have been indicated to be harmful to health due to presence of formaldehyde (FA) and polycyclic aromatic hydrocarbons.[Citation1] FA contents in some meat products could be even as high as 125 mg/kg wet weight.[Citation2] Many methods have been applied to quantify the amount of FA in different food products including coffees,[Citation3] beers,[Citation4] bovine milk,[Citation5] fishes[Citation6], and fruit juice.[Citation7] Weng used heated polydimethylsiloxane microfluidic chip to establish a rapid and simple method for detecting the FA with very small amount of non-smoked food samples (Shiitake mushroom, Pork, Pear, seafood and crustaceans, Ginseng).[Citation8] Wahed et al. applied a sensitive high-performance liquid chromatography (HPLC) method to determine FA in mango, fish, and milk. [Citation6] Bianchi F. et al. determined the FA, which is known to form post-mortem from the enzymatic reduction of trimethylamine-N-oxide, in 12 sea fish species under different circumstances by SPME extraction and GC-MS analysis.[Citation9] Enzymatic method for fish muscle tissues of frozen hake and cod, as well as of freshly killed carp[Citation10] and electrophoretic method for wines and water[Citation11] have also been utilized in FA assay. Wani et al. indicated HPLC-MS/MS method also could be reliable for pharmacokinetic and toxicokinetic study in both animals and humans by determining irbesartan, telmisartan, hydrochlorthiazide, and abiraterone, the results showed that the method was simple, rapid, and highly sensitive.[Citation12–Citation15]
The detection methods described above were not capable of being used for the detection of deposited FA in smoked meat product due to skin, adipose, and muscle tissues with dry and hard texture. Zhu et al. established a spectrophotometry method for extracting FA from smoked meat product.[Citation2] Nevertheless, the detection of FA in smoked meat product by HPLC was rarely reported. Thus, the purpose of this present work was to develop an accurate, sensitive, and selective UPLC method for determining FA in smoked meat product by deriving with 2,4–dinitrophenylhydrazine (DNPH).
Materials and methods
Materials and reagents
Smoked meat samples were purchased from the Meicheng market in Anhua, Hunan Province. Five kinds of vacuum packaged samples (No. 1–5) were bought in supermarkets from five cities of China (Wuhan, Chongqing, Changsha, Meishan, Huaihua). A FA standard was obtained from Sigma Chemical Co., Ltd. (St. Louis, MO, USA). Concentrated hydrochloric acid was purchased from Nanjing Chemical Co., Ltd. (Nanjing, China). Phosphoric acid was purchased from Sinopharm Chemical Co., Ltd. (Shanghai, China). DNPH was purchased from Chengdu Kelon Chemical reagent factory (Chengdu, China). Dichloromethane and methanol were purchased from TEDIA Company (Ohio, USA). All of these chemicals were analytical grade, and methanol was chromatographic grade.
Apparatus and device
Satisfactory separation of the FA-DNPH derivative from the DNPH substrate was achieved by Agilent 1290 (Palo Alto, CA, USA) and Bruker 320 GC-MS (Bruker, Germany) systems. The ultra-performance liquid chromatography (UPLC) was equipped with a Zorbax Eclipse Plus C18 column (50 mm × 2.1 mm i.d., 1.8 μm) (Palo Alto, CA, USA). The GC-MS system was equipped with a Pulverizer (FW135, TaiSiTe instrument Co., Ltd, Tianjin, China) and a DB-5 capillary column (30 m × 0.32 mm × 0.25 μm).
Sample preparation
The distillation of smoked meat product was measured by a modified method of Zhu et al.[Citation2] Two grams of distillated smoked meat sample solutions was finally diluted to 250 mL. The 2 g mince of smoked meat sample was weighed into 10 mL deionized water, and the mixture was homogenized at 5000 rpm for 20 s in an ice bath. The sample was centrifuged at 2000×g for 10 min at 4°C after standing for 2 h. A mixture of the homogenate and 3 mL 10% phosphoric acid solution was transferred into the distiller. The water coolant flow rate was limited in a certain value at 2.2 × 10⁻⁵m3/s, and the receiving device with 10 mL of double distilled water was put in an ice bath. After distilling for 50 min, the distillate was diluted to 250 mL. The blank was distilled with deionized water instead of smoked meat samples using the same process.
Physicochemical characteristics of smoked meat products
The moisture content was determined by drying the meat products at 100–105ºC until a constant weight was reached (ISO 1442:1997).[Citation16] Total lipid content was extracted from smoked meat products according to the method described by Folch et al.[Citation17] by homogenizing 20 g of minced muscle in 250 ml of CHCl3:MeOH (2:1 v/v).
Solution preparation
Analytical-grade chemicals used were of the highest purity available from their sources. The 10% phosphoric acid solution was prepared by diluting 10 mL of phosphoric acid to 100 mL with deionized water. The DNPH solution was prepared by dissolving 100 mg DNPH in 24 mL concentrated hydrochloric acid, and then the mixture was diluted to 1000 mL with deionized water.
UPLC analysis
The preparative sarcodous distillate and DNPH was derived for the detection of FA by UPLC in this experiment. Dosage of DNPH, temperature, and time of water bath, and times of extraction were chosen as four factors of the single factor experiment. Added 1 mL sarcodous distillate to proper amount of DNPH solution, the mixture was then heated in the water bath at a certain temperature for a period. After it, the mixture was cooled to ambient temperature using running water. Then, 2 mL of dichloromethane was added for extraction. The homogenized sample was centrifuged at 5000×g for 2 min at 4°C, and then was extracted with 1 mL of dichloromethane for certain times and dehydrated by sodium sulfate anhydrous column following by freeze-drying. The extract powder was dissolved in 1.0 mL chromatographic pure methanol, filtered through a 0.22 µm microporous syringe filter, and then stored at 4°C in a refrigerator for UPLC analysis.
Chromatographic conditions
The mobile phase contained a mixture of methyl and water in a ratio of 55:45(v/v). Analysis was performed at a flow rate of 0.5 mL/min and column temperature of 40°C. The detector wavelength was decided by the maximum absorption wavelength of the wave scanning of FA-DNPH at 210–400 nm. The injection volume was 1 μL because of the high performance of UPLC.
Wave scanning of FA-DNPH
The 1 mL of 2.5 μg/mL FA standard solution was treated with 0.4 mL of DNPH solution, and then the mixture was heated in the water bath at 60°C for 60 min. After the mixture was cooled to ambient temperature (25°C), 2 mL of dichloromethane was added twice for extraction. The subnatant of extraction was mixed and dehydrated by sodium sulfate anhydrous column, and then dried to constant weigh in 60°C water bath. The 1.0 mL of cooled chromatographic pure methanol was used to dissolve the residue. The FA-DNPH’ methanol solution was filtered through a 0.22 µm microporous syringe filter for UPLC analysis at 210–400 nm.
Derivation procedure
The determination of dosage of DNPH could ensure the adequacy of DNPH dosage during the detection process of FA. The selected concentration and the dosage of FA standard solution were 10 μg/mL and 1 mL, respectively. One milliliter of FA standard solution was added into 5 mL colorimetric tubes with plug, and then 0.05, 0.10, 0.15, 0.20, 0.25, 0.30, 0.35, and 0.40 mL of DNPH solution was added respectively before the treatment in the water bath at 60°C for 60 min. The procedure above mentioned was the same with apply to be appropriate for derivation temperature and time to optimize the elution condition. The differences were the mixture of FA standard solution and DNPH solution was placed in the water bath at 30, 35, 40, 45, 50, 55, 60, 65, and 70°C. The derivation time set for 10, 20, 30, 40, 50, and 60 min, respectively.
After cooling to the ambient temperature with running water quickly, 2 mL of dichloromethane was added. The mixture was then extracted by vortex mixers for 1 min, and then centrifuged at 5000×g for 2 min at 4°C. The supernatant was then extracted and centrifuged again at 5000×g for 2 min at 4°C. Sodium sulfate anhydrous column was used to dry the extraction supernatant until reaching constant weight. To dissolve the residue after cooling down, 1.0 mL of chromatographic pure methanol was added. Then the mixture was filtered through a 0.22 µm microporous syringe filter for UPLC analysis.
Calibration
The calibration curve was plotted taking peak areas of the FA-DNPH derivative obtained for FA standard solutions at 0, 1, 2.5, 5, 7.5, 10 μg/mL, respectively which later reacted with DNPH under the optimized conditions as described in 2.5.1. The peak area of FA-DNPH derivatives (Y) was considered as ordinate and FA mass concentration (μg/L, X) as abscissa to draw the standard curves after the UPLC and GC-MS analysis.
Verification tests
Recovery, accuracy and detection limit were determined with the following methods for the UPLC and GC-MS established.
Recovery of standard addition: To determine the recovery of standard addition, FA solution was added in levels of 20, 40, and 60 mg/kg to smoked meat samples. The recovery of standard addition was calculated using the following formula:
where V1 is the amount of FA after adding FA standard solution; V2 is the amount of FA without adding FA standard solution; C means the added amount of FA standard solution in sample.
Relation standard deviation: The repeatability relative standard deviation (RSD) and reproducibility RSD were conducted with a sample size of six.
Detection limit: 1 mL distilled sample solutions was diluted and then reacted with DNPH. When the peak height was about three times of that of Signal Noise, the sample concentration was exactly the detection limit. The noise peak height could be determined by recording the height of the baseline noise peak after amplification against a relatively milder section of baseline as reference.
Statistical analysis
One-way analysis of variance (ANOVA) and correlation analysis were performed with SAS 9.0 (SAS Institute Inc., Cary, North Carolina, USA). The means were compared by Fisher’s least significant difference test (LSD). Differences were considered significant at p < 0.05.
Comparison with spectrophotometry and UPLC methods
UPLC Method was compared with colorimetric method in the detection of FA, and UPLC was applied to investigate the FA in market smoked meat products.
Results and discussion
UPLC analysis
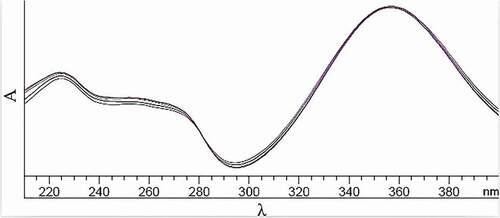
Scan of FA-DNPH: The ultraviolet spectrum of FA-DNPH between 210 and 400 nm is shown in . The maximum adsorption wavelength was determined as 356 nm. Thus 356 nm was selected as the analysis wavelength in latter UPLC analysis.
Figure 1. Ultraviolet spectrum of FA-DNPH.
Effect of the dosage of DNPH on the derivatization of FA: The effect of the dosage of DNPH was examined from 0.05 to 0.40 mL (). The peak area of FA-DNPH increased from 317.8 to 463.2 with the dosage of DNPH increased from 0.05 to 0.30 mL. The peak area of FA-DNPH had no significant change after 0.30 mL (p > 0.05). The results suggest that the peak area was increased with the added DNPH amounts until 0.30 mL of DNPH. The constant reaction yield of 98% was obtained by Tuss (1982) at molar ratios of DNPH/FA higher than 40. Zegota (1999) obtained at molar ratio of DNPH/FA was higher than 5. Compared to these results, the present result of molar ratios of DNPH/FA (4.55) was much less. Tuss et al. indicated sectional decomposition of FA-DNPH derivative in acid solution may lead to derivatization efficiency at low molar ratios of reactants reducing. [Citation18] They demonstrated this view by dissolving pure derivation in 1M HCl solution and found that the FA-DNPH content decreased while the DNPH content increased. Considering the reaction yield of FA-DNPH and saving reagent, the dosage of DNPH was determined as 0.30 mL.
Figure 2. Effect of the dosage of DNPH on derivatization of FA.
Effect of derivatization temperature on the derivatization of FA: The derivatization temperature could influence the extraction and derivation of FA. The derivatization temperature was gradually increased by 5°C from 30 to 70°C (). Correspondingly, the peak area of derivative increased from 40.02 to 62.58. When the derivatization temperature was over 60°C, the peak area of derivative decreased remarkably due to effumability of FA. Thus the derivatization temperature of 60°C was chosen in this study.
Figure 3. Effect of derivation temperature on derivatization of FA.
Effect of derivation time on the derivatization of FA: The effect of derivation time ranging from 10 to 60 min on the derivatization of FA was investigated (). The derivation time had an influence on the peak area of FA-DNPH. The peak area was significantly increased (p < 0.05) from 43.18 to 62.01 with the time from 10 to 40 min. However, there was no significant change to the peak area when the time was longer than 40 min (p > 0.05). Thus 40 min was selected in the following experiment.
Figure 4. Effect of derivation time on derivatization of FA.
Effect of extraction times on the derivatization of FA: To obtain the highest recovery of FA, a series of extraction times, including 1, 2, 3, and 4 times extraction, were used to optimize the elution condition (). The peak area of two times extraction (62.91) was 9.11 higher than that of once extraction, and was not further enhanced with the increased extraction times. The results mean that the peak area of two times extraction was significantly higher than that of once extraction (p < 0.05) while the difference in the peak areas among twice extraction, three times extraction, and four times extraction was not significant (p > 0.05). The possible reason may be that the derivatives were not extracted completely in once extraction while twice extraction extracted the derivatives completely. In this work, twice extraction was selected as the final extraction times.
Figure 5. Effect of extraction times on derivatization of FA.
Calibration curve
The standard curve was plotted by peak areas of the FA-DNPH derivative obtained at levels of 0, 1, 2.5, 5, 7.5, and 10 μg/mL of FA standard solution (). The calibration curve (y = 46.414 × −3.1823) was conducted with a sample size of 3. The calibration curve showed a correlation coefficient (r2 = 0.9994) for FA-DNPH derivative.
Figure 6. Standard calibration curve for FA concentration.
Verification and comparison of UPLC and spectrophotometry method
Both developed UPLC method and the spectrophotometry method were applied for the quantitative determination of FA in smoked meat products. [Citation2] The comparative results are showed in . Repeatability RSD of spectrophotometry method was 2.67%, while UPLC was 0.57% less. Reproducibility RSD of UPLC method (4.98%) was 1.56% less than that of spectrophotometry method (6.54%). The result was also lower than that of Wani et al., who used an immunosensor to detect thyroxine and triiodothyronine in serum. In that study, the precision results (%RSD) of calibration curves did not exceed 9.03% in case of triiodothyronine and 11.87% in case of thyroxine.[Citation19] However, when FA biosensors were used to determine the formalin in fish samples, it had good RSD which was less than 1%.[Citation20]
Table 1. Results of the verification test of UPLC and spectrophotometry method.
Detection limit of spectrophotometry method (0.46 μg/g) was 1.84-fold of UPLC method. By comparison, when ELISA was used to measure thyroid-stimulating hormone for diagnosis of thyroid disease, the limit of detection of the immunosensor was 0.4 mIU L−1, which caused 10% inhibition of the maximum signal.[Citation21] Besides, UPLC method showed high recovery of standard addition (86.71–93.08%) than spectrophotometry method (78.97–89.23%).
In general, compared with spectrophotometry method, the present method showed advantages of high recovery and sensitivity, and lower detection limit. Furthermore, the published methods were mainly applied to determine FA in mushroom, beers, sea fishes, fruit juice, pork, pear, crustaceans, ginseng, wines, and water, but none of them was applied to smoked meat products. The developed UPLC method provides an alternative technique for the determination of FA in smoked meat product.
Application of UPLC method
Traditional smoked meats and sausages are popular in for its smoky flavor and attractive color. Here the commercial samples from five companies were selected to investigate FA content by the developed UPLC method. FA content of surface layer and internal part of these meats was detected ( and ). The results showed that FA contents of the surface layer in all of five samples were much higher than that of internal FA (p < 0.05), indicating that FA was mainly deposited in the surface layer of smoked meat products and migrated into the internal. The highest FA amount in the surface layer of the third sample was 176.61 mg/kg meat among the five samples. The fifth sample, whereas, had the lowest FA. The probable reason was due to smoking temperature and duration. In general, meat was smoked under 50 ~ 75°C for 2–10 d in China. Therefore, the longer smoking duration was associated with the less moisture content. Negative correlation was found between moisture content and FA in the surface layer (r = -0.97, p < 0.01). The result was supported by Ledesma et al.,[Citation22] who showed that the Chorizo sample O (extra quality products, a typical Spanish smoked meat product) with the highest benzo(a)pyrene (BaP) content had the lowest moisture content as BaP and FA were generated and deposited on the surface of smoked meat. [Citation23] This could suggest FA content increases as the moisture content decreases, which could occur when increasing smoking time. [Citation24] In view of maximum daily dose reference of FA (0.2 mg/kg body) of the US Environmental Protection Agency (1999),[Citation25] consumption of 70 g of a smoked meat product like the third sample should be avoided for a person with 60 kg body weight.
Table 2. Assay results of five smoked meat samples.
Table 3. Correlation between FA content (both internal and surface) and moisture content in smoked meat products.
Conclusion
In this work, an UPLC method was validated for the quantitative determination of FA in smoked meat products. The method was developed by using steam distillation as extraction method and then derived by DNPH. It had a detection limit as low as 0.25 μg/g, and the recovery of standard addition ranged of 86.71–93.08%. The results demonstrate that the method showed some advantages such as good linearity, accuracy, and precision with less detection limit compared to spectrophotometry method. These results are successfully applied to control the quality of smoked meat products. The method is fit-for-purpose and would be suitable as reference method to estimate FA in other kind of food.
Additional information
Funding
References
- Visciano, P.; Perugini, M.; Conte, F.; Amorena, M. Polycyclic Aromatic Hydrocarbons in Farmed Rainbow Trout (Oncorhynchus mykiss) Processed by Traditional Flue Gas Smoking and by Liquid Smoke Flavourings. Food and Chemical Toxicology. 2008, 46, 1409–1413. DOI: 10.1016/j.fct.2008.01.001.
- Zhu, Y.; Peng, Z.; Wang, M.; Wang, R.; Rui, L. Optimization of Extraction Procedure for Formaldehyde Assay in Smoked Meat Products. Journal of Food Composition and Analysis. 2012, 28, 1–7. DOI: 10.1016/j.jfca.2012.07.002.
- Xu, J.; Zhang, Y.; Zeng, L.; Liu, J.; Kinsella, J. M.; Sheng, R. A Simple Naphthalene-Based Fluorescent Probe for High Selective Detection of Formaldehyde in Toffees and HeLa Cells via aza-Cope Reaction. Talanta. 2016, 160, 645–652. DOI: 10.1016/j.talanta.2016.08.010.
- Yue, X. F.; Zhang, Y.; Zhang, Z. Q. An Air-Driving FI Device with Merging Zones Technique for the Determination of Formaldehyde in Beers. Food Chemistry. 2007, 102, 90–94. DOI: 10.1016/j.foodchem.2006.05.005.
- de Freitas Rezende, F. B.; Cheibub, A. M. D. S. S.; Netto, A. D. P.; de Carvalho Marques, F. F. Determination of Formaldehyde in Bovine Milk Using a High Sensitivity HPLC-UV Method. Microchemical Journal. 2017, 134, 383–389. DOI: 10.1016/j.microc.2017.07.003.
- Wahed, P.; Razzaq, M. A.; Dharmapuri, S.; Corrales, M. Determination of Formaldehyde in Food and Feed by an In-House Validated HPLC Method. Food Chemistry. 2016, 202, 476–483. DOI: 10.1016/j.foodchem.2016.01.136.
- Wang, T.; Gao, X.; Tong, J.; Chen, L. Determination of Formaldehyde in Beer Based on Cloud Point Extraction Using 2, 4-Dinitrophenylhydrazine as Derivative Reagent. Food Chemistry. 2012, 131, 1577–1582. DOI: 10.1016/j.foodchem.2011.10.021.
- Weng, X.; Chon, C. H.; Jiang, H.; Li, D. Rapid Detection of Formaldehyde Concentration in Food on a Polydimethylsiloxane (PDMS) Microfluidic Chip. Food Chemistry. 2009, 114, 1079–1082. DOI: 10.1016/j.foodchem.2008.10.027.
- Bianchi, F.; Careri, M.; Musci, M.; Mangia, A. Fish and Food Safety: Determination of Formaldehyde in 12 Fish Species by SPME Extraction and GC–MS Analysis. Food Chemistry. 2007, 100, 1049–1053. DOI: 10.1016/j.foodchem.2005.09.089.
- Sibirny, V.; Demkiv, O.; Klepach, H.; Honchar, T.; Gonchar, M. Alcohol Oxidase-And Formaldehyde Dehydrogenase-Based Enzymatic Methods for Formaldehyde Assay in Fish Food Products. Food Chemistry. 2011, 127, 774–779. DOI: 10.1016/j.foodchem.2010.12.146.
- Zhang, D.; Zhang, J.; Li, M.; Li, W.; Aimaiti, G.; Tuersun, G.; Ye, J.; Chu, Q. A Novel Miniaturised Electrophoretic Method for Determining Formaldehyde and Acetaldehyde in Food Using 2-Thiobarbituric Acid Derivatisation. Food Chemistry. 2011, 129, 206–212. DOI: 10.1016/j.foodchem.2011.04.025.
- Wani, T. A.; Zargar, S. New Ultra-Performance Liquid Chromatography-Tandem Mass Spectrometry Method for the Determination of Irbesartan in Human Plasma. Journal of Food and Drug Analysis. 2015, 23(3), 569–576. DOI: 10.1016/j.jfda.2015.02.008.
- Wani, T. A.; Zargar, S. New Highly-Sensitive Ultra-Performance Liquid Chromatography-Mass Spectrometry Method for Quantification of Telmisartan in Human Plasma. Tropical Journal of Pharmaceutical Research. 2015, 14(3), 511–518. DOI: 10.4314/tjpr.v14i3.21.
- Zargar, S.; Wani, T. A. New UPLC-MS/MS Method for Simultaneous Determination of Telmisartan and Hydrochlorthiazide in Human Plasma. Latin American Journal of Pharmacy. 2014, 33, 432–440.
- Wani, T. A. Highly Sensitive Ultra-Performance Liquid Chromatography–Tandem Mass Spectrometry Method for the Determination of Abiraterone in Human Plasma. Analytical Methods. 2013, 5(15), 3693–3699. DOI: 10.1039/c3ay26611g.
- Li, J.; Hui, T.; Wang, F.; Li, S.; Cui, B.; Cui, Y.; Peng, Z. Chinese Red Pepper (Zanthoxylum bungeanum Maxim.) Leaf Extract as Natural Antioxidants in Salted Silver Carp (Hypophthalmichthys molitrix) in Dorsal and Ventral Muscles during Processing. Food Control. 2015, 56, 9–17. DOI: 10.1016/j.foodcont.2015.03.001.
- Floch, J.; Lees, M.; Slona-Stanley, G. R. A Simple Method for the Isolation and Purification of Total Lipid from Animal Tissues. Journal of Biology Chemistry. 1957, 226, 497–509.
- Tuss, H.; Neitzert, V.; Seiler, W.; Neeb, R. Method for Determination of Formaldehyde in Air in the Pptv-Range by HPLC after Extraction as 2, 4-Dinitrophenyl-Hydrazone. Fresenius’ Zeitschrift Für Analytische Chemie. 1982, 312, 613–617. DOI: 10.1007/BF00492064.
- Wani, T. A.; Zargar, S.; Majid, S.; Darwish, I. A. Analytical Application of Flow Immunosensor in Detection of Thyroxine and Triiodothyronine in Serum. Assay and Drug Development Technologies. 2016, 14(9), 535–542. DOI: 10.1089/adt.2016.736.
- Noor Aini, B.; Siddiquee, S.; Ampon, K. Development of Formaldehyde Biosensor for Determination of Formalin in Fish Samples; Malabar Red Snapper (Lutjanus malabaricus) and Longtail Tuna (Thunnus tonggol). Biosensors. 2016, 6(3), 32. DOI: 10.3390/bios6030032.
- Wani, T. A.; Zargar, S.; Wakil, S. M.; Darwish, I. A. New Analytical Application of Antibody-Based Biosensor in Estimation of Thyroid-Stimulating Hormone in Serum. Bioanalysis. 2016, 8(7), 625–632. DOI: 10.4155/bio-2015-0034.
- Ledesma, E.; Rendueles, M.; Díaz, M. Spanish Smoked Meat Products: Benzo (A) Pyrene (Bap) Contamination and Moisture. Journal of Food Composition and Analysis. 2015, 37, 87–94. DOI: 10.1016/j.jfca.2014.09.004.
- Ledesma, E.; Rendueles, M.; Díaz, M. Contamination of Meat Products during Smoking by Polycyclic Aromatic Hydrocarbons: Processes and Prevention. Food Control. 2016, 60, 64–87. DOI: 10.1016/j.foodcont.2015.07.016.
- Djinovic, J.; Popovic, A.; Jira, W. Polycyclic Aromatic Hydrocarbons (PAHs) in Different Types of Smoked Meat Products from Serbia. Meat Science. 2008, 80, 449–456. DOI: 10.1016/j.meatsci.2008.01.008.
- Environmental Protection Agency (US). Integrated Risk Information System on Formaldehyde, National Center for Environmental Assessment; Office of Research and Development: Washington, DC, 1999.