
ABSTRACT
Edible flowers are referred to the non-toxic flowers that can be consumed by human beings for their additional nutritional or medical properties. These flowers are rich source of natural antioxidants, thus exert specific positive health effects on chronic diseases and act as a potential function food. This research paper is focused on the determination of total phenolic content (TPC), total flavonoids content (TFC), and antioxidant capacities of different kinds of edible flowers in China and compared systematically. Sixty-five flower samples were collected from parks in Guangzhou and also purchased from Qingping Market. TPC, TFC, and three anti-oxidative assays (DPPH free radical scavenging activity, ABTS radical scavenging activity, and Ferric reducing antioxidant capacity (FRAP) assay) were conducted. Different flowers presented diverse range of antioxidant capacities, phenolic contents, and flavonoid contents. A high correlation between TPC and antioxidant activity (as accessed using three different methods) was reported. However, a low relationship was observed between TFC value and antioxidant capacities. This study revealed that five Rosa species exhibited strong antioxidant capacities among other samples, and these can be used as potential functional foods to counterbalance the effect of reactive oxygen species (ROS) and oxidative stress.
Introduction
Edible flowers are referred to as the flowers that are non-toxic and can be consumed by human for their additional nutritional and medicinal properties.[Citation1,Citation2] In China, the consumption of edible flowers is increasing continuously. Chinese have used edible flowers as herbal cuisine, flavor enhancer, or even for garnishing food since the ancient time.[Citation3]
Edible flowers are reported to be great sources of antioxidants. These antioxidants act as potential protective agents for elimination of reactive oxygen species (ROS) produced during endogenous metabolic processes. Thus, the edible flowers have been reported to exhibit health promotion effects on chronic diseases including cancers, cardiovascular diseases, chronic inflammation, immune system decline, and diabetes.[Citation4–Citation6] Previous studies focused on edible flowers reported that among all the antioxidants, phenolic acids and flavonoids are the major phytochemicals present in the edible flowers.[Citation4,Citation7]
Phenolic compounds, defined as aromatic compounds with at least one ring structures and one or more hydroxyl groups, are one category of the important phytochemicals presented in plants, especially in edible flowers.[Citation8,Citation9] Flavonoids (flavones, flavonols, flavanones and anthocyanins) are a large subgroup of phenolics, reported to be present in significant amount in edible flowers. Flavonoids are defined as molecules with at least two carbon-linked rings structure bearing one or more hydroxyl groups. Both phenolic acids and flavonoids have presented substantial evidences of antioxidant effects due to their actions on free radical scavenging.[Citation4,Citation6,Citation10]
Edible flowers have gained the attention of food scientists and functional food companies due to their specific positive health effects on human bodies and potential to act as a functional food. Thus, the study of the bioactive substances present in edible flowers is of prime importance for the better understanding of their health benefits on human. Although a number of articles provided the fact that certain common edible flowers contain high quantity of bioactive substances such as phenolics and flavonoids. But, up to our best knowledge, systematic comparative studies on the phenolic profiles including phenolic acids, flavonoids, and antioxidant capacity of large number of edible flowers have not been carried out till now. This research intends to determine the total phenolic contents, total flavonoid contents, and antioxidant capacities of 65 edible flowers collected from China. The result of this study can provide a more complete profile of antioxidant capacities, total phenolics and total flavonoids of a great number of commonly consumed edible flowers from China.
Materials and methods
Chemicals and materials
Folin-Ciocalteu reagent, (+)-catechin, 2,4,6-tri (2-pyridyl)-s-triazine (TPTZ), phosphate buffer saline (PBS), 2-diphenyl-1-picryhydrazyl (DPPH), 2,2ʹ-azino-bis (3-ethylbenzothiazoline-6-sulfonic acid) (ABTS), butylated hydroxytoluene (BHT) were obtained from Shanghai Yuanye Biotechnology Co., Ltd. 6-Hydroxy-2,5,7,8-tetramethlchroman-2-carboxylic acid (Trolox) and trifluroacetic acid (TFA) were purchased from Sigma-Aldrich Co., Ltd. (Shanghai, China). Sodium carbonate, sodium nitrite, gallic acid, sodium hydroxide, aluminum chloride hexahydrate, absolute ethanol, absolute methanol, acetone, acetic acid, potassium persulphate, sodium acetate trihydrate, glacial acetic acid, saturated hydrochloride, ferric chloride, and ferrous sulfate were purchased from Tianjin Damao Chemical Reagent Co., Ltd. (Tianjin, China). All chemicals were of analytic grade unless specially mentioned.
Sample collection, morphology, and moisture content of flowers
Thirty-nine kinds of flower samples were collected from the Qingping Market, Guangzhou and 26 samples were collected from local parks in Guangzhou, China. In order to make sure that the selected flowers were non-toxic and edible, selection process was carried out carefully according to some illustrated handbook and previous researches.[Citation4,Citation11–Citation16] The collected flower samples were air-dried for 1 month. The sample ID, Chinese names, English names, scientific names, moisture content, morphology, and sources of respective flowers are presented in .
Table 1. Sample ID, Chinese names, English names, scientific names, moisture content, morphology, and sources of 65 edible flowers.
Sample preparation
To determine total phenolics and antioxidant assays, the flowers samples were cut into fine pieces by a scissor. Each dry sample (0.500 g) was soaked in 10 mL of acetone/water/acetic acid (70:29.5:0.5, v/v/v) solvent in 15 mL centrifuge tubes according to the method of Li et al.[Citation4] The samples were extracted twice by shaking on an orbital shaker at 200 rpm for 3 hours each at room temperature, followed by a centrifugation at 3000 rpm for 10 min. The extracts were combined in 50 mL centrifuge tube and the final volume of extract was recorded. The extracts of different samples were stored at 4°C until further analysis.
Determination of Total Phenolic Content (TPC) and Total Flavonoid Content (TFC)
TPC was determined according to the method of Xu et al.[Citation17] TPC was expressed as gallic acid equivalents (mg of GAE/g sample) on dry weight basis. TFC was evaluated by a colorimetric analysis.[Citation17,Citation18] TFC was calculated as catechin equivalents (mg CAE/g sample) on dry weight basis.
Determination of antioxidant activity
DPPH free radical scavenging activity of edible flower samples were determined calorimetrically according to the method of Xu and Chang.[Citation18] Trolox was used as the standard. The results were presented as Trolox equivalents (μmole TE/g sample) on dry weight basis. The ABTS radical scavenging capacity assay was performed referring to Miller.[Citation19] The ABTS radical scavenging activity was expressed as Trolox equivalents (μmole TE/g sample) on dry weight basis. The FRAP assay was performed by a colorimetric analysis using Fe2+as the external standard.[Citation18] The results were expressed as Fe2+ equivalents (mmole of Fe2+E/100 g) sample on dry weight basis.
Statistical analysis
The final data were expressed as mean ± standard deviation (dry weight basis) of three independent determinations of each test. The significant differences were calculated by analysis of variance (ANOVA) using statistical software SPSS (SPSS 15.0.1, Chicago, USA).
Results
Total Phenolic Content of edible flowers
TPC values of 65 flower samples are presented in . The TPC of the flowers varied from 5.48 mg GAE/g in cucumber flower to 312.21 mg GAE/g in rose, with over 55 folds’ difference. The TPC of China rose ranked as second with 284.80 mg GAE/g, followed by azalea (249.82 mg GAE/g), pomegranate flower (245.84 mg GAE/g), peony (240.03 mg GAE/g), osmanthus flower (134.05 mg GAE/g), French rose (111.34 mg GAE/g), Yunnan rose (108.94 mg GAE/g), Kunlun chrysanthemum (92.93 mg GAE/g), and honeysuckle (87.48 mg GAE/g). In case of Rosa species, the average TPC value is 171.35 mg GAE/g. Four Rosa species ranked as top 10 flowers high in TPC, except white rose (39.47 ± 0.65 mg GAE/g). In case of frequently consumed flowers (i.e. Rosa species and Chrysanthemum species), it was found that Rosa species exhibits higher phenolic contents.
Table 2. Total phenolic content (TPC) and total flavonoid content (TFC) of 65 flower samples .
Total Flavonoid Content of edible flowers
TFC values of sample extracts are presented in . The TFC values of 65 samples showed a wide variation from 0.67 to 85.31 mg CAE/g, with more than 120-fold difference. Among them, the top 10 flowers with high TFC values are osmanthus flower (85.31 mg CAE/g), honeysuckle (52.51 mg CAE/g), Kunlun chrysanthemum (29.30 mg CAE/g), strawflower (28.59 mg CAE/g), plum blossom (28.50 mg CAE/g), mother chrysanthemum buds (25.39 mg CAE/g), pomegranate flower (24.98 mg CAE/g), nasturtium (24.73 mg CAE/g), China rose (24.13 mg CAE/g), and rose (23.56 mg CAE/g), while cucumber flower had the lowest TFC value (0.67 mg CAE/g). The top 10 TFC values indicated that Chrysanthemum species may contain higher flavonoids than Rosa species.
DPPH free radical scavenging activity of edible flowers
DPPH free radical scavenging capacities (DPPH) of 65 flower samples are displayed in . The DPPH values of different flowers covered a wide range from 8.24 μmole TE/g to 521.99 μmole TE/g. The highest DPPH value was found in rose (521.99 μmole TE/g) followed by forget-me-not (460.78 μmole TE/g), Yunnan rose (422.58 μmole TE/g), China rose (414.46 μmole TE/g), peony (411.47 μmole TE/g), water lily (382.52 μmole TE/g), pomegranate flower (374.40 μmole TE/g), azalea (368.36 μmole TE/g), osmanthus flower (364.62 μmole TE/g), and strawflower (346.17 μmole TE/g). Among these top 10 flowers exhibiting high DPPH value, three of them belong to Rosa species, which may indicate that the bioactive antioxidant compounds in Rosa species favor the reaction of DPPH free radical scavenging capacity. However, there is no Chrysanthemum species in top 10 DPPH values, the mean value of them was 160.72 μmole TE/g.
Table 3. Antioxidant capacities (DPPH, ABTS, and FRAP values) of 65 edible flowers.
ABTS radical scavenging activity of edible flowers
The ABTS values of antioxidant extracts from 65 flowers are presented in . The ABTS value varied from 13.35 μmole TE/g in cucumber flower to 1036.75 μmole TE/g in rose displaying over 77-fold difference. Peony flower observed to have the second highest ABTS value (859.3 μmole TE/g), 17% lower compare to that of rose. Azalea (764.94 μmole TE/g), French rose (530.47 μmole TE/g), Yunnan rose (495.39 μmole TE/g), pomegranate flower (460.32 μmole TE/g), water lily (442.36 μmole TE/g), osmanthus flower (430.44 μmole TE/g), Kunlun chrysanthemum (392.10 μmole TE/g), and honeysuckle (349.40 μmole TE/g) are also ranked in top 10 flowers with high ABTS values. Similar to the results of DPPH free radical scavenging capacities, three Rosa species including rose, Yunnan rose, and French rose are found to have high ABTS values; and Kunlun chrysanthemum is only Chrysanthemum species that ranked in top 10. Water lily, pomegranate flower, osmanthus flower, and azalea flowers also exhibit high antioxidant capacities, according to the list of top 10 edible flowers with high DPPH and ABTS values.
Ferric Reducing Antioxidant Capacity (FRAP) of edible flowers
As shown in , the FRAP values of 65 flowers varied from 4.17 to 362.02 mmole of Fe2+E/100 g and displayed 86-fold difference. China rose, rose, azalea, peony, Yunnan rose, sophora flower, French rose, pomegranate flower, Kunlun chrysanthemum, and osmanthus flower are ranked top 10 flowers containing high FRAP values among 65 flowers under investigation. The FRAP values of these 10 flowers were 362.02 mmole of Fe2+E/100 g, 265.66 mmole of Fe2+E/100 g, 222.58 mmole of Fe2+E/100 g, 189.28 mmole of Fe2+E/100 g, 154.28 mmole of Fe2+E/100 g, 136.39 mmole of Fe2+E/100 g, 129.17 mmole of Fe2+E/100 g, 127.45 mmole of Fe2+E/100 g, 123.46 mmole of Fe2+E/100 g, and119.56 mmole of Fe2+E/100 g, respectively. Pitaya flower exhibits lowest FRAP value (4.17 mmole of Fe2+E/100 g) that is only 1.2% as observed in case of China rose. It is found that four Rosa species listed in the top 10 FRAP values, indicates their strong antioxidant capacities. Pomegranate flower, azalea, peony, and osmanthus flower and two rose species (Rose and Yunnan rose) are the common flowers included in top 10 lists of antioxidant capacities accessed using various methods. However, Kunlun chrysanthemum is the only Chrysanthemum species included in the list of top 10 of various antioxidant capacities testes.
Correlations between phenolics and antioxidant capacities
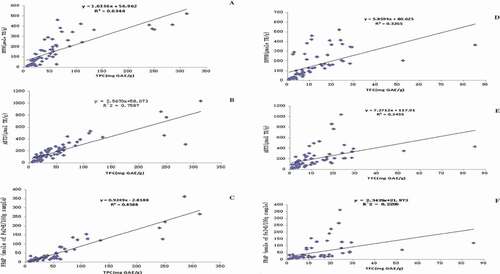
The correlations between total phenolic contents and antioxidant capacities (DPPH, ABTS, and FRAP) of 65 flowers are also presented in . The correlation coefficients of linear regression (R2) of three antioxidant parameters (DPPH, ABTS, and FRAP) and total phenolic contents are 0.6344, 0.7587, and 0.8588, respectively. The correlation between total flavonoid contents and antioxidant capacities (DPPH, ABTS, and FRAP) of 65 flowers are exhibited in . The correlation coefficients (R2) of linear regression of DPPH, ABTS, and FRAP methods and total flavonoid content are observed as 0.3265, 0.2435, and 0.2205, respectively.
Figure 1. Correlations between total phenolic contents and DPPH values (A), total phenolic contents and ABTS (B), total phenolic contents and FRAP (C), total flavonoid contents and DPPH values (D), total flavonoid contents and ABTS (E), and total flavonoid contents and FRAP (F).
Discussions
Phenolics in edible flowers
Phenolic substances, containing more than 10,000 kinds, are the major compounds in the family of phytochemicals.[Citation2] These phenolic substances also exhibit health-promoting effects such as antiplatelet aggregation, antitumor, protection against pathogens,[Citation20] and antiultraviolet radiation effects.[Citation21] Primary functions of phenolic compounds is to act as an antioxidant and provide protection against oxidative stress caused by reactive oxygen species (ROS) and free radicals in human bodies.[Citation4–Citation6]
In this study, the phenolic contents of flower extracts are determined colorimetrically using Folin-Ciocalteu reagent. The Folin-Ciocalteu reagent consists of a mixture of sodium molybdate and sodium tungstate. The reaction between Folin-Ciocalteu reagent and phenolic compounds produces a blue complex that has a maximum absorption at 765 nm.[Citation22] This is probably the most popular procedure for quantifying total phenolics in foods as it is a rapid and simple procedure. However, the Folin-Ciocalteu reagent assay is not specific since compounds with an active hydroxyl group(s) including phenolic acids, flavonoids, reducing sugar, and ascorbic acid can react with Folin-Ciocalteu reagent and yield a blue color complex, which normally overestimates total phenolic contents of samples.[Citation22,Citation23] Everette et al.[Citation22] reported that varieties of compounds such as proteins, thiols, some vitamin derivatives, and amino acids can also react with Folin-Ciocalteu reagent beside the phenolic compounds. The Folin-Ciocalteu assay was suggested to be used as a measure of total antioxidant capacity instead of total phenolic contents. It can be regarded as a rough estimation of total phenolic contents since phenolics are the richest antioxidants in most plants.[Citation24]
As shown in , four Rosa species detected in the experiment including rose (312.21 mg GAE/g), French rose (111.34 mg GAE/g), Yunnan rose (108.94 mg GAE/g), and China rose (284.80 mg GAE/g), are found to have relatively higher TPC value compare to the rest of the samples. Previous studies[Citation4,Citation20,Citation25] have also reported that Rosa species contained high amounts of phenolic compounds, and thus exhibits high TPC values. Zeng et al.[Citation20] reported that rose flower contains high amount TPC (92.16 mg CE/g). Whereas, Li et al. [Citation4] reported significant TPC in case of China rose (35.84 mg GAE/g wet basis); and another study by Xiong et al.[Citation25] reported that China rose and rose high TPC contents 205.5 mg CE/g dry basis and 116.6 mg CE/g dry basis, respectively.
In addition, six kinds of Chrysanthemum species are also explored for the antioxidant potential in the current study. Among them, mother chrysanthemum buds exhibits the highest phenolic content, with 55.04 mg GAE/g dry basis. Whereas, TPC of Anhui white chrysanthemum is about 42% of that observed in mother chrysanthemum buds and ranked the least in Chrysanthemum. In previous studies, Chrysanthemum coronarium was reported to exhibit 3.76 mg GAE/g wet basis TPC[Citation4]; Zeng et al.[Citation20] reported that the TPC values of mother chrysanthemum and Hangzhou white chrysanthemum were 13.04 mg CE/g dry basis and 5.974 mg CE/g dry basis, respectively. Xiong et al.[Citation25] reported that the TPC value of Hangzhou white chrysanthemum was 16.29 mg CE/g dry basis. With respect to the two frangipani samples, the phenolic content of them showed significant difference. The TPC value of red frangipani and yellow frangipani are 56.02 and 20.4 mg GAE/g dry basis, respectively.
Possibly, flower samples from different environmental conditions exhibit different physiological characteristics and chemical compositions. The flower samples in the current study were collected from parks in Guangzhou and Qingping Market in Guangzhou. Previous studies have reported a large variation among TPC, TFC and antioxidant activity of edible flowers. The TPC, TFC, and antioxidant activity of flowers is also reported to be dependent on the extraction method. In this study, flower samples are extracted with 10 mL of acetone/water/acetic acid (70:29.5:0.5, v/v/v) solvent twice using orbital shaker at 200 rpm for 3 hours at room temperature. However, in a study by Xiong et al.[Citation25] 80% acetone, 4 M sodium hydroxide and ethyl acetate was used for extraction. Li et al.[Citation4] used tetrahydrofuran for 30 min for extracting fat-soluble fraction of phenolic contents and methanol/acetic acid/water (50:3.7:46.3, v/v/v) for extracting water-soluble fraction of phenolic contents. Zeng et al.[Citation20] used the distilled water under reflux for 30 min for extraction of sample. Some studies have also expressed TPC as catechin equivalents (mg of CE/g sample). All of these issues such as differences in sample origin, extraction methods, and method employed to access particular compounds, makes it difficult to compare the results of present study with previous studies.
In this study, TPC values of edible flower were observed to be much higher than the commonly consumed fruits and vegetables as reported by Cai et al.[Citation26] The phenolic contents of flower samples in this study were determined based on water-soluble phenolic contents that constitute majority of phenolic contents in flowers.
Flavonoids are another class of phytochemical that also plays a significant role in the antioxidant capacities in flowers. They are found to have a protective function such as reducing the morbidity for cancer and cardiovascular diseases, antitumor, anti-inflammatory, and antiplatelet aggregation activity.[Citation18,Citation27]
In this study, TFC values of flower samples are determined by aluminum chloride colorimetric method. Aluminum chloride forms an acid stable complexes with the C-4 keto group and either the C-3 or C-5 hydroxyl group of flavonoids.[Citation28]
Flower samples under investigation exhibited similar trend for TPC and TFC values. Pomegranate flower, China rose, osmanthus flower, honeysuckle, Kunlun chrysanthemum, and rose observed to exhibit higher values for both TFC and TPC. On the contrary, cucumber flower displays the lowest value for TFC (0.67 mg CAE/g) and TPC (5.48 mg GAE/g).
In case of Rosa species, the TFC value of French rose (13.43 mg CAE/g) was 30% higher than that of Yunnan rose (10.91 mg CAE/g). This trend was is consistent with their TPC values. Although TFC values of commonly consumed edible flowers are rarely reported in previous studies Xiong et al.[Citation25] reported that Rosa flowers contained high amount of flavonoid compounds. China rose was also reported to exhibit significant amount of TFC i.e. 39.54 mg CAE/g. In this study, TPC values for red frangipani and yellow frangipani is observed to be 3.83 and 15.69 mg CAE/g, respectively. The TPC value for red frangipani was three times higher than that of yellow frangipani; this trend was also observed in case of TPC values.
In this study, catechin was used as a calibration standard for total flavonoid contents. Nevertheless, in the study of Xiong et al.[Citation25] the results were expressed as mg of rutin equivalents per gram of dry basis (mg RE/g). Since the standards for calibration of flavonoids are not same, the results between studies may not be comparable.
Antioxidant capacities of edible flowers
Three methods for evaluation of antioxidant capacity are conducted in this study (DPPH, ABTS, and FRAP assay). DPPH free radical scavenging capacity analysis is a simple method to determine the antioxidative capacity of food. The discoloration of violet DPPH reagent indicates the antioxidant capacity of food as the odd electron in DPPH gets paired with hydrogen from antioxidants present in foods. This transformed DPPH free radical to reduced form DPPH-H. The color of DPPH reagent changes from deep violet to light yellow when reacting with antioxidants and measured at 515 nm.[Citation18,Citation29] Trolox, a strong antioxidant, was used as standard in this assay. The DPPH free radical capacities of flower samples are listed in . The DPPH values of top 10 flowers varied from 346.17 μmole TE/g to 521.99 μmole TE/g, that is much higher than that of the rest samples ranging from 8.24 μmole TE/g to 343.60 μmole TE/g. Among the Rosa family, rose and Yunnan rose, grabbed the position in top 10 flowers with high DPPH values. Other two flowers in Rosa family including white rose and French rose also exhibit a relatively higher DPPH values, that is, 269.94 μmole TE/g and 243.34 μmole TE/g, respectively. Rosa species is also reported to have high DPPH values in previous studies. Xiong et al.[Citation25] reported the DPPH value of China rose as 854 μmole TE/g, that is higher as compared to the observation of the present study. Zeng et al.[Citation20] also reported that rose had a great free radical scavenging activity (94.2%) and also ranked the first in their study. DPPH value for mother chrysanthemum and Hangzhou white chrysanthemum is estimated to be approximately 165 μmole TE/g. However, a relatively low DPPH free radical scavenging capacities for mother chrysanthemum (14.1%) and Hangzhou white chrysanthemum (11.9%) were mentioned in a previous study,[Citation20] which were almost the lowest in their study. In this study, cucumber flower possess the lowest DPPH radical scavenging activity (8.24 μmole TE/g) that is only 1.5% of the DPPH value observed in case of rose.
Only a single method for determination of antioxidant capacities of flowers does not provide sufficient persuasion in the comprehensive understanding of phenolic compounds of flower extracts due to the lack of specificity and sensitivity of one method.[Citation30] As a result, the combination of three methods based on different mechanisms may provide more reliable data for the antioxidant capacities of flowers. That’s why ABTS and FRAP assay are also employed along with the DPPH method for antioxidative effectiveness of flowers in this research. ABTS is another method to evaluate the antioxidant capacities of edible flowers in this study. The principle of this method is based on the discoloration of ABTS+ through reducing them by strong antioxidative compounds in samples. Trolox was used as calibration standard for the reaction.[Citation19] ABTS+ reagent is light sensitive and unstable, thus the experiment needs to be finished within 30 minutes.
The ABTS value of rose was the highest (1036.75 μmole TE/g) among all the samples, similar results are also observed with DPPH method. Among the top 10 flowers exhibiting highest ABTS value, three flowers are from Rosa family, that is, rose, Yunnan rose and French rose. Therefore, Rosa species exhibits higher antioxidant capacities than other flowers. In addition, China rose and white rose displays high ABTS values, that is, 309.36 μmole TE/g and 238.75 μmole TE/g, respectively. Similar results for ABTS value (175.39 μmole TE/g wet basis) were also reported in a previous study carried by Li et al.[Citation4]
FRAP assay is another method employed for the determination of antioxidant capacity of edible flowers in this study. The principle of FRAP assay is also based on discoloration. Ferric tripyridyltriazine (Fe(III)-TPTZ) complex is reduced to ferrous tripyridyltriazine (Fe(II)-TPTZ) in low pH environment. This reaction results in the formation of an intense navy blue color and the absorbance of this reaction mixture can be monitored at 593 nm. As shown in , totally four Rosa species are mentioned in the top 10 flowers with higher FRAP values. Similar results are also observed with DPPH and ABTS assay that indicates the high antioxidant activity of Rosa flowers. These observations are in an agreement with previous studies.[Citation4,Citation25]
Researchers have paid a lot of attention to establish a correlation between antioxidant capacities and TPC as well as TFC of various plant materials. Most of the studies have reported the positive correlation between antioxidant capacities and TPC as well as TFC.[Citation2,Citation4,Citation20,Citation25,Citation31] In contrast to this, a study have also reported a negative relation between antioxidant activity and TPC of strawberry.[Citation32] The results of correlation study between TPC, TFC, and antioxidant capacity is presented in . It can be observed that the antioxidant capacity of flowers is significantly related to the TPC values. Whereas, TFC value and antioxidant capacities of flowers exhibit a poor relation.
The term “antioxidant capacity” can be explained as the amount of phenolic contents or the ability of a sample to scavenge free radical. There are several assays reported for determination of antioxidant capacity such as DPPH free radical scavenging, FRAP assay, and ABTS assay. There is actually no correlations among these methods as these methods follow completely different mechanisms. DPPH method is based on the capacity of reducing DPPH free radical; ABTS assay depends on the ability of reducing ABTS+ to the reduced form ABTS, while FRAP method is performed by stabilizing ferric ions to the ferrous form through donating electrons. Thus, the antioxidant capacity of a sample accessed using these methods cannot be compared.
Correlations between phytochemicals and antioxidant capacities
The information in indicated that there is a positive and high correlation between TPC values and antioxidant capacities in edible flowers. However, the correlation coefficients were not as high as the results reported by Li et al.[Citation4] in which the correlation coefficients was 0.954 between TPC value and ABTS assay, and 0.911 between TPC and FRAP assay. The potential reason may be the difference in the extraction solvent. Li et al. focused on the water-soluble fraction of phenolic content along with fat-soluble fraction, both of these fraction contribute to the antioxidant capacity in flowers.[Citation4]
It is clearly observed from that TFC and antioxidant capacity of 65 flowers, demonstrate that flavonoids exhibits less correlation. This observation explains that flavonoid content of flowers has less contribution towards antioxidant capacities of edible flowers. However, previous researches emphasizes on flavonoids as an important antioxidant compounds along with phenolic acids contributes toward the antioxidant capacities of plant materials.[Citation4,Citation7,Citation33]
Conclusion
This study is focused to determine TPC, TFC, DPPH, ABTS, and FRAP values of 65 edible flowers from China. A relatively comprehensive profile of phenolic contents and antioxidant capacities were generated. The high correlations between TPC values and three antioxidative values (DPPH, ABTS, and FRAP) indicated that phenolic contents such as phenolic acids and anthocyanins contributed towards the strong antioxidant capacities of these flowers. However, a low correlation was found between TFC values and DPPH, ABTS and FRAP. Five kinds of Rosa species including rose, white rose, Yunnan rose, China rose, and French rose showed relatively stronger antioxidant capacities and can be used as a potential function food and for elimination of reactive oxygen species that ultimately results in reducing oxidative stress.
Additional information
Funding
Related Research Data
References
- Alasalvar, C.; Pelvan, E.; Ozdemir, K. S.; KocadağLı, T.; Mogol, B. A.; Paslı, A. A.; Ozcan, N.; Ozçelik, B.; Gökmen, V. Compositional, Nutritional, and Functional Characteristics of Instant Teas Produced from Low- and High-Quality Black Teas. Journal of Agricultural and Food Chemistry 2013, 61(31), 7529–7536. DOI: 10.1021/jf4015137.
- Kaisoon, O.; Konczak, I.; Siriamornpun, S. Potential Health Enhancing Properties of Edible Flowers from Thailand. Food research international 2012, 46(2), 563–571. DOI: 10.1016/j.foodres.2011.06.016.
- Mekni, M.; Flamini, G.; Garrab, M.; Hmida, R. B.; Cheraief, I.; Mastouri, M.; Hammami, M. Aroma Volatile Components, Fatty Acids and Antibacterial Activity of Four Tunisian Punica Granatum L. Flower cultivars. industrial crops and products 2013, 48, 111–117. DOI: 10.1016/j.indcrop.2013.04.005.
- Li, A.-N.; Li, S.; Li, H.-B.; Xu, D.-P.; Xu, X.-R.; Chen, F. Total Phenolic Contents and Antioxidant Capacities of 51 Edible and Wild Flowers. Journal of functional foods 2014, 6, 319–330. DOI: 10.1016/j.jff.2013.10.022.
- Liu, R. H.; Hotchkiss, J. H. Potential Genotoxicity of Chronically Elevated Nitric Oxide: A Review. Mutation Research/Reviews in Genetic Toxicology 1995, 339(2), 73–89. DOI: 10.1016/0165-1110(95)90004-7.
- Temple, N. J.;. Antioxidants and Disease: More Questions than Answers. Nutrition Research 2000, 20(3), 449–459. DOI: 10.1016/S0271-5317(00)00138-X.
- Wen, M.; Mao, X. Research Progress on Chemical Composition, Antiinflammatory and Antiallergic Activity of Sophora Viciifolia. Yunnan Journal of Traditional Chinese Medicine 2006, 27, 63–64.
- Kaur, G.; Alam, M. S.; Jabbar, Z.; Javed, K.; Athar, M. Evaluation of Antioxidant Activity of Cassia Siamea Flowers. Journal of Ethnopharmacology 2006, 108(3), 340–348. DOI: 10.1016/j.jep.2006.05.021.
- Song, L.; Wang, X.; Zheng, X.; Huang, D. Polyphenolic Antioxidant Profiles of Yellow Camellia. Food Chemistry 2011, 129(2), 351–357. DOI: 10.1016/j.foodchem.2011.04.083.
- Hinneburg, I.; Dorman, H. D.; Hiltunen, R. Antioxidant Activities of Extracts from Selected Culinary Herbs and Spices. Food Chemistry 2006, 97(1), 122–129. DOI: 10.1016/j.foodchem.2005.03.028.
- Xu, Y.; Sun, G. Edible Flowers and Fruits and Vegetables: Pictorial Handbook of 332 Delicious Flowers and Fruits; Shantou University Press: Shantou, 2009
- Li, Y.; Compendium of Materia Medica: Handbook of Chinese Medicine for Quick Search; Joint Publishing House of Beijing: Beijing, 2014
- Bremness, L.; Herbs; China Friendship Press: Beijing, 2007
- Wang, Y.; Cai, Y. South China Medical Plants; Nanfang Daily Press: Guangzhou, 2011
- Ding, X.; North China Medical Plants: Pictorial Handbook of Approximately 600 Medical Plants in North China.; Nanfang Daily Press: Guangzhou, 2009
- Wang, D.; Edible Flowers; Chemical Industry Press: Beijing, 2014
- Xu, B.; Yuan, S.; Chang, S. Comparative Analyses of Phenolic Composition, Antioxidant Capacity, and Color of Cool Season Legumes and Other Selected Food Legumes. Journal of Food Science 2007, 72, 2. DOI: 10.1111/j.1750-3841.2006.00261.x.
- Xu, B.; Chang, S. A Comparative Study on Phenolic Profiles and Antioxidant Activities of Legumes as Affected by Extraction Solvents. Journal of Food Science 2007, 72, 2. DOI: 10.1111/j.1750-3841.2006.00260.x.
- Miller, N. J.; Rice-Evans, C.; Davies, M. J.; Gopinathan, V.; Milner, A. A Novel Method for Measuring Antioxidant Capacity and Its Application to Monitoring the Antioxidant Status in Premature Neonates. Clinical Science 1993, 84, 4, 407–412.
- Zeng, Y.; Deng, M.; Lv, Z.; Peng, Y. Evaluation of Antioxidant Activities of Extracts from 19 Chinese Edible Flowers. Springerplus 2014, 3(1), 315. DOI: 10.1186/2193-1801-3-315.
- Walter, M.; Marchesan, E. Phenolic Compounds and Antioxidant Activity of Rice. Brazilian Archives of Biology and Technology 2011, 54(2), 371–377. DOI: 10.1590/S1516-89132011000200020.
- Everette, J. D.; Bryant, Q. M.; Green, A. M.; Abbey, Y. A.; Wangila, G. W.; Walker, R. B. Thorough Study of Reactivity of Various Compound Classes toward the Folin− Ciocalteu Reagent. Journal of Agricultural and Food Chemistry 2010, 58(14), 8139–8144. DOI: 10.1021/jf1005935.
- Singleton, V. L.; Orthofer, R.; Lamuela-Raventós, R. M. Analysis of Total Phenols and Other Oxidation Substrates and Antioxidants by Means of Folin-Ciocalteu Reagent. Methods in Enzymology 1999, 299, 152–178.
- Balasundram, N.; Sundram, K.; Samman, S. Phenolic Compounds in Plants and Agri-Industrial By-Products: Antioxidant Activity, Occurrence, and Potential Uses. Food Chemistry 2006, 99(1), 191–203. DOI: 10.1016/j.foodchem.2005.07.042.
- Xiong, L.; Yang, J.; Jiang, Y.; Lu, B.; Hu, Y.; Zhou, F.; Mao, S.; Shen, C. Phenolic Compounds and Antioxidant Capacities of 10 Common Edible Flowers from China. Journal of Food Science 2014, 79, 4. DOI: 10.1111/1750-3841.12404.
- Cai, Y.; Luo, Q.; Sun, M.; Corke, H. Antioxidant Activity and Phenolic Compounds of 112 Traditional Chinese Medicinal Plants Associated with Anticancer. Life Sciences 2004, 74(17), 2157–2184. DOI: 10.1016/j.lfs.2003.09.047.
- Hollman, P.; Hertog, M.; Katan, M. Role of Dietary Flavonoids in Protection against Cancer and Coronary Heart Disease. Biochemical Society Transactions 1996, 24, 785–789.
- Chang, -C.-C.; Yang, M.-H.; Wen, H.-M.; Chern, J.-C. Estimation of Total Flavonoid Content in Propolis by Two Complementary Colorimetric Methods. Journal of Food and Drug Analysis 2002, 10, 3.
- Miliauskas, G.; Venskutonis, P.; Van Beek, T. Screening of Radical Scavenging Activity of Some Medicinal and Aromatic Plant Extracts. Food Chemistry 2004, 85(2), 231–237. DOI: 10.1016/j.foodchem.2003.05.007.
- Xu, B.; Chang, S. K. Total Phenolic, Phenolic Acid, Anthocyanin, Flavan-3-Ol, and Flavonol Profiles and Antioxidant Properties of Pinto and Black Beans (Phaseolus Vulgaris L.) As Affected by Thermal Processing. Journal of Agricultural and Food Chemistry 2009, 57(11), 4754–4764. DOI: 10.1021/jf900695s.
- Navarro-González, I.; González-Barrio, R.; García-Valverde, V.; Bautista-Ortín, A. B.; Periago, M. J. Nutritional Composition and Antioxidant Capacity in Edible Flowers: Characterisation of Phenolic Compounds by HPLC-DAD-ESI/MSn. International Journal of Molecular Sciences 2014, 16(1), 805–822. DOI: 10.3390/ijms16010805.
- Scalzo, J.; Politi, A.; Pellegrini, N.; Mezzetti, B.; Battino, M. Plant Genotype Affects Total Antioxidant Capacity and Phenolic Contents in Fruit. Nutrition 2005, 21(2), 207–213. DOI: 10.1016/j.nut.2004.03.025.
- Chun, O. K.; Kim, D.-O. Consideration on Equivalent Chemicals in Total Phenolic Assay of Chlorogenic Acid-Rich Plums. Food Research International 2004, 37(4), 337–342. DOI: 10.1016/j.foodres.2004.02.001.